Development/Plasticity/Repair
Asymmetric and Distant Effects of a Unilateral Lesion of the
Primary Motor Cortex on the Bilateral Supplementary Motor
Areas in Adult Macaque Monkeys
X
A. Contestabile, R. Colangiulo, M. Lucchini, A.-D. Gindrat, A. Hamadjida, M. Kaeser, J. Savidan, A.F. Wyss,
E.M. Rouiller, and E. Schmidlin
Department of Neurosciences and Movement Sciences, Section of Medicine, Faculty of Sciences and Medicine, Fribourg Center of Cognition, University of Fribourg, Chemin du Muse´e 5, CH-1700 Fribourg, Switzerland
A restricted lesion of the hand area in the primary motor cortex (M1) leads to a deficit of contralesional manual dexterity, followed by an
incomplete functional recovery, accompanied by plastic changes in M1 itself and in other cortical areas on both hemispheres. Using the
marker SMI-32 specific to pyramidal neurons in cortical layers III and V, we investigated the impact of a focal unilateral M1 lesion (hand
representation) on the rostral part (F6) and caudal part (F3) of the supplementary motor area (SMA) in both hemispheres in nine adult
macaque monkeys compared with four intact control monkeys. The M1 lesion induced a consistent interhemispheric asymmetry in
density of SMI-32-positive neurons in F3 layer V (statistically significant in 8 of 9 lesioned monkeys), highly correlated with the lesion
volume and with the duration of functional recovery, but not with the extent of functional recovery itself. Such interhemispheric
asym-metry was neither present in the intact monkeys, as expected, nor in F6 in all monkeys. In addition, the M1 lesion also impacted on the
basal dendritic arborization of F3 layer V neurons. Neuronal density was clearly less affected by the M1 lesion in F3 layer III compared
with layer V. We interpret the remote effect of M1 lesion onto the density of SMI-32-positive neurons and dendritic arborization in the
SMAs bilaterally as the consequence of multiple factors, such as changes of connectivity, diaschisis and various mechanisms involved in
cortical plasticity underlying the functional recovery from the M1 lesion.
Key words: cortical lesion; diaschisis; manual dexterity; motor cortex; nonhuman primate
Introduction
In primates, the hand area of the primary motor cortex (M1 or
F1) and multiple functionally distinct premotor areas contribute
to complex motor behaviors, such as manual dexterity, via
corti-cocortical interactions. Among them, two specific premotor
Received April 9, 2018; revised Sept. 17, 2018; accepted Oct. 9, 2018.
Author contributions: A.-D.G., J.S., E.M.R., and E.S. edited the paper; E.M.R. and E.S. wrote the first draft of the paper; E.S. designed research; A.C., R.C., M.L., A.-D.G., A.H., M.K., J.S., A.F.W., and E.S. performed research; A.C., R.C., M.L., A.-D.G., E.M.R., and E.S. analyzed data; E.M.R. wrote the paper.
This work was supported by the Swiss National Science Foundation, Grants No 31-61857.00, 310000-110005, 31003A-132465, 310030B-149643 (E.M.R.), and 320030-160229 (E.S.); the National Centre of Competence in Re-search on “Neural plasticity and repair”; Novartis Foundation; The Christopher Reeves Foundation (Springfield, NJ); and The Swiss Primate Competence Centre for Research (https://www.unifr.ch/spccr/;http://www.unifr.ch/neuro/ rouiller/SPCCR/welcome.html). We thank the excellent technical assistance of Ve´ronique Moret, Christine Roulin, and Christiane Marti (histology); of Laurent Bossy, Joseph Corpataux, and Jacques Maillard (animal care taking); Andre´ Gaillard (mechanics), Bernard Aebischer, and Andrea Francovich (electronics); Laurent Monney (informatics),
Michael Dougoud, Christian Mazza, Nicolas Fasel and Simon Borgognon (statistics); and S. Bashir and A. Belhaj-Saif for participation in some behavioral experiments.
The anti-Nogo-A antibody was provided by Novartis Pharma AG. The authors declare no other competing finan-cial interests.
Correspondence should be addressed to Dr. E. Schmidlin, Department of Neurosciences and Movement Sciences, Faculty of Sciences and Medicine, University of Fribourg, Chemin du Muse´e 5, CH-1700 Fribourg, Switzerland. E-mail: [email protected].
https://doi.org/10.1523/JNEUROSCI.0904-18.2018 Copyright © 2018 Contestabile et al.
This is an open-access article distributed under the terms of the Creative Commons Attribution License Creative Commons Attribution 4.0 International, which permits unrestricted use, distribution and reproduction in any medium provided that the original work is properly attributed.
Significance Statement
The motor system of macaque monkeys, in addition to be similarly organized as in humans, is a good candidate to study the impact
of a focal lesion of the main contributor to voluntary movements, the primary motor cortex (M1), on non-primary motor cortical
areas also involved in manual dexterity, both at behavioral and structural levels. Our results show that a unilateral permanent
lesion of M1 hand area in nine monkeys affects the interhemispheric balance of the number of SMI-32-positive pyramidal neurons
in the cortical layer V of the supplementary motor area, in a way strongly correlated to the lesion volume and duration of the
incomplete functional recovery.
areas play a particular role: first, the ventral premotor cortex (PMv-r
or F5) is involved in visually guided movements (
Shimazu et al.,
2004
) and is functionally connected to M1 (
Schmidlin et al., 2008
);
second, the supplementary motor area (SMA-proper or F3) is
in-volved in the sequential control of movements, and also directly
controls distal movements of the hand (
Maier et al., 2002
;
Boudrias
et al., 2010
). Structural changes at distant, but directly connected
regions have been shown in New World monkeys subjected to
uni-lateral lesion of M1, in the form of a rewiring of the remaining
F5-to-M1 projection redirected toward the primary somatosensory
cortex (
Dancause et al., 2005
).
The rostral part of SMA (pre-SMA or F6) differs functionally
from its caudal part (F3;
Wiesendanger, 1986
;
Matsuzaka et al., 1992
;
Luppino et al., 1993
;
Dum and Strick, 1996
;
Liu et al., 2002
). F3 is
reciprocally connected with M1, both regions being at the origin of
corticospinal (CS) projections, which is not the case of F6 (
Dum and
Strick, 1991
;
Luppino et al., 1993
,
1994
). Transcallosal
interconnec-tions exist between F3 and the hand representation of M1 although
these projections are less dense than the F3–M1 interconnections
within the same hemisphere (
Rouiller et al., 1994
;
Fig. 1
A).
In case of unilateral lesion of M1, there is evidence that the
ipsilesional SMA may contribute to functional recovery (
McNeal
et al., 2010
;
Morecraft et al., 2015
). Following a lesion affecting
M1, the density of the projection from M1 to SMA will decrease,
and thus the influence of M1 onto SMA will decline. Similarly,
because of a decrease of target neurons in M1, the projection
from SMA to M1 may also be impacted retrogradely. This is
reminiscent of the decrease of neuronal sensitivity to SMI-32
antibody and shrinkage of the soma, which has been observed in
corticospinal neurons in M1 following cervical cord lesion (
Wan-nier et al., 2005
;
Beaud et al., 2008
).
The corticocortical connections involve mostly pyramidal
neurons of origin in layers II, III, and V, selectively stained by
SMI-32 (
Liu et al., 2002
;
Wannier et al., 2005
;
Beaud et al., 2008
;
García-Cabezas and Barbas, 2014
). This allows the comparison of
pyramidal neuronal labeling in the lesioned hemisphere and in
the intact hemisphere. Here, we focused on assessing histological
and cellular changes occurring bilaterally in F3 and F6 (as
possi-ble control region) after a permanent and unilateral lesion of the
hand representation in M1 in macaque monkeys. Assessing the
structural changes in SMA induced by the lesion of a distant, but
densely interconnected cortical area (M1), and their possible link to
functional recovery, may contribute to better identify the
morpho-logical support of cortical plasticity following a cortical lesion in
human, e.g., corticocortical changes following a motor stroke (
Ward
and Cohen, 2004
;
Bestmann et al., 2010
;
Schaechter et al., 2012
).
The aim of the present study was to test the following
hypoth-eses: (1) A unilateral lesion of M1 impacts at distance onto SMA
but asymmetrically in each hemisphere, producing an
interhemi-spheric asymmetry of pyramidal neuronal density in SMA (
Figs.
1
A,
Fig. 5
B). (2) The impact of the M1 lesion on SMA in each
hemisphere depends on the size of the M1 lesion. (3) As SMA is
involved in the functional recovery, the impact of the M1 lesion
on SMA is also correlated with the extent and/or duration of
functional recovery. (4) The impact of the unilateral M1 lesion is
different onto F3 (SMA-proper) and F6 (pre-SMA).
To test these hypotheses, we compared the density and
mor-phology of pyramidal neurons using SMI-32 staining in F3 and
F6 across both hemispheres in four intact macaque monkeys and
in nine macaque monkeys subjected to unilateral lesion of the
hand area in M1.
Materials and Methods
Macaque monkeys. The histological analysis was conducted on 13 adult
macaque monkeys (Macaca fascicularis and M. mulatta;Table 1). All procedures were conducted in accordance with guidelines of the federal and local veterinary authorities (veterinary authorizations FR 24/95/1; FR 44/92/3; FR 157/01; FR 157/03; FR 157/04; FR 156/04; FR 156/06; FR 157e/06; FR 185/08: FR 17/09; FR 192/07E; FR 192/07). Several monkeys were already involved in previous reports addressing distinct issues re-lated to motor cortex lesion (Liu and Rouiller, 1999;Kaeser et al., 2010,
2011;Schmidlin et al., 2011;Bashir et al., 2012;Hamadjida et al., 2012;
Hoogewoud et al., 2013;Wyss et al., 2013;Savidan et al., 2017). Nine animals (IC, IE, MK-IR, IZ, BI, CE, DG, Mk-DI, Mk-GE, Mk-JU, Mk-RO, and Mk-SL) were subjected to a unilateral lesion of the hand region in M1 by using intracortical microinjections of ibotenic acid, as previously reported (Liu and Rouiller, 1999;Kaeser et al., 2010;Hamadjida et al., 2012;Wyss et al., 2013;Murata et al., 2015;
Savidan et al., 2017). We functionally identified the M1 hand represen-tation using intracortical microstimulation in all animals (except Mk-DI) with standard stimulation parameters as reported in detail previously (Wyss et al., 2013,Savidan et al., 2017). As stated bySavidan et al. (2017), Mk-DG was subjected to a first unilateral and permanent cortical pri-mary lesion of M1, which predominant long-term effects are analyzed in our study, whereas short-term effects of a secondary M1 lesion in the opposite hemisphere were most likely modest as the euthanasia of this animal was performed shortly after the secondary lesion. The other four monkeys (Mk-IC, Mk-IE, Mk-IR, and Mk-IZ) had no M1 lesion (intact monkeys used as controls). Two of the nine lesioned monkeys were treated with anti-Nogo-A antibody (Mk-SL and Mk-VA;Kaeser et al., 2010;Hamadjida et al., 2012;Wyss et al., 2013). Comprehensive descrip-tions of the anti-Nogo-A antibody treatment procedure were published earlier (Freund et al., 2007,2009;Hamadjida et al., 2012). In short, a small craniotomy was made in the occipital bone to position a subdural cannula (Alzet osmotic pump) delivering the antibody during 4 weeks. At the end of the behavioral assessments, the animals were euthanized under deep anesthesia obtained with an intraperitoneal overdose of pen-tobarbital sodium (90 mg/kg body weight), as previously reported ( Kae-ser et al., 2010;Wyss et al., 2013).
Histology and neuroanatomical reconstruction. After euthanasia, the
brain was cut in the frontal plane into 50-m-thick frozen sections with both hemispheres facing each other on the same slide (Fig. 2A). Sections
were collected in 5 or 8 consecutive series. One series was Nissl stained and another consecutive series was immunoreacted for the marker SMI-32 (Sternberger and Sternberger, 1983), as previously reported (Wannier et al., 2005;Beaud et al., 2008,2012). Histological structures of interest were vectorised using Neurolucida 9 (MBF Bioscience) with a computer-interfaced Olympus BX40 microscope (Olympus Schweiz AG), a computer-controlled motorized stage (Ma¨rzha¨user Wetzlar GmbH, type EK 32 75⫻ 50) and a digital camera (Olympus U-PMTVC). Frontal brain sections were examined under bright-field illumination. The Photomicrographs taken with the digital camera were further edited in CorelDraw (color, brightness, and contrast were not modified). The quantification of the structures of interest was then performed with the software Neuroexplorer (MBF Bioscience) comparing the two hemi-spheres on the same section. At that step, the investigator was blinded against information on animal group (control vs lesion) and side of the cortical lesion.
The extent of the M1 cortical lesion on each section was defined as the cortical zone showing a loss of SMI-32-positive neurons in layer V of M1, then perpendicularly extended up to the cortical surface and down to the border between white matter and layer VI. Finally, the volume of the M1 cortical lesion (Fig. 1B–E;Table 1) was assessed by integrating the con-secutive sections, using the Cavalieri’s method, as previously described (Pizzimenti et al., 2007;Wyss et al., 2013). SMA (F3 and F6) in both hemispheres was delineated from M1 or PM laterally and from cingulate motor area (CMA) ventrally, based on cytoarchitectural landmarks (Liu et al., 2002). The number of SMI-32-positive neurons in layers III and V was established on each SMI-32 stained section and the surface of the delineated F3 or F6 was calculated in relation with the defined limits. The
cellular density of F3, respectively F6, was defined on individual sections as the number of identified SMI-32-positive cells in that area in one hemisphere divided by the corresponding volume of SMA (given by the thickness of the section multiplied by the area-of-interest). The cell den-sity was assessed at regular intervals along the rostrocaudal axis (Fig. 2E).
The criteria used to include a neuron were the following: (1) the neuron is SMI-32-positive; (2) the soma, the nucleus or the nucleolus and at least four proximal dendrites are identified; and (3) the neuron is located in
the cortical layer III or in layer V. The analysis on the light microscope was conducted at a magnification of 100⫻. In addition, to test the liabil-ity of the neuronal identification method, cell counts were repeated at a magnification of 200⫻ in several sections from different monkeys, yield-ing identical results as those obtained at 100⫻ magnification. In each analyzed histological section, all SMI-32-labeled neurons within the delineated area were counted, corresponding to exhaustive sampling method instead of stereology (Fregosi and Rouiller, 2017). All
histologi-Figure 1. A, Schematic representation of a macaque brain showing the location of pre-SMA (area F6, orange), SMA-proper (area F3, red), and their anatomical connectivity with the M1 (F1,
beige). F2 and F7 correspond to the caudal and rostral parts of the dorsal premotor cortex (PMd), respectively. F4 and F5 correspond to the caudal and rostral parts of the PMv, respectively. The straight double-head arrows in gray represent the interhemispheric connections, with the notion that interhemispheric callosal connections are less dense in F1 than in F3 and F6. Furthermore, F3 projects more strongly on the ipsilateral F1 than on the contralateral F1 (black arrows). The curved double head gray arrows represent the interconnections between F3 and F6. Importantly, F6 does not project to F1 and reciprocally. As explained in the method section, the limit between F3 and F6 was displaced 3 mm rostral to the genu of the arcuate sulcus, to ensure full inclusion of F3 in the histological analysis. B, C, Schematic representation of the extent and location of the F1 lesion (red area) in the nine monkeys involved in the present study, as seen in transparency on the cortical surface. The two monkeys in C were treated with anti-Nogo-A antibody after the lesion, whereas the seven other monkeys (B) were untreated. D, E, Photomicrographs of coronal histological sections through F1 (Mk-DI) showing the induced permanent lesion in the hand representation. Scale bar, 100m.TheadjacentsectionsderivedfromtwoserieswereprocessedtovisualizeSMI-32staining (D) or Nissl staining (E). F, Graphical representation of typical behavioral performance of macaque monkeys in the modified Brinkman board task. The manual performance of each hand is given by the score (number of pellets retrieved in the first 30 s of the task from the randomly distributed wells) as a function of time (days) before and after a lesion of the hand representation in F1. Day 0 corresponds to the day of the lesion (vertical red line). Relevant for the present report are the scores (for the contralesional hand) pre-lesion [(1) the horizontal orange line is the median score] and postlesion [(4), the horizontal orange line is the median score]. The total duration of functional recovery of manual dexterity (2) after lesion is given by the time interval between the lesion (red vertical line) and the onset of the postlesion plateau (vertical blue line). The duration of total loss of manual dexterity [(3) score⫽ 0] is the time interval between the lesion and the first consistent successful attempt to retrieve a pellet (vertical orange line). SAS, Superior arcuate sulcus; IAS, inferior arcuate sulcus; AS, arcuate spur; SP, sulcus principalis; LS, lateral sulcus; CS, central sulcus.
cal samples across monkeys and hemispheres were analyzed according to the same procedure.
Along the rostrocaudal axis, the limit between F3 and F6 was estimated at the level of the genu of the arcuate sulcus (Liu et al., 2002), even though this boundary is difficult to establish, especially on frontal sections. Moreover, considering functional properties, the transition from F3 to F6 is progressive, without abrupt limit (as discussed in detail byLiu et al., 2002). Therefore, histological sections located up to 3 mm rostral to the genu of the arcuate sulcus were included in the F3 block to ensure that F3 was entirely considered. Further rostrally located sections then were in-cluded in the F6 block. Along the mediolateral axis, the analysis of each histological section was limited to the territory of SMA (F3 and F6) located in the vertically oriented portion of the medial wall of the hemi-sphere (Fig. 2A–C), whereas the zone of F3 or F6 including the curvature
on the top of the medial wall and the more lateral portion of cortex on the surface of the hemisphere (Liu et al., 2002) were excluded. Indeed, this curved cortical zone exhibits a more variable layer arrangement and neuronal orientation than the medial wall, preventing a perfectly mirror-like analysis of comparable zones between both hemispheres. Similarly, the ventral part of SMA in the curvature of the cingulate sulcus toward the CMA limit was also excluded from the analysis (Fig. 2A–C).
Interhemispheric difference in cell density. In each section, an
inter-hemispheric difference in cellular density (IDCD) was obtained by sub-tracting the SMI-32-positive neuron density in the contralesional SMA (separately for F3 and F6) from the SMI-32-positive neuron density in the ipsilesional SMA (Fig. 3B, D,F ). Positive IDCD means that more
SMI-32 neurons were found in the ipsilesional SMA whereas negative IDCD implies a larger number of SMI-32 neurons in the contralesional SMA. In intact monkeys, IDCD was expected to be close to zero, whereas in monkeys subjected to M1 lesion, IDCD was hypothesized to be biased toward the negative side (seeFig. 5B, dashed line). The
com-parison between the two hemispheres was performed on each indi-vidual section, confronting the left SMA with the right SMA, as done for M1 in a previous report (Wannier et al., 2005). This way, the mirrored SMA territories analyzed on each side were comparable, both in terms of area and position.
Single-neuron reconstruction. The reconstruction of selected SMI-32
labeled neurons was performed using the vectorization tool from the Neurolucida software. Using a 400⫻ magnification, three SMI-32-positive pyramidal neurons of layer V per hemisphere per section were analyzed in four different sections in each of six representative monkeys: two intact monkeys and four monkeys with a M1 lesion. In the lesion subgroup, two monkeys had a large positive IDCD reflecting a bias
to-ward the ipsilesional hemisphere (Mk-VA and Mk-GE), one monkey presented a balanced IDCD (Mk-JU) and one monkey exhibited an IDCD biased toward the contralesional hemisphere (Mk-CE). The fol-lowing criteria were applied to specifically select SMI-32-positive neu-rons: (1) to be representative of the entire region-of-interest, one neuron was picked in each of the dorsal, middle, and ventral parts of the medial wall in F3 (Fig. 2A, arrows); and (2) at least intact primary and secondary
dendrites and an apical dendrite reaching the layer III without interrup-tion had to be clearly identified (Fig. 2D). For each reconstructed neuron,
we divided the surface of the basal dendrites by the surface of the apical dendrites. To quantify the dendritic arborization, a Sholl analysis was performed (Wellman et al., 2007), by defining concentric virtual circles centered on the soma of the neuron of interest and counting the number of “dendritic intersections” between the described virtual circles located at regular distances from the soma (10m steps) and the identified dendritic arborization. We also determined the surface of the soma and the surface of the apical dendrite for each reconstructed neuron. A second level of quantification of dendritic arborization consisted in in-tegrating the area under the curve of the ratio between dendritic inter-sections and distance from the soma to allow statistical comparisons and regression analysis (seeFig. 5C) as general assessment of the dendritic
tree. It was not possible to apply this high-magnification dendritic anal-ysis (Sholl analanal-ysis) to all selected monkeys because of suboptimal stain-ing quality of some brain sections.
Behavior. The manual dexterity of the nine monkeys subjected to
uni-lateral lesion of M1 was tested using the “modified Brinkman board” task, challenging the opposition of the index finger and the thumb (pre-cision grip) to retrieve small food pellets from 25 vertically oriented wells and 25 horizontally oriented wells randomly distributed over a Perspex board (Schmidlin et al., 2011). The effects of such M1 hand area lesion on this task have been reported in detail earlier (Liu and Rouiller, 1999;
Kaeser et al., 2010;Bashir et al., 2012;Hamadjida et al., 2012; Hooge-woud et al., 2013;Wyss et al., 2013;Savidan et al., 2017). After M1 injury, the contralesional manual dexterity was dramatically affected, and the monkeys exhibited incomplete functional recovery, reaching a plateau of motor performance several months after the M1 lesion (Wyss et al., 2013;
Fig. 1F ). We focused here on the percentage of functional recovery for
the contralesional hand following the unilateral lesion of M1 hand area, given by the median total score (number of pellets retrieved from both vertical and horizontal wells in 30 s) at postlesion plateau divided by the median total score at prelesion plateau⫻ 100 (Schmidlin et al., 2011;
Wyss et al., 2013). An example of prelesion and postlesion median total scores is illustrated inFigure 1F (2 horizontal lines). Similarly, the
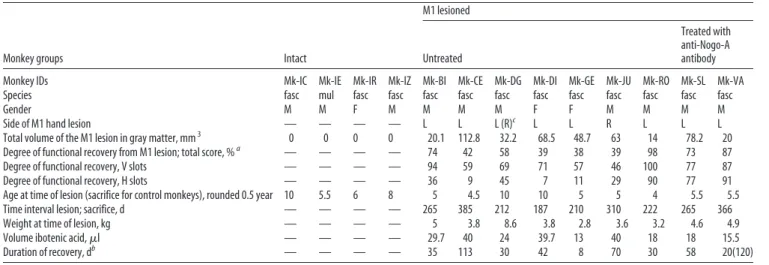
per-Table 1. Summary of the properties of each monkey included in the study
Monkey groups Intact
M1 lesioned
Untreated
Treated with anti-Nogo-A antibody Monkey IDs Mk-IC Mk-IE Mk-IR Mk-IZ Mk-BI Mk-CE Mk-DG Mk-DI Mk-GE Mk-JU Mk-RO Mk-SL Mk-VA Species fasc mul fasc fasc fasc fasc fasc fasc fasc fasc fasc fasc fasc
Gender M M F M M M M F F M M M M
Side of M1 hand lesion — — — — L L L (R)c L L R L L L
Total volume of the M1 lesion in gray matter, mm3 0 0 0 0 20.1 112.8 32.2 68.5 48.7 63 14 78.2 20
Degree of functional recovery from M1 lesion; total score, %a — — — — 74 42 58 39 38 39 98 73 87
Degree of functional recovery, V slots — — — — 94 59 69 71 57 46 100 77 87 Degree of functional recovery, H slots — — — — 36 9 45 7 11 29 90 77 91 Age at time of lesion (sacrifice for control monkeys), rounded 0.5 year 10 5.5 6 8 5 4.5 10 10 5 5 4 5.5 5.5 Time interval lesion; sacrifice, d — — — — 265 385 212 187 210 310 222 265 366 Weight at time of lesion, kg — — — — 5 3.8 8.6 3.8 2.8 3.6 3.2 4.6 4.9 Volume ibotenic acid,l — — — — 29.7 40 24 39.7 13 40 18 18 15.5 Duration of recovery, db — — — — 35 113 30 42 8 70 30 58 20(120) M, Male; F, female; R, right; L, left; fasc, M. fascicularis; mul, M. mulatta.
aExpressed in percentages of postlesion total score at plateau divided by pre-lesion total score in the modified Brinkman board task: all slots. The next two lines are the degrees of functional recovery given separately for the vertical (V) and
horizontal (H) slots. The next two lines are the degrees of functional recovery given separately for the V and H slots.
bTime interval (Fig. 1F ) from the day of lesion to the beginning of postlesion plateau, as defined byKaeser et al. (2011). For Mk-VA, there was a second plateau of recovery that occurred 120 d postlesion, possibly linked to the anti-Nogo-A
antibody treatment in this animal (Wyss et al., 2013).
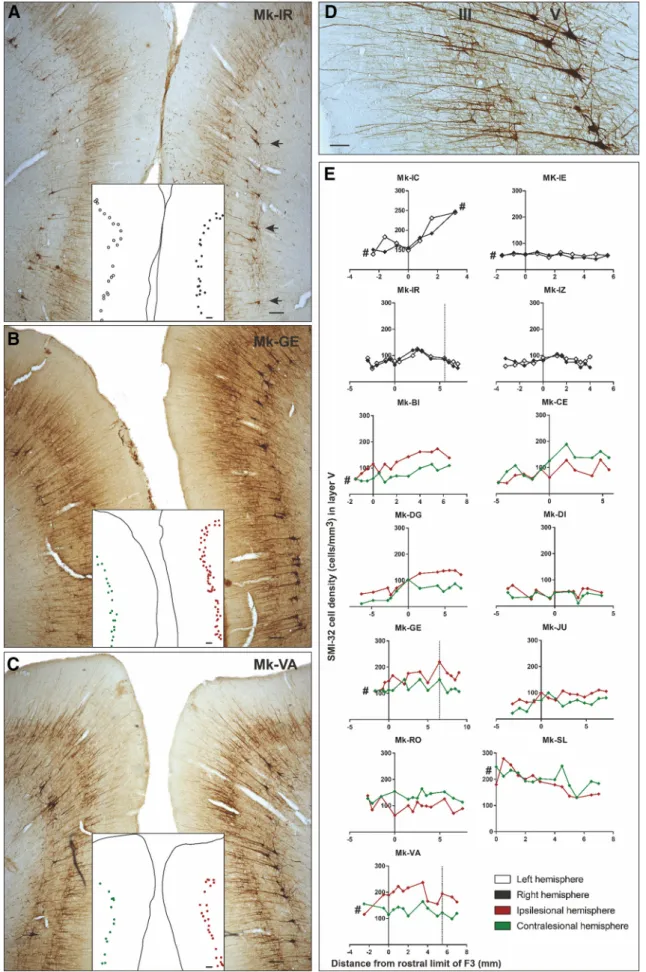
Figure 2. A–C, Photomicrographs of coronal brain histological sections of an intact macaque monkey (A; Mk-IR), a lesioned monkey (B; Mk-GE) and a lesioned monkey treated with the
anti-Nogo-A antibody (C; Mk-VA), all stained with SMI-32. Scale bars, 100m.ThemedialpartofSMAofeachhemisphereisvisibleinthesecoronalsections.ThelocalizationoftheSMI-32-positive neurons taken into account for the Sholl analysis is shown in A (arrows). A dot representation of layer V SMI-32-positive neurons included in our analyses is illustrated in (Figure legend continues.)
centages of functional recovery were calculated separately for the vertical wells and the horizontal wells (Table 1). Moreover, the plot of scores was used to define the duration of total loss of manual dexterity and the duration of (incomplete) functional recovery until reaching a postlesion plateau (Fig. 1F ).
Statistics. To statistically assess the significance of asymmetric densities
of SMI-32-positive neurons between the ipsilesional and contralesional hemispheres, we applied a paired t test or a Wilcoxon test (according to the data distribution) as the neuronal density was directly compared between both hemispheres on the same section, and so on for each indi-vidual animal. In a second level of statistical analysis, we compared the obtained IDCDs between individual animals using a Kruskal–Wallis test (Table 2) including Bonferroni’s corrections (*p⬍ 0.05, **p ⬍ 0.01, ***p⬍ 0.001, ****p ⬍ 0.0001). The2test was used to statistically
evaluate and compare across subgroups of monkeys the frequency of occurrence of significant IDCDs (see Results). To assess the precise role played by the two structural factors, namely the lesion volume in M1 and the IDCD, on the functional recovery, we performed a linear model test on those three factors using the MATLAB R2017b function “fitlm”.
Results
Immediately after ibotenic acid micro-infusion in M1 hand area,
all animals presented a complete and flaccid paresis of the
con-tralesional hand and were totally unable to perform the
behav-ioral task during several days, corresponding to the duration of
functional inactivity after lesion, as illustrated in
Figure 1
F. It was
then followed by a progressive functional recovery until reaching
a postlesion plateau.
Neuronal density
We counted the number of SMI-32-positive neurons in the
de-limited F3 and F6 areas in both hemispheres (
Fig. 2
A–D) along
the rostrocaudal axis in coronal sections from F6 to F3 in 13
macaque monkeys (
Fig. 2
E). The pyramidal SMI-32-positive
neurons were then pooled per hemisphere and per animal. In F3
layer V, the range of SMI-32-positive neurons’ densities in each
hemisphere was comparable in the control (intact) monkeys and
in the lesioned monkeys, varying across histological sections
ap-proximately from 15 cells/mm
3(Mk-DI) to 250 cells/mm
3(Mk-IC and Mk-SL;
Fig. 3
C). In F3 layer III, the cell density range
varied between 100 cells/mm
3(Mk-IZ and Mk-DI) and 600 cells/
mm
3(Mk-SL) both in intact and lesioned monkeys (
Fig. 3
E).
This comparison suggests that after M1 lesion there was no
sub-stantial loss of SMI-32-positive neurons in both layers III and V
of F3 and in layer V of F6 (
Fig. 3
A, C,E). Moreover, in the
major-ity of monkeys, there were more SMI-32-positive neurons in F3
than more rostrally in F6 (
Fig. 2
E).
The assessment of cellular density in layer V of F6 showed no
significant IDCD (
Fig. 3
A, B), both in intact animals and in
uni-laterally M1 lesioned monkeys. This observation indicates that
SMI-32-positive neurons in F6 layer V were not affected by the
unilateral M1 lesion.
Layer V in F3
In contrast to the intact monkeys (no significant IDCD), the
IDCD of SMI-32-positive neurons in F3 layer V was significant in
all M1 lesioned monkeys except Mk-SL (
Fig. 3
C,D). However, the
IDCD was not systematically biased toward the same hemisphere
(ipsilesional vs contralesional;
Fig. 3
D): two lesioned monkeys
(Mk-CE, Mk-RO) exhibited a significantly higher contralesional
density of SMI-32 neurons in F3 layer V, corresponding to a
negative IDCD, while six injured monkeys (BI, DG,
Mk-DI, Mk-GE, Mk-JU, Mk-VA) had a significantly higher
ipsile-sional density of SMI-32 neurons in F3 layer V, corresponding to
a positive IDCD. In Mk-SL, the trend of IDCD toward the
con-tralesional side was not statistically significant in F3 layer V (
Fig.
3
C,D).
Layer III in F3 and F6
There was no significant IDCD of SMI-32-positive neurons in
layer III of both F6 and F3 (
Fig. 3
E) in intact monkeys. The same
was true for F6 layer III in 7 of 9 M1 injured monkeys: only 1
lesioned monkey (Mk-JU) of 9 presented a significantly positive
IDCD and the histological analysis was not performed in another
monkey (Mk-SL) because of missing histological sections.
There was a statistically significant negative IDCD of
SMI-32-positive neurons in F3 layer III in two M1 lesioned monkeys (
Fig.
3
E, F: Mk-CE, Mk-RO) reminiscent of the negative IDCD found
in F3 layer V in these two monkeys (
Fig. 3
C,D). In two other
monkeys (Mk-GE, Mk-DI), there was a significant positive IDCD
in F3 layer III (
Fig. 3
E, F ), whereas in the other five monkeys, the
IDCDs were not statistically significant (
Fig. 3
E, F ).
Overall, statistically significant IDCD differences were found
in 8 of 9 lesioned monkeys in F3 layer V and in 4 of 9 lesioned
monkeys in F3 layer III. These results indicate that the unilateral
M1 lesion had a larger impact on SMI-32 neurons in F3 layer V
(
Fig. 3
D) than in F3 layer III (
Fig. 3
F ). A
2test revealed that the
frequency of significant IDCDs in lesioned monkeys is
statisti-cally different to the frequency in intact monkeys for F3 layer V
IDCDs ( p
⫽ 0.002,
2⫽ 9.244, df ⫽ 1), but not for F3 layer III
IDCDs ( p
⫽ 0.109,
2⫽ 2.568, df ⫽ 1).
Interindividual IDCDs comparison
Interindividual statistical comparisons of IDCDs displayed in
Figure 3
, D and F, were performed, using the nonparametric
Kruskal–Wallis test (
Table 2
). In layer V of F3, there were
statis-tically significant differences of IDCDs, especially between
mon-keys with extended lesion versus ones with small lesion (
Table 2
;
Fig. 3
D). For example, the animal with the largest cortical lesion
(Mk-CE) showed a significant p value with all other animals
ex-cept Mk-SL (
Table 2
), in line with the IDCDs distribution shown
in
Figure 3
F.
Arborization of layer V basal dendrites
To assess microstructural changes of the basal dendritic
arboriza-tion of SMI-32-positive pyramidal neurons located in layer V of
F3, a Sholl analysis was performed in two control animals (Mk-IR
and Mk-IE) and in four representative lesioned monkeys
(Mk-VA, Mk-GE, Mk-JU, and Mk-CE). No interhemispheric
differ-ence was observed in control monkeys, with the same increase of
dendritic intersection numbers going away from the soma,
peak-ing at a distance of
⬃50
m from the soma, followed by a
com-parable progressive decrease at larger distances from the soma
4
(Figure legend continued.) the white insets. The layer V SMI-32-positive neurons in the le-sioned hemisphere (images, right) are indicated with red dots, and the ones in the intact hemisphere (image, left) are indicated with green dots in B–C. Higher-magnification photomi-crograph of a coronal section of F3 in the right hemisphere of a macaque monkey (Mk-VA). Scale bar, 40m. The layers III and V are visible with the corresponding SMI-32-positive pyramidal cells and their identifiable dendritic arborization. E, Graphs representing the rostrocaudal gra-dient (from F6 to F3) of SMI-32-positive cell density in layer V of all monkeys. The cell density for each hemisphere is plotted as a function of the distance from the F3–F6 border, which has been set to 3 mm rostrally to the genu of the arcuate sulcus. Negative distance values belong to F6 and positive distance values belong to F3. Vertical dashed lines (Mk-IR, Mk-GE, and Mk-VA) corre-spond to quantification of SMI-32-positive neurons observed in the photomicrographs of A–C, respectively. The # symbol was used to indicate that the analyzed cortex region was not com-plete (sections lacking for the analysis).
(
Fig. 4
A). In lesioned animals, interhemispheric differences in the
numbers of dendritic intersections were observed in 3 of 4
ani-mals (
Fig. 4
B), with an interhemispheric bias consistent with the
IDCD bias already observed for layer V in F3 (
Fig. 3
C,D) in these
3 monkeys (Mk-VA, Mk-GE, and Mk-CE). This significant
inter-hemispheric difference of basal dendritic arborization was found
only at a distance ranging between
⬃40 and 100
m from the
soma (
Fig. 4
B). Even though monkeys Mk-VA and Mk-GE were
subjected to an M1 lesion, their dendritic arborization appeared
largely as dense as in intact monkeys, whereas in monkeys Mk-CE
and Mk-JU, also subjected to a larger M1 lesion, the absolute total
numbers of intersections in both hemispheres appeared more
sparse.
Relationship of IDCDs and AUCs in SMI-32-positive neurons
with lesion volume and functional recovery
The complexity of the basal dendritic arborization was estimated
by integrating the number of dendritic intersections at increasing
distances from the soma (
Fig. 4
), yielding an area under the curve
Figure 3. Box plots of interhemispheric morphological data obtained in the three investigated cortical regions (layer V of F6; layer V of F3; layer III of F3): cell density on both hemispheres in A,C, and E, and IDCD in corresponding regions in B, D, and F. A, C, E, Box plots showing the SMI-32-positive cell densities in layer V of F6 (A), as well as in layer V (C) and layer III (E) of F3 in each
hemisphere for each monkey. In the four intact monkeys, the cell density in the left and right hemispheres is represented in white and gray, respectively. In the nine monkeys subjected to unilateral M1 lesion, the cell density in the ipsilesional and contralesional hemispheres is represented in red and green, respectively. As statistical test, a paired t test or Wilcoxon test was performed (*pⱕ 0.05, **pⱕ 0.01, ***p ⱕ 0.001, ****p ⱕ 0.0001), comparing the density in the two hemispheres in each consecutive histological section. The absence of asterisks means “not statistically significant” ( p⬎ 0.05). B, D, and F, Box plots showing the IDCD of SMI-32-positive cells in layer V of F6 (B), as well as in layer V (D) and layer III (F) of F3 in each monkey. Lesioned animals, on the right, were ordered from left to right according to an increasing M1 lesion volume. The white boxes point to the animals with a non-statistically significant IDCD, whereas the gray boxes show the animals with a significant IDCD. B, All boxes should appear in white as none of the IDCDs are statistically significant (a few boxes are too small to appear white at that scale). A positive IDCD corresponds to an ipsilesional bias in pyramidal SMI-32-positive neurons density, whereas a negative IDCD corresponds to a contralesional bias. In all plots, the ID of each individual monkey is indicated along the abscissa. #, missing data.
(AUC) for each hemisphere. The interhemispheric AUC
differ-ence is reported in
Figure 5
C.
To assess whether the morphological changes reported above
for the SMI-32 labeled neurons in F3 are related to the properties
of the M1 lesion and its consequences, the IDCDs and AUCs were
plotted as a function of M1 lesion volume, percentage and
dura-tion of funcdura-tional recovery (
Fig. 5
A–D). The relationship
be-tween M1 lesion volumes and IDCDs was clearly different in F3
layer III and in F3 layer V. There was no statistically significant
correlation between the median IDCD values in F3 layer III and
the M1 lesion volumes (
Fig. 5
D; r
⫽ ⫺0.561; p ⫽ 0.148; without
taking the outlier Mk-RO into account; changed according to
comments. In contrast, IDCDs in F3 layer V were significantly
inversely correlated with the M1 lesion volumes when Mk-RO
was excluded (
Fig. 5
B; r
⫽ ⫺0.967; p ⬍ 0.0001): the smallest M1
lesions were associated with a largely positive IDCD (i.e.,
ipsile-sionally higher SMI-32-positive neuronal density in F3 layer V);
progressively larger M1 lesions were accompanied by a decrease
of IDCDs, which eventually turned into negative IDCDs for the
largest M1 lesions (i.e., contralesionally higher SMI-32-positive
neuronal density in F3 layer V). In contrast, in F3 layer III, the
same test failed to show any statistically significant difference
among all animals (
Table 2
). As expected, because of the absence
of connections between F6 and M1, there was no correlation
between the M1 lesion volumes and IDCD median values in F6
layer V (r
⫽ ⫺0.526, p ⫽ 0.2252). To distinguish between the two
mentioned factors possibly influencing functional recovery, a
lin-ear model test including partial correlation showed that both
factors have a statistically significant influence on the functional
recovery: p
⫽ 0.0076 for the lesion volume and p ⫽ 0.035 for the
IDCD in F3 layer V.
Mk-RO was not included in these correlation analyses because
its M1 lesion procedure was not performed by ibotenic acid
in-fusion at a single time point (a given day), as in all other monkeys,
but rather repeated at three time points (days) over several weeks,
because the immediate manual dexterity deficit after the first two
infusion time points was small and quickly fully reversible.
Fur-thermore, in Mk-RO, the M1 lesion was performed under
anes-thesia and in presence of anti-epileptic drug phenobarbital
(Luminal, 0.2 mg) in contrast to the other monkeys (except
Mk-SL who also received post-ibotenic acid infusion
phenobar-bital following an epileptic seizure). The anti-epileptic treatment
in Mk-RO had an unexpectedly large neuroprotective effect
against the excitotoxic ibotenic acid in Mk-RO (
Snyder et al.,
2007
). In the other monkeys, the infusion of ibotenic acid was
performed in the awake state. Overall, because of the diverging
experimental protocol conducted in Mk-RO compared with the
other monkeys, the mechanisms of functional recovery, which
took place in Mk-RO may thus differ from those observed in the
other monkeys subjected to a single-step lesion. These objective
experimental differences argue in favor of considering Mk-RO as
an outlier (
Fig. 5
A, B,D–J ), whereas results obtained in Mk-SL
showed no statistically significant IDCD in F3 layer V, despite a
large lesion’s volume.
We assessed then the relationship between the duration of
functional recovery (
Fig. 5
F ), derived from the modified
Brink-man board task (total score), and the IDCD median values in F3
layer V. The IDCD median values in F3 layer V were inversely
correlated with the duration of functional recovery (
Fig. 5
F; r
⫽
⫺0.873; p ⫽ 0.004). This observation is consistent with the fact
that the duration of recovery and the lesion volume are
them-selves dependent variables (
Fig. 5
H; r
⫽ 0.866; p ⫽ 0.005). In
contrast, the median IDCD values in F3 layer III were neither
correlated with the duration of functional recovery ( p
⫽ 0.06,
without Mk-RO), nor with the M1 lesion volumes (
Fig. 5
D).
Although the IDCD median values in F3 layer V were inversely
correlated with both the M1 lesion volume (
Fig. 5
B) and the
duration of functional recovery (
Fig. 5
F ), the IDCD median
val-ues in F3 layer V were not significantly correlated with the
per-centage of functional recovery (defined in
Fig. 1
F ) assessed with
the total score ( p
⫽ 0.73;
Fig. 5
I ), in the modified Brinkman
board task (also excluding Mk-RO here). The animals presenting
a large M1 lesion (such as Mk-CE) recovered to a lesser extent the
precision grip ability than monkeys subjected to a smaller lesion
(
Wyss et al., 2013
). In addition, monkeys with a large M1 lesion
exhibited postlesion a change of manual dexterity strategy to
pal-liate the strong movement deficit of the thumb finger compared
with animals with smaller lesion (such as Mk-VA), which
recov-ered their original opposition of thumb and index finger. In
con-trast, after large M1 lesion (e.g., Mk-CE), the function of the
thumb was less recovered, preventing recovery of the original
opposition of thumb and index finger; instead, the successful
retrieval postlesion was more dependent on the index finger,
op-posing either a largely passive thumb or other parts of the hand
(e.g., palm). Another outcome was that after large M1 lesion, the
monkey was clearly more proficient in the retrieval of pellets
from vertical slots rather than horizontal slots in the modified
Brinkman board task.
In the present model of M1 lesion restricted to the hand area,
there was no correlation between the percentage of functional
recovery in the modified Brinkman board task and the duration
of functional recovery (
Fig. 5
J ). In other words, a longer duration
of functional recovery did not mean a better functional recovery.
Finally, the IDCD median values were not correlated with the
time interval in days (
Table 1
) between the M1 lesion and the day
of euthanasia, in other words the survival time postlesion.
Discussion
Microscopic examination of pyramidal layers in the SMA (F3 and
F6) in macaque monkeys subjected to a unilateral lesion of the
hand representation in M1 showed a significant interhemispheric
asymmetry of SMI-32 staining density in layer V of F3 in 8 of 9
monkeys. In F3 layer III such an interhemispheric asymmetry was
observed in only four monkeys (with a comparable
interhemi-Table 2. P values of the pairwise post hoc analysis comparison of interindividualIDCDs across the M1 lesioned monkeys (p value with Bonferroni correction) using the positive Kruskal–Wallis test
Mk-BI Mk-DG Mk-GE Mk-JU Mk-DI Mk-SL Mk-CE Layer F3-V Mk-VA 1.0000 1.0000 1.0000 0.0071 0.0035 0.0003 0.0045 Mk-BI 1.0000 1.0000 0.6505 0.0864 0.0068 0.0070 Mk-DG 1.0000 0.0839 0.0326 0.0392 0.0606 Mk-GE 0.8389 0.0500 0.0073 0.0030 Mk-JU 1.0000 0.2247 0.0070 Mk-DI 1.0000 0.0326 Mk-SL 1.0000 Layer F3-II Mk-VA 1.0000 1.0000 0.6410 1.0000 1.0000 1.0000 0.8110 Mk-BI 1.0000 1.0000 1.0000 1.0000 0.8390 0.7830 Mk-DG 1.0000 1.0000 1.0000 1.0000 1.0000 Mk-GE 1.0000 1.0000 0.3630 0.0710 Mk-JU 1.0000 0.6980 0.1310 Mk-DI 0.8800 0.0870 Mk-SL 1.0000
The outlier Mk-RO (see text) is not included in this analysis. Statistically significant p values ( pⱕ 0.05) are in bold type.
spheric bias as in layer V). The interhemispheric asymmetries of
SMI-32 staining density were consistent with data derived from
basal dendritic arborization complexity analyses conducted in a
subgroup of four lesioned monkeys. In contrast, asymmetry was
observed neither in F6 layer V in M1 lesioned animals, nor in F3
and F6 in intact animals. Interestingly, the extent and direction of
the interhemispheric asymmetries of SMI-32 labeled cells in F3
layer V, but not in F3 layer III, was correlated with the lesion
volume in M1, and with the duration of the functional recovery
of manual dexterity.
Our four working hypotheses were largely verified by the data
(1) A unilateral lesion of M1 indeed impacted at distance onto
SMA. This effect was different on both the ipsilesional and
con-tralesional hemispheres, with an interhemispheric asymmetry of
density of SMI-32 labeled neurons in F3 layer V (
Figs. 2
,
3
). (2)
The effect of the M1 lesion on SMA on both sides (in F3 layer V)
was correlated with the lesion volume (
Fig. 5
B). (3) Consistent
with the role of SMA in the functional recovery, the impact of
the M1 lesion on both SMAs was correlated with the volume
of the M1 lesion and with the duration of functional recovery. (4)
The impact of the unilateral M1 lesion was different onto F3
(SMA-proper) and F6 (pre-SMA). Indeed, the M1 lesion
im-pacted at distance on F3 but not on F6, in line with their
connec-tional properties with M1 (
Figs. 1
A,
2
,
3
,
5
).
Diaschisis?
The present observation is reminiscent of the concept of
diaschi-sis (
Von Monakow, 1914
), defined as a “loss of function and
electrical activity in an area of the brain because of a lesion in a
remote area that is neuronally connected with it”. The unilateral
lesion of M1 hand area may indeed have affected the function of
Figure 4. A, B, Sholl profiles of basal dendrites of layer V SMI-32-positive neurons in each hemisphere in two intact monkeys (A) and in four M1 lesioned monkeys (B). For each monkey,histological reconstruction of three analyzed cells from each hemisphere are shown as examples (the 3 cells on the left belong to the left hemisphere and the 3 cells on the right belong to the right hemisphere. All lesioned monkeys presented here had a lesion in the left hemisphere). Scale bars, 20m. Intersections were counted at 10 m intervals from the soma center up to a radius of 250 m. The curves represent the mean intersection values ⫾ SD. As statistical test, a two-way ANOVA was performed (*p ⱕ 0.05, **p ⱕ 0.01, ****p ⱕ 0.0001).
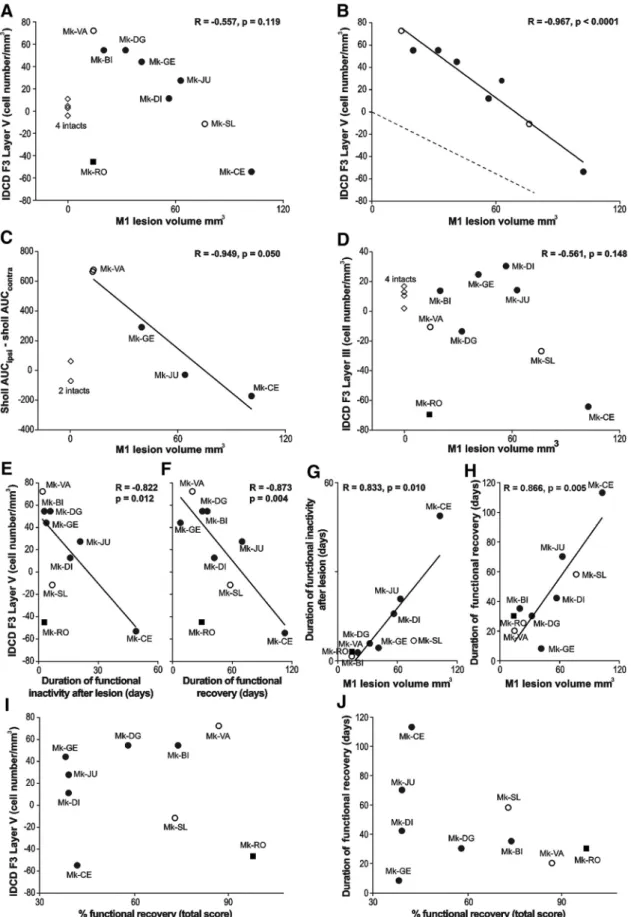
Figure 5. A, B, D, The IDCD in F3 (A, B, layer V; D, layer III) was plotted as a function of the M1 lesion volume. A, Includes all animals, whereas the intact monkeys, as well as the outlier Mk-RO
(square), have been omitted in B (see Results). B, The dashed line represents the hypothesized interhemispheric cell density asymmetry (see Introduction). D, The regression line and the correlation coefficient do not include the intact monkeys and the outlier Mk-RO. C, The correlation between the dendritic Sholl analysis (AUC) and the M1 lesion volume (without the 2 intact monkeys). E–H, Focus on possible behavioral correlates, such as duration in days of functional inactivity after lesion (E, G) and duration of functional recovery (F, H). These two behavioral parameters were correlated with the IDCD in F3 layer V in E and F, as well as with the M1 lesion volume in G and H. I, J, The absence of statistically significant correlation between: the IDCD in F3 layer V and the extent (percentage) of functional recovery (I; r⫽ 0.049; p ⫽ 0.900); The duration of functional recovery and the extent of functional recovery (J; r ⫽ 0.355; p ⫽ 0.349).
neurons in SMA (mainly F3), differently in the ipsilateral and
contralateral hemispheres, resulting in differently modified
phe-notypes (morphological characteristics) between both
hemi-spheres. Such differential interhemispheric change of phenotype
may have modified the affinity of F3 layer V neurons for the
SMI-32 antibody, resulting in the observed interhemispheric
asymmetry of density of the SMI-32-positive neurons.
Von
Monakow (1914)
actually distinguished between an ipsilateral
diaschisis and a commissural diaschisis. The interpretation of a
modification of SMI-32 antibody affinity is consistent with the
observation that the absolute numbers of pyramidal neurons in
layers III and V in the M1 lesioned monkeys bilaterally was in the
same range as in intact monkeys (
Fig. 3
), suggesting an absence of
loss of neurons in F3 as a result of the M1 lesion. The
interpreta-tion of a change of phenotype of F3 layer V neurons, leading to an
interhemispheric asymmetry of SMI-32 antibody affinity, is
sup-ported by the basal dendritic arborization data. The directions of
interhemispheric differences in dendritic arborization
complex-ity (
Fig. 4
) were consistent with the direction of the IDCD.
Correlation between IDCD and M1 lesion, respectively
duration of functional recovery
Shortly after lesion in M1 hand area, the ibotenic acid is expected
to destroy neurons in M1 but preserve the axons in the lesion
territory (
Coffey et al., 1988
). As a result, SMA should be
im-pacted by decreased inputs from M1. Moreover, a possible lesion
signal coming from M1 may be transported retrogradely along
the axons projecting from SMA to M1 because these axons have
been partly deprived of their target in M1. Due to denser
anatom-ical interconnections between M1 and the ipsilateral SMA
com-pared with the contralateral SMA in intact macaque monkeys, the
effects of a unilateral M1 lesion should be different across both
hemispheres, and should depend on the lesion volume in M1. A
purely connectional model would predict that a tiny M1 lesion
has hardly no effect on SMA neuronal density, whereas larger
lesion volumes induce a progressively increasing
interhemi-spheric asymmetry in SMI-32-positive neurons, yielding more
and more negative IDCDs as shown in
Figure 5
B (dashed line,
arbitrary slope), and increased trophic loss of connected neurons
in M1.
The actual data (
Fig. 5
B, solid regression line; r
⫽ ⫺0.967)
show indeed a negative correlation between the IDCD and the
lesion volume, but the regression line is shifted toward positive
IDCDs, meaning that there is a strong asymmetry biased toward
the ipsilesional side, and this bias is the most extreme in case of
small lesions (not considering the outlier Mk-RO). Obviously,
the actual data cannot be only explained by the above-mentioned
purely connectional model. Other parameters may play a role:
first, some diaschisis, corresponding to a functional effect of the
lesion at distant but directly connected areas, may have resulted
in a change of the phenotype of pyramidal neurons in F3. Second,
the histological data refer to the brain state several months after
the lesion, when postlesion plasticity has taken place, allowing
some functional recovery. Postlesion plasticity may have
contrib-uted to modify the phenotype of the neurons in F3, making it
possible for SMA to play a role in the functional recovery (
Mc-Neal et al., 2010
;
Morecraft et al., 2015
), in accordance with the
observation that IDCD is inversely correlated with the duration
of functional recovery (
Fig. 5
F ).
The correlation between IDCD asymmetry and the duration
of functional recovery is also reminiscent of the controversy
re-lated to the respective contributions of the ipsilesional versus
contralesional hemispheres in the functional recovery following a
unilateral lesion of M1 (
Netz et al., 1997
;
Liu and Rouiller, 1999
;
Carey et al., 2002
;
Johansen-Berg et al., 2002
;
Ward et al., 2003
;
Luke et al., 2004
;
Ward and Cohen, 2004
;
Biernaskie et al., 2005
;
Lotze et al., 2006
;
Bradnam et al., 2012
,
2013
;
Young et al., 2014
;
Touvykine et al., 2016
; for review, see
Auriat et al., 2015
;
Dan-cause et al., 2015
). There is evidence that the contralesional
hemi-sphere is playing a more important role in the early phase of
functional recovery (
Rehme et al., 2011
;
Dancause et al., 2015
;
Savidan et al., 2017
).
In macaque monkeys, the crucial role played by the extent of
the lesion and its position in the motor cortex in the functional
recovery has been reported earlier (
Darling et al., 2009
,
2011
;
Kaeser et al., 2010
,
2011
;
Wyss et al., 2013
;
Morecraft et al., 2015
,
2016
). Our results show here that a small M1 cortical lesion was
associated with a higher density of SMI-32-positive neurons in
ipsilesional SMA, increasing then the M1 lesion size resulted in
reducing this interhemispheric asymmetry up to reaching an
in-version of this asymmetry, in favor of the contralesional
hemi-sphere, with a very large M1 lesion (
Fig. 5
B). We also observed a
strong negative correlation (r
⫽ ⫺0.949;
Fig. 5
C) between the
volume of the M1 lesion and the complexity of the basal dendritic
arborization. The extent of the cortical lesion is therefore
consid-ered as a major factor affecting the neuronal density of
SMI-32-positive neurons and their morphology in SMA.
Difference in interhemispheric asymmetry between layer III
and layer V in F3
Cortical lesion targeting M1 hand representation led to
morpho-logical changes occurring mainly in F3 layer V in the form of
interhemispheric asymmetry of neuronal density assessed with
SMI-32 (in 8 of 9 monkeys, the trend being statistically
nonsig-nificant in 1 animal, but still in the same direction as in the other
8 animals), paralleled with less systematic changes in F3 layer III
in the same direction as in F3 layer V (in 4 of 9 monkeys). In
contrast to F3 layer V, the IDCD in F3 layer III was not correlated
to the M1 lesion volume. Both layers are the source and target of
corticocortical projections. In addition, some pyramidal neurons
located in layer V, but not in layer III, do project to the spinal cord
(
Dum and Strick, 1996
;
Rouiller et al., 1996
;
Maier et al., 2002
).
Interestingly, the CS projection from the ipsilesional F3 is
sub-jected to axonal sprouting in the cervical cord after unilateral M1
lesion (
McNeal et al., 2010
;
Morecraft et al., 2015
), possibly
un-derlying the incomplete functional recovery. This anatomical
property may explain the stronger interhemispheric density
asymmetry observed in F3 layer V compared with F3 layer III.
Indeed, we hypothesize that the larger the M1 lesion, the more
M1 CS axon terminals in the cervical cord degenerate, leaving
more space for CS axons originating first from the ipsilesional F3,
layer V, to sprout and extend in the cervical cord after the M1
lesion. This mechanism is expected to be proportional to the
lesion volume, as is the change of phenotype in F3 layer V
pyra-midal neurons.
Conclusion
SMI-32, the marker of pyramidal neurons in layers III and V in
motor cortical areas, does not exhibit a stable level of
immuno-reactivity in SMA across both hemispheres, but rather an
inter-hemispheric asymmetry that is more pronounced in layer V than
layer III, following a unilateral lesion of the M1 hand area. Such
asymmetry may reflect neuronal plastic changes possibly
under-lying functional recovery following such a lesion. As such,
SMI-32 labeling represents a promising tool to tentatively
iden-tify remote intact cortical areas contributing to the functional
10654•J. Neurosci., December 12, 2018•38(50):10644 –10656 Contestabile et al.• Distant Morphological Effects of M1 Lesion on SMA in Macaque Monkeysrecovery from the lesion. As the PMv-r (F5) has been shown to be
also involved in the functional recovery from M1 lesion (
Liu and
Rouiller, 1999
;
Dancause et al., 2005
;
Hoogewoud et al., 2013
),
one may expect to see there a similar interhemispheric imbalance
of SMI-32 labeling, may be also related to the volume of the
lesion, although this may be challenged by the specificity of the
CS projection from F5 to terminate higher in the cervical cord
(C3–C4) than the most relevant segments for hand muscles’
con-trol (C7–T2).
References
Auriat AM, Neva JL, Peters S, Ferris JK, Boyd LA (2015) A review of trans-cranial magnetic stimulation and multimodal neuroimaging to character-ize post-stroke neuroplasticity. Front Neurol 6:226.CrossRef Medline
Bashir S, Kaeser M, Wyss A, Hamadjida A, Liu Y, Bloch J, Brunet JF, Belhaj-Saif A, Rouiller EM (2012) Short-term effects of unilateral lesion of the primary motor cortex (M1) on ipsilesional hand dexterity in adult ma-caque monkeys. Brain Struct Funct 217:63–79.CrossRef Medline
Beaud ML, Schmidlin E, Wannier T, Freund P, Bloch J, Mir A, Schwab ME, Rouiller EM (2008) Anti-nogo-A antibody treatment does not prevent cell body shrinkage in the motor cortex in adult monkeys subjected to unilateral cervical cord lesion. BMC Neurosci 9:5.CrossRef Medline
Beaud ML, Rouiller EM, Bloch J, Mir A, Schwab ME, Wannier T, Schmidlin E (2012) Invasion of lesion territory by regenerating fibers after spinal cord injury in adult macaque monkeys. Neuroscience 227:271–282.CrossRef Medline
Bestmann S, Swayne O, Blankenburg F, Ruff CC, Teo J, Weiskopf N, Driver J, Rothwell JC, Ward NS (2010) The role of contralesional dorsal premo-tor cortex after stroke as studied with concurrent TMS-fMRI. J Neurosci 30:11926 –11937.CrossRef Medline
Biernaskie J, Szymanska A, Windle V, Corbett D (2005) Bi-hemispheric contribution to functional motor recovery of the affected forelimb fol-lowing focal ischemic brain injury in rats. Eur J Neurosci 21:989 –999.
CrossRef Medline
Boudrias MH, Lee SP, Svojanovsky S, Cheney PD (2010) Forelimb muscle representations and output properties of motor areas in the mesial wall of rhesus macaques. Cereb Cortex 20:704 –719.CrossRef Medline
Bradnam LV, Stinear CM, Barber PA, Byblow WD (2012) Contralesional hemisphere control of the proximal paretic upper limb following stroke. Cereb Cortex 22:2662–2671.CrossRef Medline
Bradnam LV, Stinear CM, Byblow WD (2013) Ipsilateral motor pathways after stroke: implications for non-invasive brain stimulation. Front Hum Neurosci 7:184.CrossRef Medline
Carey LM, Abbott DF, Puce A, Jackson GD, Syngeniotis A, Donnan GA (2002) Reemergence of activation with poststroke somatosensory recov-ery: a serial fMRI case study. Neurology 59:749 –752.CrossRef Medline
Coffey PJ, Perry VH, Allen Y, Sinden J, Rawlins JN (1988) Ibotenic acid induced demyelination in the central nervous system: a consequence of a local inflammatory response. Neurosci Lett 84:178 –184.CrossRef Medline
Dancause N, Barbay S, Frost SB, Plautz EJ, Chen D, Zoubina EV, Stowe AM, Nudo RJ (2005) Extensive cortical rewiring after brain injury. J Neurosci 25:10167–10179.CrossRef Medline
Dancause N, Touvykine B, Mansoori BK (2015) Inhibition of the contral-esional hemisphere after stroke: reviewing a few of the building blocks with a focus on animal models. Prog Brain Res 218:361–387.CrossRef Medline
Darling WG, Pizzimenti MA, Rotella DL, Peterson CR, Hynes SM, Ge J, Solon K, McNeal DW, Stilwell-Morecraft KS, Morecraft RJ (2009) Volumetric effects of motor cortex injury on recovery of dexterous movements. Exp Neurol 220:90 –108.CrossRef Medline
Darling WG, Pizzimenti MA, Hynes SM, Rotella DL, Headley G, Ge J, Stilwell-Morecraft KS, McNeal DW, Solon-Cline KM, Morecraft RJ (2011) Volumetric effects of motor cortex injury on recovery of ipsile-sional dexterous movements. Exp Neurol 231:56 –71.CrossRef Medline
Dum RP, Strick PL (1991) The origin of corticospinal projections from the premotor areas in the frontal lobe. J Neurosci 11:667– 689.CrossRef Medline
Dum RP, Strick PL (1996) Spinal cord terminations of the medial wall mo-tor areas in macaque monkeys. J Neurosci 16:6513– 6525.CrossRef Medline
Fregosi M, Rouiller EM (2017) Ipsilateral corticotectal projections from the primary, premotor and supplementary motor cortical areas in adult ma-caque monkeys: a quantitative anterograde tracing study. Eur J Neurosci 46:2406 –2415.CrossRef Medline
Freund P, Wannier T, Schmidlin E, Bloch J, Mir A, Schwab ME, Rouiller EM (2007) Anti-nogo-A antibody treatment enhances sprouting of cortico-spinal axons rostral to a unilateral cervical cortico-spinal cord lesion in adult macaque monkey. J Comp Neurol 502:644 – 659.CrossRef Medline
Freund P, Schmidlin E, Wannier T, Bloch J, Mir A, Schwab ME, Rouiller EM (2009) Anti-nogo-A antibody treatment promotes recovery of manual dexterity after unilateral cervical lesion in adult primates: re-examination and extension of behavioral data. Eur J Neurosci 29:983–996.CrossRef Medline
García-Cabezas MA, Barbas H (2014) Area 4 has layer IV in adult primates. Eur J Neurosci 39:1824 –1834.CrossRef Medline
Hamadjida A, Wyss AF, Mir A, Schwab ME, Belhaj-Saif A, Rouiller EM (2012) Influence of anti-nogo-A antibody treatment on the reorganiza-tion of callosal connectivity of the premotor cortical areas following uni-lateral lesion of primary motor cortex (M1) in adult macaque monkeys. Exp Brain Res 223:321–340.CrossRef Medline
Hoogewoud F, Hamadjida A, Wyss AF, Mir A, Schwab ME, Belhaj-Saif A, Rouiller EM (2013) Comparison of functional recovery of manual dex-terity after unilateral spinal cord lesion or motor cortex lesion in adult macaque monkeys. Front Neurol 4:101.CrossRef Medline
Johansen-Berg H, Rushworth MF, Bogdanovic MD, Kischka U, Wimalaratna S, Matthews PM (2002) The role of ipsilateral premotor cortex in hand movement after stroke. Proc Natl Acad Sci U S A 99:14518 –14523.
CrossRef Medline
Kaeser M, Wyss AF, Bashir S, Hamadjida A, Liu Y, Bloch J, Brunet JF, Belhaj-Saif A, Rouiller EM (2010) Effects of unilateral motor cortex lesion on ipsilesional hand’s reach and grasp performance in monkeys: relationship with recovery in the contralesional hand. J Neurophysiol 103:1630 –1645.
CrossRef Medline
Kaeser M, Brunet JF, Wyss A, Belhaj-Saif A, Liu Y, Hamadjida A, Rouiller EM, Bloch J (2011) Autologous adult cortical cell transplantation enhances functional recovery following unilateral lesion of motor cortex in pri-mates: a pilot study. Neurosurgery 68:1405–1416; discussion 1416 –1417.
CrossRef Medline
Liu J, Morel A, Wannier T, Rouiller EM (2002) Origins of callosal projec-tions to the supplementary motor area (SMA): a direct comparison be-tween pre-SMA and SMA-proper in macaque monkeys. J Comp Neurol 443:71– 85.CrossRef Medline
Liu Y, Rouiller EM (1999) Mechanisms of recovery of dexterity following unilateral lesion of the sensorimotor cortex in adult monkeys. Exp Brain Res 128:149 –159.CrossRef Medline
Lotze M, Markert J, Sauseng P, Hoppe J, Plewnia C, Gerloff C (2006) The role of multiple contralesional motor areas for complex hand movements after internal capsular lesion. J Neurosci 26:6096 – 6102. CrossRef Medline
Luke LM, Allred RP, Jones TA (2004) Unilateral ischemic sensorimotor cor-tical damage induces contralesional synaptogenesis and enhances skilled reaching with the ipsilateral forelimb in adult male rats. Synapse 54:187– 199.CrossRef Medline
Luppino G, Matelli M, Camarda R, Rizzolatti G (1993) Corticocortical con-nections of area F3 (SMA-proper) and area F6 (pre-SMA) in the macaque monkey. J Comp Neurol 338:114 –140.CrossRef Medline
Luppino G, Matelli M, Camarda R, Rizzolatti G (1994) Corticospinal pro-jections from mesial frontal and cingulate areas in the monkey. Neurore-port 5:2545–2548.CrossRef Medline
Maier MA, Armand J, Kirkwood PA, Yang HW, Davis JN, Lemon RN (2002) Differences in the corticospinal projection from primary motor cortex and supplementary motor area to macaque upper limb motoneurons: an anatomical and electrophysiological study. Cereb Cortex 12:281–296.
CrossRef Medline
Matsuzaka Y, Aizawa H, Tanji J (1992) A motor area rostral to the supple-mentary motor area (presupplesupple-mentary motor area) in the monkey: neu-ronal activity during a learned motor task. J Neurophysiol 68:653– 662.
CrossRef Medline
McNeal DW, Darling WG, Ge J, Stilwell-Morecraft KS, Solon KM, Hynes SM, Pizzimenti MA, Rotella DL, Vanadurongvan T, Morecraft RJ (2010) Se-lective long-term reorganization of the corticospinal projection from the