HAL Id: halshs-00143412
https://halshs.archives-ouvertes.fr/halshs-00143412
Submitted on 25 Apr 2007
HAL is a multi-disciplinary open access
archive for the deposit and dissemination of sci-entific research documents, whether they are pub-lished or not. The documents may come from teaching and research institutions in France or
L’archive ouverte pluridisciplinaire HAL, est destinée au dépôt et à la diffusion de documents scientifiques de niveau recherche, publiés ou non, émanant des établissements d’enseignement et de recherche français ou étrangers, des laboratoires
Why do North African firms involve in corruption ?
Clara Delavallade
To cite this version:
Documents de Travail du
Centre d’Economie de la Sorbonne
Why do North African Firms Involve in Corruption ?
Clara DELAVALLADE
Why Do North African Firms Involve in Corruption?
Clara Delavallade
11Centre Economie Sorbonne, Universit´e Paris 1 Panth´eon-Sorbonne - CNRS, 106-112 Boulevard
de l’Hˆopital, 75647 Paris Cedex 13, France. Email: [email protected]. Tel: 00 33 1 44 07 81 90. I would like to thank Jean-Marc Robin, Julie Lochard, the participants in ESNIE 2006 and in
Abstract
This paper empirically analyzes the main microeconomic determinants of differ-ent forms of corruption supply. Our study is based on a new database of near 600 Algerian, Moroccan and Tunisian firms. We show that the undeclared part of firms’ sales is a major factor of their involvement in administrative corrup-tion. The latter increases with the part of the firm’s informal activity as far as it is inferior to 55% of total sales, before slightly decreasing. State capture is rather strengthened by a failing enforcement of property and contract rights. Moreover, both forms of corruption help to compensate a loss of competitiveness, which contradicts previous results on this issue. Finally, we draw a comparison of the factors of corruption in North Africa, Uganda and transition countries, and derive policy recommendations.
R´esum´e
Dans cet article, nous analysons empiriquement les principaux d´eterminants mi-cro´economiques de diff´erentes formes de corruption active. Notre ´etude se fonde sur une nouvelle base de donn´ees de prs de 600 entreprises alg´eriennes, maro-caines et tunisiennes. Nous montrons que l’occultation par les firmes d’une partie de leurs ventes est un facteur majeur de corruption administrative. Cette derni`ere augmente avec le pourcentage de ventes informelles des firmes tant qu’il est inf´erieur 55% des ventes totales, puis diminue. La captation de l’Etat s’explique davantage par une mise en vigueur d´efaillante des droits de propri´et´e et de con-trat. Par ailleurs, ces deux formes de corruption constituent des recours face `a une perte de comp´etitivit´e, ce qui contredit les r´esultats sur ce sujet. Nous menons enfin une comparaison entre les facteurs de corruption en Afrique du Nord, en Ouganda et dans les pays en transition et nous en tirons des recom-mandations de politique ´economique.
Keywords: Supply of Corruption, Administrative Corruption, State Capture, Informal Activity, Competitiveness, North Africa
1
Introduction
The existing literature on the determinants of corruption supply by firms highlights three major factors: informality (Johnson et al. 2000), (Vostroknutova 2003), (Choi and Thum 2002), regulation and property rights (Tanzi 1998), (Hellman, Jones, and Kaufmann 2000), and competition (Bardhan 2006), (Svensson 2003), (Ades and Tella 1999), (Bliss and Tella 1997).
There is no abundant literature on the impact of firms’ informal activity on their practices of corruption. Indeed, studies on corruption and informal activity are mainly macroeconomic ones and they have focused on the analysis of such phenomena in the former Soviet Union (Johnson et al. 2000), (Clarke and Xu 2002), (Vostroknutova 2003). At a macroeconomic level, the more expanded informal activity in an economy, the smaller the tax base. It reinforces corruption through two channels, one through the supply side, one through the demand side: on the one hand, informal activity leads to increase the level of taxes for those who pay some, which encourages firms to pay bribes to reduce the amount of taxes they pay; on the other hand, it decreases the total amount of levied taxes, entailing the quality of public services: public officials are more corrupt and property and contract rights are less protected (Johnson, Kaufmann, and Zoido-Lobaton 1999). To such an extent, high levels of corruption reveal the mismanagement of administration, hence failings in the supply of public services. The level of informal activity has an impact on the level of corruption not only via taxes but also via the legal system: through taxes, informal activity may strengthen corruption, on the contrary, through the rule of law, it may check it. Indeed, Vostroknutova (2003) shows that in countries where corruption is widely spread, informal activity is a way to get round corrupt agents. Therefore, strengthening the rule of law to deter informal activity increases corruption. The author goes further by showing that in highly corrupt countries, fighting against corruption should prevail on fighting against informal activity, hence on reinforcing the implementation of law, and it should reduce informal activity as well in the end.
Most empirical researches on the factors of the supply side of corruption have empha-sized the crucial role of taxation, regulation and property rights in the explanation of firms’ practices of corruption. Many of these studies have emphasized the existence of a monopoly power of the officials in charge of authorizing or inspecting activities subject to regulations or taxation. Especially in developing and transition countries, licenses, permits and authorizations are widespread. Rules and regulations give incumbents all the more important opportunity to use their public discretionary power to extract bribes when i) they are vague and not transparent, ii) they require frequent contacts between citizens and bureaucrats iii) and there is no competition in the granting of these authorizations (Tanzi 1998). In former USSR countries, state capture and ad-ministrative corruption are shown to increase with the lack of respect of their property rights, which reveals the incapacity of courts to implement the law (Hellman, Jones, and Kaufmann 2000), (Johnson, Kaufmann, and Zoido-Lobaton 1998). Indeed, in that case, corruption enables to compensate the fragile situation of firms whose rights are not or badly respected. This is particularly true in a context where the state does not
provide a legal framework favorable to competition. Svensson (2003) also reports that Ugandan firms pay higher bribes when they face higher levels of taxation, and more restrictive regulations, since then the control rights of incumbents are wider.
As for the link between competition, profitability and corruption, it has mainly given rise either to theoretical studies (Bliss and Tella 1997) or to research on transition countries as well (Clarke and Xu 2002), with an exception: Svensson’s paper on Ugan-dan firms (Svensson 2003). Clarke and Xu (2002) highlight how competition affects the demand of bribes in Eastern Europe and Central Asia. But we pay attention here to its supply side. On this topic, Bliss and Di Tella introduce a useful distinction between “cost-reducing corruption” and “surplus-shifting corruption”. The former occurs when a tax inspector reduces costs for a producer who bribes him. The latter refers to pro-tection racket for instance, when bribery enables a firm to keep its surplus-generating business up. They focus on surplus-shifting corruption and show that it may not de-crease with higher competition. When the least competitive firms exit from the market, the profitability of those remaining increases, which enables corrupt incumbents to ex-act higher bribes. Thus, a higher competition may enhance corruption by increasing the competitiveness of firms which stay on the market. Svensson (2003) highlights the same impact of firms’ profitability or competitiveness on their practice of corruption in Uganda. The underlying idea is that the most profitable firms have more resources to pay bribes and involve more in corruption.
Therefore, previous studies on firms’ practices of corruption emphasize three major facts: i) the supply of corruption from a firm is linearly and positively influenced by its involvement in informal activity; ii) restrictive regulation and taxation and insuffi-cient enforcement of property rights are decisive in the supply of corruption in Eastern Europe and Central Asia, where state capture and administrative corruption also de-pend on firms’ characteristics: size, type of ownership, etc.; iii) the level of corruption increases with firms’ profitability and competitiveness.
In comparison with transition countries, shadow activities in developing or emerging countries are considered less worthy of studying and, as a matter of fact, they were less investigated by the scientific community. And yet, the context of firms’ activities and trade has been modified considerably in regions like North Africa over the last few years. Indeed, as well as foreign direct investments, competition has increased with the opening of borders both of the countries in the region and of other countries. Therefore, firms face new types of constraints and they have to adapt their behavior to this changing and more competitive environment, in which regulations and taxes are often perceived as stricter and more restrictive for their activity. Hence, the firms’ perceptions of taxation and regulation, and of the security of their property and con-tract rights, as well as their competitive position and their participation in unofficial economy may have a significant impact on their practices of corruption, which can then help to compensate their weak or threatened position and/or to influence the rules of the game in their favor.
We examine the influence of these factors on the making of corruption decisions in North Africa. More precisely, our contribution is based on an econometric analysis of new data on 600 North African firms in 2005 and it aims at answering the following questions. What are the roots or causes of firms’ practices of corruption in Algeria, Morocco and Tunisia? Are they similar to those which prevail in the countries of former Soviet Union and in Uganda? Apart from the level of taxation, regulation, the legal environment and the firms’ characteristics, is the supply of corruption affected by the informal activity and the competitive position of the firm? Do these factors have dif-ferent effects on state capture and administrative corruption? Our analysis brings new evidence on the supply of corruption of North African firms, which has not been exam-ined before. We highlight that unlike in transition countries, informal activity affects first positively then slightly negatively administrative corruption in Algeria, Morocco and Tunisia. Another of our main results consists in emphasizing the crucial negative influence of the firm’s competitive position on its involvement in both administrative corruption and state capture, which contradicts somehow Svensson’s and Bliss and Di Tella’s results.
The paper is organized as follows: in section 2, we present the analytical framework, explaining the definitions retained for informal activity and the different dimensions of corruption (administrative corruption, state capture...) as well as the database used (in particular through analyses of two-way tables). Then, econometric model and method are expounded (section 3). In section 4, we report and comment the results obtained through ordered probit estimations and compare them with main findings on transition countries and Uganda. Section 5 is composed of robustness tests. Section 6 concludes.
2
Framework and Data
2.1
Analysis Framework
Corruption is relatively widespread in North African countries, hampering economic activity by inducing additional uncertainties and costs for firms as well as arbitrary decisions. Tunisia, Morocco and Algeria respectively range 43rd, 78th and 97th out of
159 countries according to Transparency International Corruption Perceptions Index in 2005.
Let us precise the definitions of informal activity and corruption we use.
Sosic and Faulend (1999) distinguish three forms of informal activity. The first one, “unreported economy”, accounts for activities evading taxes and regulations the gov-ernment settles (Loayza 1996). The second one, “unrecorded economy”, refers to eco-nomic activities that are not included in the national accounts. Finally, the third type of informal activity gathers all activities that are excluded from the “system of owner-ship rights guaranteed by the state and the system of regulations and obligations which give the economic process and economic activities a legally acceptable and politically
legitimate form”. The latter definition is the most complete one and the most often used when studying developing countries. But the drawback is that it is very difficult to measure. This is the reason why we retain here the second definition of informal activity. It establishes a precise yardstick by which one can distinguish between formal and informal activity: the notification or not of the firms’ sales to the authorities. As for corruption supply, that is to say bribes given by firms to public officials, we distinguish between administrative corruption and state capture. The former refers to bribes given in order to influence the application of laws and regulations affecting firms’ business. On the other hand, state capture accounts for bribes aiming at influ-encing the content or formulation of such laws and regulations (Hellman, Jones, and Kaufmann 2000).
This paper seeks to emphasize the factors of corruption practices of Algerian, Moroccan and Tunisian firms. Related recent literature on the links between informal activity, corruption supply, legal and regulations context, competition and firms’ characteristics can be schematized as follows in Figure 2.1.
Figure 1: Main determinants of corruption supply
Regulation Taxes
Informal Employment Informal Activity
(A) (B) (C) Corruption (D) (F) (E)
Competition Firms’ Characteristics Property Rights
We focus here on relations (A), (B), (C), (D), (E) and (F) - that is to say on the de-terminants of corruption.As for relation (C), some empirical studies on former USSR countries suggest that the overall level of corruption in a country is correlated with unofficial economy. When analyzing the impact of informal activity on corruption, our analysis may suffer from endogeneity due to the fact that corruption may also affect informal activity. Indeed, ordinary least squares regressions run on aggregated data (Johnson, Kaufmann, and Zoido-Lobaton 1999), (Johnson et al. 2000) or on firm-level data (Johnson et al. 2000), (Johnson and Kaufmann 2001), (Friedman et al. 1999) show that, in former USSR countries, the level of corruption has a significantly positive im-pact on the level of unofficial economy. However, these analyses are macroeconomic
ones and corruption is used as a proxy for institutional failures, which may influence more unofficial economy than corruption itself. Our study focuses on microeconomic behaviors, for which the impact of corruption on informal activity is not clear cut. Moreover, the data we use here to measure informal activity (the percentage of sales not declared to the authorities) are not likely to be affected by corruption. Endogene-ity is based on the argument that firms hide a higher part of their sales to pay bribes less often. This happens if the frequency with which public officials ask for bribes is highly sensitive - or elastic - to the level of sales declared. Svensson (2003) and Bliss and Tella (1997) show that the level of bribes paid by a firm depends on its ability to pay, proxied by the firm’s profitability. This suggests that firms might be tempted not to declare part of their sales in order to send a false signal to corrupt officials on their profitability. However, if a firm’s sales affect the level of bribes it is asked to pay, there is no reason for it to affect the frequency of bribes paid. Indeed, the frequency of bribe-asking is not likely to depend on a firm’s profits.
2.2
Descriptive Analysis
To measure these phenomena, we use an original data base computed by ROSES (Uni-versit´e Paris 1 / CNRS), with the participation of FEMISE. This database is based on a survey carried out in 2004-2005 in Algeria, Tunisia and Morocco upon 600 formal firms, i.e. declared to the trade register. It includes, among others, a set of questions on the share of informal activity and employment in firms and questions on their perceptions of corruption, regulation, taxes, competitiveness, and respect of their property rights, etc. The questions used to define the variables under study are reproduced in table 10 in Appendix. This table also provides the main descriptive statistics concerning these variables. The questions concerning corruption and informal activity are definitely less filled in than the other questions. As for administrative corruption and state capture, the median is below the mean. This is due to the fact that a lot of firms that answer the question minimize the phenomenon: when a question is found to be embarrassing, the respondent can choose not to answer or to answer “no” to “protect itself”. However, we have enough answers and their standard errors are sufficiently high to perform a statistical and econometric analysis of hidden activities (corruption and informal activ-ity). The survey we use has a few limitations. First, it is mainly an opinion survey, at least for the questions we use on corruption, competition, security of property rights... The questions deal with managers’ perceptions on the institutional environment of the firm. Second, some questions, supposed to reveal real practices, rather deal with firms around the question “Do firms like yours?”. The purpose of this formulation is to bypass self-censorship, from which all surveys on illicit or socially condemned practices suffer, like drugs, criminality, alcoholism, corruption... The idea is first that one feels more free to answer if one is not directly concerned by the question, second that one’s answer is largely guided by one’s own practices. In recent years, such hypotheses have been questioned and, to broach these issues, researchers prefer using practices surveys
and direct questions. Indeed, it is not so obvious that questions on perceptions rather than on practices enable to reduce self-censorship; on the contrary one may rather censor what one thinks than what one does. Moreover, the information one can get by using formulations like “Firms like yours” or “Firms in your sector” might rather reflect collective representations, not necessarily true to real practices neither of firms in the sector or in the area nor of the polled one. One may also collect strategic rather than real answers, in particular to questions on taxes, regulations or public ser-vices, from firms overrating the former or undermining the latter to influence policy choices. However, such a wording, similar to the one of BEEPS surveys on transition countries (Hellman, Jones, and Kaufmann 2000) and of the 1998 Ugandan enterprise survey (Reinikka and Svensson 2003), enables first to avoid implicating the respondent of wrongdoing, second to draw comparisons between the microeconomic determinants of corruption in North-Africa, former-USSR and Uganda. Finally, this survey has the advantage of providing a unique microeconomic database on institutions and different forms of corruption in three Maghrebi countries.
Two-way tabulations run on the variables of corruption give the following results1.
Table 1: Mean of corruption variables for each modality of informal activity
Modalities of Corruption to
the Informal Administrative State Corruption to accelerate Activity Corruption Capture start business administrative
variable procedures 0 1.88 1.66 1.82 2.60 10.5 2.58 2.00 2.03 2.30 35.5 3.15 2.09 2.25 2.49 63 3.23 1.60 2.58 2.67 87.5 3.00 3.00 2.17 2.67
Notes: The informal activity variable reports the percentage of undeclared sales of a firm. The first two corruption variables vary between 1 and 6, the last two between 1 and 4, where 1 is reported by firms which never have to give unofficial payments.
The analysis of this statistical table shows that the relation between corruption and informal activity depends on the type of corruption (at the administrative level or at the legal one) and on its aim.
More precisely, the mean of administrative corruption tends to rise before slightly de-creasing with the firms’ informal activity, as well as the mean of corruption to start business. The relation of these two variables of corruption with informal activity is an inverted U-shape. The trend of the state capture variable is more fluctuating and the
1Distributional plots of administrative corruption and state capture are given in appendix in figure
relation between state capture and informal activity is ∼-shape. As for corruption’s accelerating administrative procedures, it first decreases with the percentage of unde-clared sales before increasing, drawing a U-shape relation.
One-way tabulations of some questions can help to clarify the nature of the relationship between corruption and informal activity, and the other factors influencing corruption and informal activity. Notice that the value of the means cannot be interpreted since these variables are ordinal and not cardinal, hence the means of a variable only have sense when compared with its other values, as a ranking.
First, paying attention to the evolution of the mean of administrative corruption sug-gests that there is a quadratic relation between the part of undeclared sales of a firm and its supply of administrative corruption.
Furthermore, studying the main reasons of firms’ practices of corruption shows that corruption seems on the one hand to enable firms to circumvent regulations considered too restrictive, on the other hand not to declare a share of their sales and employees. Indeed, nearly 50% of these firms declare that they pay always or often additional payments to accelerate administrative procedures (38.83% of Algerian firms, 30.43% of Tunisian firms, and more than 70% of Moroccan firms), about 30% to start their activity, about one third to maintain a part of their activity undeclared (almost 60% of Moroccan firms, 25.84% of Algerian firms compared to 10.68% of Tunisian firms) and more than one third not to declare some of their workers.
Moreover, firms choose not to declare a part of their activity, first of all, to pay less taxes (taxes barrier), then to reduce labor cost, and finally to avoid complicated ad-ministrative procedures (restricting regulations).
This study, based on a descriptive analysis, has allowed us to underscore relations between informal activity and corruption, and between administrative corruption and state capture on the one hand and regulations and taxes on the other hand. However, this first statistical analysis does not make it possible to set up either strong correlations or causality links. It is therefore necessary to have recourse to econometrics.
3
Econometric Model, Method and Expectations
In this section, we seek to emphasize the main factors of firms’ perceptions of cor-ruption2. For that purpose, we use the data presented above to estimate the following
model which regresses two different dimensions of corruption mentioned above (through two sub-models) on several factors, and in particular on the undeclared part of the
firm’s sales. Hence, we estimate the following model:
Corrupi = β0 + β1Inf ormali+ β2Inf ormal2i + β3P ropRightsi+ β4Competi
+ β5Reguli+ β6T axi+ β7Controli+ θi (1)
where Corrupi stands either for state capture (Capturei) or for administrative
cor-ruption (Admcorri). P ropi is a dummy variable referring to firm i’s perception of the
respect of its property and contract rights three years before. Competi is a dummy
which indicates the firm’s competitiveness, proxied by the increase of the firm’s market share over the last year. Reguli stands for regulations affecting the firms, it is equal
to 1 if the firm fully respects fiscal regulations. T axi gives the amount of corporate
taxes as a percentage of the firm’s sales. Controli designates different control variables
according to the sub-model which measure firm’s characteristics: its capital (Capitali),
the financial stake of the state in the firm (P ubCapitali), a dummy equal to one if the
firm has ever been state-owned in the past (F ormP ublici), the number of its
employ-ees (Nbempi), the respondent’s status in the firm (CEOi) the firm’s country of origin
(T unisiai, Moroccoi, Algeriai), her line of business (InsurF ini, Hoteli, T ransporti,
T radei, BuildIndi, F oodIndi, ChemicIndi, T extilIndi, ElecIndi).
We expect highly informal firms to offer more bribes to maintain part of their activity in the shadow sector. But, as mentioned in section 2, table 2.2 suggests that the relation between administrative corruption and informal activity is an inverted U-shape: first increasing then slightly decreasing. Hence, we make the hypothesis that, for low shares of informal activity, increasing this share leads firms to pay bribes more frequently to “buy” controls and inspections. But for firms with a higher share of unofficial activity increasing it enable them to avoid controls and make corruption less attractive3. To
take this into account, we introduce a quadratic term, whose coefficient is expected to be negative. Bribes can also enable firms to circumvent restrictive taxation and regulation. Informal activity, regulation and taxation make it necessary to control for their existence (for the former) or implementation (for the latter two). Svensson (2003) refers to these as “control rights” which enable public agents (mainly inspectors) to enter into transactions, hence into negotiations with firms. Moreover, firms may “buy”, through bribes given to justice or police officers or inspectors, the protection of their property and contract rights when the legal system cannot afford it. Then, one of our main hypotheses is that weakly competitive firms should be more tempted by having recourse to bribery to distort the rules of competition. On the contrary, a monopolistic firm, with a high market share does not need to bribe officials to get public procurement on its line of business since it has no competitors. More precisely, to measure a firm’s competitiveness, we use a dummy equal to one if its market share has remained stable or increased during the last two years. It has two main advantages: i) it relies on real facts rather than on assumptions such as the index of demand elasticity used by Hellman, Jones, and Kaufmann (2000); ii) relying on past events, it might suffer
3Choi and Thum (2002) show that unofficial activity gives firms the opportunity to flee from corrupt
from simultaneity with the indices of corruption less than a measure based on future expectations.
We expect that firms in which the state has a financial stake benefit from privileged links with public officials. Such links may enable firms to influence the content and application of laws and regulations without having to buy such an influence, that is to say without having to involve in state capture (Hellman, Jones, and Kaufmann 2000). They may practice less and less often corruption. Hellman et alii’s analysis on former USSR firms also suggests that small firms (with less than 50 employees) tend to involve in administrative corruption rather than in state capture, probably because the former is less costly. Hence, we expect the size of the firm, as well as its capital, to affect positively state capture and negatively administrative corruption. Moreover, it seems necessary to control for respondents’ characteristics: it is likely that those who have a position with high responsibilities are more reluctant to be totally transparent on their firm’s practices of corruption. Corruption supply may differ between sectors. Industrial sectors, in which projects involve huge amounts of money or highly rent-generating public procurement, may be more favorable to corruption, in particular to state capture. Finally, firms located in Tunisia may suffer from political pressure more than in Algeria and Morocco and report corruption less easily.
The results we expect from the econometric estimation of the models and presented above are typified in the following table.
Table 2: Expected Signs of the Factors of Corruption
Explanatory Variables State Capture Administrative Corruption
Informal Activity (+) (∩)
Competitiveness (-) (-)
Respect of Property Rights (-) (-)
Regulation (+) (+)
Taxes (+) (+)
Part of the State in the Capital (-) (-)
Capital (+) (-)
CEO (-) (-)
Number of Employees (+) (-)
Tunisia (-) (-)
Industrial sectors (+) (+)
We use ordered probit models to estimate theses different effects. Indeed, the dependent variables - administrative corruption and state capture - are indexed between 1 and 6, hence discrete and ordered. A firm’s involvements in administrative corruption and in state capture are respectively measured by the following questions: “Do firms like yours usually have to give public officials unofficial payments to be able to work?” and “Do firms like yours have to give public officials unofficial payments to influence the content of a law or regulation?” The answer might be 1: never; 2: seldom; 3: sometimes; 4: often; 5: mostly; or 6: always. A multinomial probit model would then neglect the ordinality of the explained variable whereas on the contrary a linear regression would
consider the gap between indices 3 and 4 similar as the one between indices 1 and 2, whereas these only refer to a ranking position. In these two cases, we would not obtain consistent estimators.
Therefore, the models generally used when dealing with that kind of variables are ordered probit and logit models. They are based on an estimation of a continuous latent variable, underlying the ranked variable under study. In an ordered probit model, the residual associated with this latent variable is supposed to have a standard normal distribution.
The large number of missing values in corruption data (36% for administrative corrup-tion and 41% for state capture) suggests that there might be a seleccorrup-tion bias. Indeed, if non-response is not random and not independent from the variables of corruption, inference might be biased. In order to control for such a bias, we use a two-step pro-cedure. First, we estimate a probit model where non-response is explained by a set of variables significant at the 10% level. Then, the estimated residual is added to the set of explanatory variable in the equation of interest, with either state capture or admin-istrative corruption as a dependent variable. However, in either case, the selection bias is not significant. Thus, we use classical ordered probit estimations.
The following econometric analysis allows us to test our hypotheses concerning the factors of firms’ practices of corruption.
4
Results
In the following section, we report the results of estimations of the impact of several explanatory factors, among which informal activity, competitiveness and enforcement of property rights on two different dimensions of corruption: state capture, administrative corruption. We first highlight the most relevant factors of these two forms of corruption supply in North Africa. Then we compare firms’ behaviors towards corruption in North Africa, in Uganda and in transition countries.
4.1
Main Factors of State Capture and Administrative
Cor-ruption in North Africa
The procedure for running regressions has been the following: 1) we have selected 14/23 VARIABLES of interest and control which could explain corruption according to our analysis framework; 2) all of them are used as regressors; 3) step-by-step, the least significant one is dropped out until all the remaining regressors are significant at the 10% level; 4) then, we add sector dummies and drop the variables which are not significant first at 15%, then at 10%. In the core of the paper, we only present the initial (unrestricted) and final specifications (see table 3). The full procedure leading from the initial specification of the models of state capture (1.1) and administrative
Table 3: Ordered Probit Estimations: Initial and Final Models
Model 1.1 1.13 2.1 2.12
Explanatory State Administrative Variables Capture Corruption
Inf ormal.10−1 0.35 0.47b 0.38a (0.23) (0.18) (0.09) Inf ormal2.10−3 -0.44 -0.39 -0.33b Main (0.35) (0.26) (0.13) Compet -0.78a -0.69a -0.46c -0.53a (0.23) (0.18) (0.26) (0.19) P ropRights -0.41 -0.36b -0.16 (0.28) (0.18) (0.26) Recourse 0.23 0.31 Links (0.45) (0.41)
with the T ax.10−2 0.44 0.54
State (0.90) (0.76) Regul 0.11 -0.03 (1.15) (0.48) Capital.10−9 -0.75b -0.30b -0.07 -0.07a (0.35) (0.14) (0.05) (0.02) CEO 0.32 0.44b 0.22 (0.25) (0.17) (0.27) Firms’ N bemp.10−2 -0.08 -0.19b -0.16a Characteristics (0.07) (0.08) (0.06) Y ear.10−1 -0.03 0.13 (0.09) (0.09) P ubCap.10−1 0.19c 0.12b (0.10) (0.05) F orCap.10−2 0.12 -0.15 (0.48) (0.42) T unisia 0.36 -0.34c 0.02 Country (0.67) (0.20) (0.35) M orocco 0.67 0.13 (0.64) (0.36) InsurF in.101 -0.76a -0.80a (0.02) (0.02) Hotel.101 -0.10b Sector (0.04) T ransport -0.91c (0.52) BuildInd 0.59b (0.26) Observations 110 217 116 213 Log-Likelihood -112.4 -239.2 -133.6 -277.5 Notes: Standard errors in parentheses: a denotes significance at the 1% level,b at the
5% level andc at 10%. Residuals heteroscedasticity is corrected with White’s
method.
corruption (2.1) to their final ones (respectively 1.13 and 2.12) is presented in appendix in tables 11 and 12.
The coefficients obtained for β are not equal to the marginal effects of the explanatory variables on the conditional probabilities. Hence, first from table 3) we will only in-terpret the sign of the coefficients and not their value; second the figures provided in tables 4.1 and 4.1 give the marginal effects ∂y/∂xk of explanatory variables included
respectively in model 1.13 and 2.124. For dummy variables, ∂y/∂x
k is for discrete
change of the variable from 0 to 1.
Table 4: Marginal Effects for State Capture
Frequency of State Capture
Never Seldom Sometimes Often Mostly Always
Compet∗ 15.74 -8.49 -4.26 -1.44 -1.17 -0.38 P ropRights∗ 7.18 -4.17 -1.87 -0.58 -0.44 -0.13 Capital.10−9 5.53 -3.31 -1.41 -0.42 -0.31 -0.08 CEO∗ -9.04 5.17 2.38 0.75 0.58 0.17 T unisia∗ 5.81 -3.56 -1.45 -0.42 -0.30 -0.08 InsurF in∗ 16.49 -10.67 -3.83 -1.06 -0.74 -0.19 Observations 217 217 217 217 217 217 Notes: Marginal effects are given at the mean point of continuous explanatory
variables, and for discrete change from 0 to 1 of dummy variables (noted ∗). The figures are reported in percentage points.
The frequency of state capture is not significantly affected by variations of the size of informal activity of the firm5. For equal levels of capital, the positive impact of
informal activity on state capture is not significant: state capture does not clearly emerge neither as a complement nor as a substitute for informal activity.
On the other hand, the firm’s competitiveness has a significant and negative impact on its involvement in state capture. It seems that firms with a stable or increasing market share have to give bribes less often than those suffering from higher competition. Competitiveness appears to be one of the most relevant factors of state capture by North African firms, but the effect we bring to the fore is opposite to the one highlighted in both theoretical and empirical studies on this issue (see Svensson (2003) and Bliss and Tella (1997)): here, the probability of paying bribes is significantly higher for less competitive firms whatever the frequency, even if the difference in probability decreases with the frequency of bribes. Besides, table 4.1 should be read as follows: a decrease in the market share of a firm over the last three years entails a 1.17% increase of the probability to consider that firms in the same line of business often have to bribe public officials to influence the formulation of laws. Indeed, a firm’s loss of competitiveness
4However, these figures must be taken cautiously since estimators are consistent only under the
assumption that the error terms have a normal distribution.
5However, the coefficient associated with the portion of informal activity is significantly positive
when not controlling for the stock of capital of the firm: the higher the proportion of a firm’s sales that are not declared, the more likely it is to give bribes to influence the content of new laws affecting them, probably laws aiming for instance at punishing hidden activities.
on its market may prompt it to turn to bribery in order to influence to its advantage the content of laws and regulations affecting it to try to win back part of its market share or else to get public procurements.
State capture significantly decreases with the enforcement of property and contract
rights. These results converge with those of Hellman, Jones, and Kaufmann (2000) on
former USSR countries. Firms whose property and contract rights are not or badly respected may bribe influential incumbents whether to correct the injustice or to settle compensatory mechanisms for their relative drawback. Hence, state-level corruption may be a way to reduce additional transaction costs due to a failing enforcement of law. Changing from low to high enforcement of property rights decreases of 7.18% the probability to never have to give unofficial payments to influence the content of laws. Then the higher the amount of the firm’s capital, the lesser likely her involvement in state capture. This casts doubt upon the argument that the firms which involve more in corruption in general and in state capture in particular are those with the highest resources. On the contrary, small firms, in financial terms, being more vulnerable to current crises and competition, turn more frequently to state capture to protect themselves or carve out a place.
The sign of the coefficient associated with the respondent’s professional status gives interesting information. Hence, the position has a significant impact on the perception of corruption: surprisingly, the higher responsibility has the respondent, the more likely he is to declare that the firm often gives unofficial payments to modify the content of laws and regulations, that it to say that the firm is involved in state capture. The first interpretation of these results may be given by the secret nature of corruption: if chief executive officers are more aware of their firm’s practice of state capture than directors of human resources, it could be because the latter have little access to such information or activities which rather directly involve CEOs. A second interpretation might be that even if they know such practices employees are less ready to reveal them because of their fear to be “punished” by their superiors, if not fired.
We also introduce dummies controlling for specific effects of the country or of the sector of the main activity. We notice only two significant coefficients. Being settled in Tunisia reduces the propensity of firms to seek to influence the formulation of laws through bribes. This may have two interpretations: i) state capture is more widespread in Algeria and Morocco than in Tunisia; ii) Tunisian firms being more subject to political pressure than Algerian and Moroccan ones report and expose less easily corruption practices. The latter explanation seems more probable given the authoritarian Tunisian political context. Finally, the only line of business with significantly lower levels of state capture is the one of insurance and finance. This might be due to lower rent-generating public procurement in service sectors and in this one in particular than in industry sectors, together with more transparent interactions with incumbents.
In brief, our results show that North African firms are prompter to involve in state capture mostly when their market share decreases, when their property and contract rights are badly enforced, and when they have a small capital, all in all when their
activity is more threatened by competition.
As expected, administrative corruption is linked to informal activity through a quadratic relation (first increasing then slightly decreasing). Hence, the global marginal effect of informal activity on administrative corruption, GInformal, needs to be re-calculated from the figures obtained for the marginal effects of Inf ormal.10−1 and
Inf ormal2.10−3.
Table 5: Marginal Effects for Administrative Corruption
Frequency of Administrative Corruption
Never Seldom Sometimes Often Mostly Always
Inf ormal.10−1 -14.78 2.69 5.37 2.72 3.30 0.71 Inf ormal2.10−3 12.67 -2.31 -4.60 -2.33 -2.83 -0.60 GInformal -1.18 0.21 0.43 0.22 0.26 0.06 Compet∗ 20.76 -2.74 -7.04 -4.04 -5.51 -1.42 Capital.10−10 2.79 -0.51 -1.01 -0.51 -0.62 -0.13 N bemp.10−2 6.06 -1.10 -2.20 -1.11 -1.35 -0.29 InsurF in∗ 47.97 -16.17 -17.55 -6.53 -6.56 -1.17 Hotel∗ 30.70 -9.27 -11.67 -4.53 -4.49 -0.74 T ransport∗ 28.06 -8.43 -10.70 -4.16 -4.10 -0.67 BuildInd∗ -23.31 1.83 7.22 4.77 7.28 2.20
Notes: Marginal effects are given at the mean point of continuous explanatory variables, and for discrete change from 0 to 1 of dummy variables (noted ∗). The figures are reported in percentage points. GInformal
stands for the global marginal effect of the variable of Informal Activity. It is given by the following combination: GInformal = ∂y
∂x1 + 2x1
∂y ∂x2
according to the notations of equation 1.
The signs of the coefficient associated with the single term and the quadratic term of informal activity indicates that administrative corruption first increases up to a certain threshold before slightly declining. Figure 2 suggests that the threshold is at about 55% of undeclared sales. Before this threshold, giving unofficial payments might therefore be a way to maintain part of the sales hidden, in order to avoid paying some taxes for instance6. Hence, the dimension of corruption that is emphasized is a
“surplus-shifting corruption” (Bliss and Tella 1997) which enables to carry on a business that would probably disappear without bribes. After the threshold of 55%, the higher the percentage of sales undeclared, the lesser the probability that firms give bribes to public officials. Two different mechanisms may be at stake: whether hidden activity alleviates so much the tax burden that corruption aiming at influencing the application of laws and regulations affecting the firm becomes less useful or the probability of being caught (increasing with the portion of informal activity) is so high that the firm seeks to reduce the additional risk due to corruption. The global marginal effect reported in table 4.1
6Indeed, as mentioned in section 2, for one third of the firms polled, bribes are linked with the
indicates that a one percent increase of undeclared sales reduces by 1.18 percentage points the probability to never have to give bribes to influence the application of regulations affecting the firm’s business and it increases by 0.26 points the probability to have to give some most of the time.
Figure 2: Regression Fit of Administrative Corruption on Informal Activity 1.5 2 2.5 3 3.5 4 Administrative Corruption 0 20 40 60 80
Share of Informal Activity 95% CI Fitted values
Like on state capture, the firm’s competitiveness, proxied by the variation of its mar-ket share, has a negative impact on administrative corruption: if the marmar-ket share of firms increases or is stable, i.e. if it is competitive, the probability that it practices administrative corruption is significantly lower than for less competitive firms. Cor-ruption hampers less the long-term expansion strategy of the former since they enjoy a strong position on their market. On the contrary, less competitive firms might be more tempted to have recourse to unofficial payments to compensate their weak competitive position. This rather highlights the “cost-reducing” dimension of corruption. Contrary to what Svensson (2003) shows for Ugandan firms and to what Bliss and Tella (1997) explain in their theoretical model, our study suggests that North African firms which involve more often in corruption are not the most profitable ones but the least com-petitive ones. Table 4.1 can be read as follows: changing from a lowering to a stable or increasing market share decreases of 5.48 percentage points the probability that the firm practices administrative corruption most of the time; on the contrary, it increases of 20.76 points the probability to never practice it.
Concerning firms’ characteristics, the higher the capital of the firm, and the number
of its employees, the weaker the probability that the firm reports administrative
cor-ruption. Similarly to what has been observed in Eastern Europe and Central Asia, administrative corruption mostly concerns small firms, in financial terms and in terms of workforce.
capture: firms whose main activity is in a service sector except trade (insurance and financial services, hotel and restaurant, transport) are less likely to involve in adminis-trative corruption than others. On the contrary, those which have their main activity in building are significantly more inclined to petty corruption. Indeed, inspections are more frequent in this line of business in particular and in industries than in services in general, which increases incumbents’ control rights, hence bribing opportunities. All in all, firms’ involvement in administrative corruption is mainly determined by the proportion of their informal activity: administrative corruption increases with the percentage of hidden sales until this percentage reaches about 55%, then administrative corruption decreases with the rise in informal activity. It is enhanced by the weakness of their competitiveness but it does not seem to be sensitive to the security of property rights, contrary to state capture.
4.2
Comparison with Corruption Supply in Uganda and
tran-sition countries
In this subsection, we seek to compare firms’ behaviors towards corruption in the Maghreb, in transition countries and in Uganda.
In their influential paper, Hellman, Jones, and Kaufmann (2000) lead econometric analyses on the determinants of state capture and administrative corruption in 22 transition countries7. They show that state capture is more often practiced by large
firms (i.e. with a high number of employees), whereas administrative corruption seems to be rather specific to small firms. Firms which suffer from a bad enforcement of their property and contract rights, those which cannot have recourse to other bureaucrats when the first one asks for bribes are more likely, as well as de novo firms, to involve in both forms of corruption. Indeed, partly public firms in these countries were shown to have privileged links with the state which allowed them to influence regulation without having recourse to bribery. Hence, they were less likely to involve in corruption than de
novo ones. Finally, neither state capture nor administrative corruption is significantly
affected by market power (proxied by the inelasticity of the demand faced by firms). Svensson’s study on Ugandan firms does not make any distinction between state cap-ture and administrative corruption but it has the advantage of being based on quanti-tative data on the amount of bribes paid. Corruption is higher for firms with a higher ability to pay (measured by their profitability) and for firms with a lower refusal power, which depends on the alternative return on the firms capital stock. The extent of con-trol rights of incumbents, as high as regulations, taxes and public services concerning the firm, enhance the level of bribes paid as well.
In the preceding section, we only comment on the effects of variables relevant for the explanation of the supply of corruption in North Africa. Now, we also mention factors
which happened to be relevant for the analysis of the determinants of corruption in former USSR (see Hellman, Jones, and Kaufmann (2000)) and in Uganda (see Svensson (2003)) and introduced in initial models (1.1) and (2.1). For detailed results on the restriction procedure, see tables 11 and 12 in appendix.
First, the most striking difference concerns the impact of competitiveness: our results show that in North Africa, the firms the most involved in corruption are the least com-petitive ones, and not the most profitable ones as in Uganda8. This suggests that here,
competitiveness rather captures the “cost-reducing” dimension of corruption, since firms involve in it to compensate a waning position, whereas, in Uganda, profitability rather captures the “surplus-shifting” dimension of corruption, which increases with firms profits.
Besides, North African firms are more likely to involve in state capture when their
prop-erty and contract rights are not or badly enforced, the impact on petty corruption not
being significant, whereas a failing legal system strengthens both forms of corruption in transition countries.
Contrary to the situation in transition countries, differences in the links North African firms may have with the State do not significantly explain differences in their involve-ment in both forms of corruption. If corruption in former USSR countries is sensitive to the origin of the firm (de novo, privatized or public) and to the financial stake of
the state, it is not the case in Tunisia, Algeria and Morocco. Then, levels of taxes
and perceptions on regulations do not affect corruption supply of North African firms, unlike Ugandan firms, probably because the “burden” effect of regulation is captured by informal activity which might be the answer to restrictive taxes and regulations (Johnson, Kaufmann, and Zoido-Lobaton 1998). Another interesting comparison with corruption practices in other regions lies in the role of bureaucratic recourse or refusal power. In Uganda, firms with a higher refusal power pay less bribes. Similarly, in transition countries, firms which can have recourse to another official in case of bribe-appeal, hence which have a higher refusal power, pay bribes less often. In North African countries, such a dimension does not significantly affect corruption practices. Like in former USSR, small firms are more likely to involve in administrative corruption in North Africa. However, they are also more likely to practice state capture in North Africa whereas they are fewer to practice this kind of corruption in former USSR. With regard to Uganda, the size of the firm is not decisive. Finally, the existence of
sector-specific effects is restricted to the North African situation. In Svensson (2003),
industrial category dummies are not significant for Uganda. As for transition countries, sectorial dummies are not introduced in the analysis of the determinants of corruption.
8We use the variation of the market share of the firm as a proxy for its profitability and
compet-itiveness. This makes a difference with examining the market share as a stock. The latter is not a good proxy for competitiveness or profitability since a state monopoly might not be competitive or profitable. It might be one of the reasons why when Svensson (2003) introduces this stock index, it does not appear to explain significantly the level of bribes.
5
Robustness Tests
In the following section, we seek to ascertain the robustness of our results on the main determinants of state capture and administrative corruption. We focus on two potential sources of instability: the ranking of answers to the frequency of corruption, the existence of a selection bias.
5.1
Nature of the dependent variable
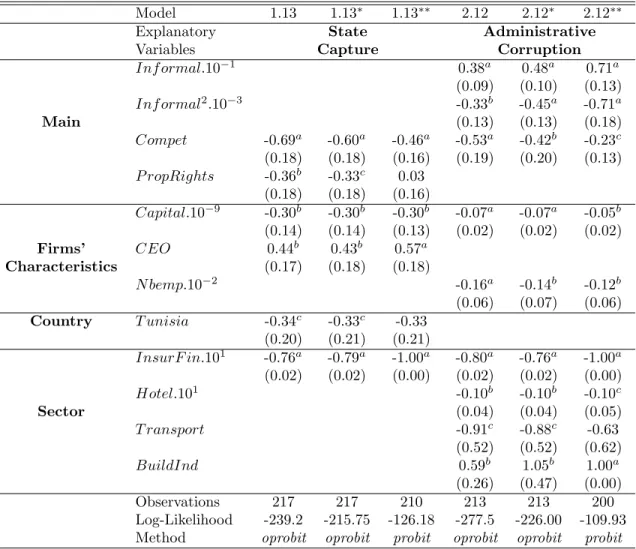
First, the distribution of both variables measuring the supply of corruption is not nor-mal. Hence, the results on their determinants might be specific to such a distribution. To check if the results presented in the previous section hold with different distributions of the variables of corruption, we use alternative cuts of the modalities of state capture and administrative corruption. Instead of six modalities, we cut the variables of corruption into four by gathering the last three modalities (“often”, “mostly” and “always”) into a single one (the first three modalities are “never”, “seldom” and “some-times”). We regress such variables of state capture and administrative corruption on the variables of their respective restrictive model. The coefficients thus estimated by ordered probit are presented in table 6 (models 1.13∗ and 2.12∗).
Second, when using ordered probit estimations in section 4, the underlying assumption is that corruption supply from North African firms is graduate. Yet, firms’ involvement in corruption might not be progressive. If the relevant decision for a firm is whether to involve in corruption or not rather than the frequency of involvement, then a binomial choice model would fit better. Hence, we present the results of probit estimations in the following table in models 1.13∗∗ and 2.12∗∗.
It seems that the results presented above for both state capture and administrative corruption are not sensitive to the number of modalities of these two variables. For 4-cut ordered answers, all coefficients are significant at least at the 10% level and their values are very close to those obtained with six modalities.
As for probit estimations, they show that the main factors of the frequency of both forms of corruption are also relevant to explain firms’ decision on whether to involve in corruption or not. Competitive and high-capital firms are less likely to turn both to state capture and administrative corruption, in the same way as, when they do so, they are less likely to have frequently recourse to corruption. Tunisian firms and firms working in insurance and financial services are also less prompt to state capture, in the same way as large firms and firms in services are less prompt to administrative corruption than small ones and firms in the industrial sector. In Svensson (2003), the “degree of formality” does not significantly affect the intensity of corruption but only the probability that an Ugandan firm has to pay bribes. On the contrary, for North African firms, we find that the probability that a firm involves in administrative
Table 6: Robustness Estimations
Model 1.13 1.13∗ 1.13∗∗ 2.12 2.12∗ 2.12∗∗
Explanatory State Administrative Variables Capture Corruption
Inf ormal.10−1 0.38a 0.48a 0.71a (0.09) (0.10) (0.13) Inf ormal2.10−3 -0.33b -0.45a -0.71a Main (0.13) (0.13) (0.18) Compet -0.69a -0.60a -0.46a -0.53a -0.42b -0.23c (0.18) (0.18) (0.16) (0.19) (0.20) (0.13) P ropRights -0.36b -0.33c 0.03 (0.18) (0.18) (0.16) Capital.10−9 -0.30b -0.30b -0.30b -0.07a -0.07a -0.05b (0.14) (0.14) (0.13) (0.02) (0.02) (0.02) Firms’ CEO 0.44b 0.43b 0.57a Characteristics (0.17) (0.18) (0.18) N bemp.10−2 -0.16a -0.14b -0.12b (0.06) (0.07) (0.06) Country T unisia -0.34c -0.33c -0.33 (0.20) (0.21) (0.21) InsurF in.101 -0.76a -0.79a -1.00a -0.80a -0.76a -1.00a (0.02) (0.02) (0.00) (0.02) (0.02) (0.00) Hotel.101 -0.10b -0.10b -0.10c Sector (0.04) (0.04) (0.05) T ransport -0.91c -0.88c -0.63 (0.52) (0.52) (0.62) BuildInd 0.59b 1.05b 1.00a (0.26) (0.47) (0.00) Observations 217 217 210 213 213 200 Log-Likelihood -239.2 -215.75 -126.18 -277.5 -226.00 -109.93 Method oprobit oprobit probit oprobit oprobit probit
Notes: Standard errors in parentheses: a denotes significance at the 1% level,b at the 5%
level andc at 10%. Residuals heteroscedasticity is corrected with White’s method.
corruption first increases then decreases, both significantly, with the portion of informal activity of the firm, in the same way as the frequency of involvement.
There are minor differences with the previous results (1.13 and 2.12). The enforcement of property and contract rights does not significantly explain the decision of involving in state capture. It means that the quality of the legal system affects rather the fre-quency of giving bribes to influence the formulation of rules than the involvement in state capture. Moreover, the dummy introduced to measure a specific effect of Tunisian firms is only significant at the 15% level. As for administrative corruption, firms in the transport sector are not significantly less likely to get involved in it.
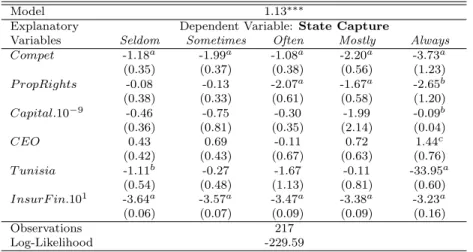
Third, the frequency of involvement in corruption of a firm might not be progressive or ordered. Some frequencies might reveal specific behaviors. If then, a multinomial choice model would be preferable. Thus, in tables 7 and 8, we provide robustness tests
based on multinomial logit estimations: models 1.13∗∗∗ and 2.12∗∗∗. The coefficients
thus give the relative probability that firms have recourse to corruption with a certain frequency by comparison with no recourse to corruption.
Table 7: Multinomial Logit Estimation: State Capture
Model 1.13∗∗∗
Explanatory Dependent Variable: State Capture
Variables Seldom Sometimes Often Mostly Always Compet -1.18a -1.99a -1.08a -2.20a -3.73a (0.35) (0.37) (0.38) (0.56) (1.23) P ropRights -0.08 -0.13 -2.07a -1.67a -2.65b (0.38) (0.33) (0.61) (0.58) (1.20) Capital.10−9 -0.46 -0.75 -0.30 -1.99 -0.09b (0.36) (0.81) (0.35) (2.14) (0.04) CEO 0.43 0.69 -0.11 0.72 1.44c (0.42) (0.43) (0.67) (0.63) (0.76) T unisia -1.11b -0.27 -1.67 -0.11 -33.95a (0.54) (0.48) (1.13) (0.81) (0.60) InsurF in.101 -3.64a -3.57a -3.47a -3.38a -3.23a (0.06) (0.07) (0.09) (0.09) (0.16) Observations 217 Log-Likelihood -229.59
Notes: The reference modality stands for never involving in state capture. By hypothesis, all the coefficients of such a modality are null. Standard errors in parentheses: a denotes significance at the 1% level, b at the 5% level and c at 10%. Residuals heteroscedasticity is corrected with White’s method.
The probability that firms with a stable or increasing competitiveness involve in state capture, whatever the frequency, is significantly lower than the probability of never corrupting. The respect of property rights is more discriminating in terms of frequency: firms with well enforced property rights are less likely to give bribes often or more. Nevertheless, there is not any significant difference for these firms between paying bribes sometimes, seldom or never.
Having a low capital or a CEO answering the survey enhances the probability that firms always turn to state capture rather than never. But both characteristics do not make any significant difference between frequent state capture and absence of state capture. Surprisingly, Tunisian firms are less likely to practice state capture seldom or always than never. Finally, working in the insurance and finance sector reduces the probability to involve in state capture, whatever the frequency.
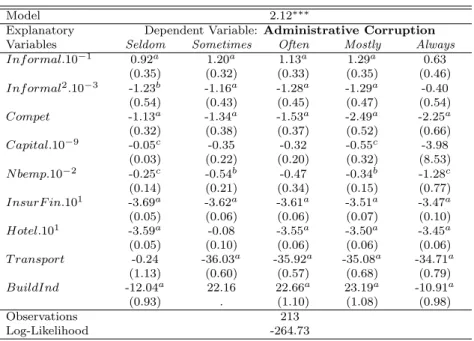
Like ordered probit estimations, multinomial logit estimations show the existence of a quadratic relation between the portion of informal activity and administrative cor-ruption. The probability of giving bribes to influence the application of laws is first higher then lower than the probability of never involving in administrative corruption when the firm’s portion of informal activity grows. As mentioned above, firms los-ing competitiveness are more likely to give bribes seldom or more often than to avoid corruption.
Table 8: Multinomial Logit Estimation: Administrative Corruption
Model 2.12∗∗∗
Explanatory Dependent Variable: Administrative Corruption Variables Seldom Sometimes Often Mostly Always Inf ormal.10−1 0.92a 1.20a 1.13a 1.29a 0.63 (0.35) (0.32) (0.33) (0.35) (0.46) Inf ormal2.10−3 -1.23b -1.16a -1.28a -1.29a -0.40 (0.54) (0.43) (0.45) (0.47) (0.54) Compet -1.13a -1.34a -1.53a -2.49a -2.25a (0.32) (0.38) (0.37) (0.52) (0.66) Capital.10−9 -0.05c -0.35 -0.32 -0.55c -3.98 (0.03) (0.22) (0.20) (0.32) (8.53) N bemp.10−2 -0.25c -0.54b -0.47 -0.34b -1.28c (0.14) (0.21) (0.34) (0.15) (0.77) InsurF in.101 -3.69a -3.62a -3.61a -3.51a -3.47a (0.05) (0.06) (0.06) (0.07) (0.10) Hotel.101 -3.59a -0.08 -3.55a -3.50a -3.45a (0.05) (0.10) (0.06) (0.06) (0.06) T ransport -0.24 -36.03a -35.92a -35.08a -34.71a (1.13) (0.60) (0.57) (0.68) (0.79) BuildInd -12.04a 22.16 22.66a 23.19a -10.91a (0.93) . (1.10) (1.08) (0.98) Observations 213 Log-Likelihood -264.73
Notes: The reference modality stands for never involving in administrative corruption. By hypothesis, all the coefficients of such a modality are null. Standard errors in parentheses: a denotes significance at the 1% level,b at the 5% level and c at 10%. Residuals heteroscedasticity is corrected with White’s method.
with the size of the financial capital. Large firms and firms working in services are sig-nificantly less likely to have recourse to bribery at any frequency than never. Finally, notice that firms working in the building sector are more likely to practice administra-tive corruption often or mostly than never. But they are more likely never to involve in corruption than to have recourse to it seldom or always.
In brief, our main results are robust to the cut of the modalities of our variables of inter-est, administrative corruption and state capture, but also to the econometric method: the loss of competitiveness is relevant to explain the involvement in corruption and its frequency, whereas the portion of informal activity is determining for the recourse to administrative corruption and its intensity. An exception is the failing enforcement of property rights, which significantly explains behaviors of frequent state capture rather than the decision of involving in state capture (at a low level). Control variables are enlightening for both analysis, involvement and frequency.
5.2
Is There a Selection Bias?
In our sample, 41.31% of firms do not answer the question on the frequency of state capture, 36.14 on the frequency of administrative corruption. Figure in appendix displays non-response rates by country. If non-response is not random and if it has an
influence on the frequency of state capture, then inference based on classical ordered probit estimations is biased: the selection bias is due to the restriction of the analysis to a sample not randomly selected.
In our case, the selection equation is of the form:
y∗
1i= x01iβ1+ u1i (2)
y1i = 1 if y1i∗ > 0 ; y1i = 0 otherwise (3)
so that y2i is observed if and only if y1i= 1. The equation of interest is: y∗ 2i= y2i∗∗∗ y1i (4) y∗∗ 2i = x02iβ2+ u2i (5) y2i = 1 if y2i∗ ≤ µ1 y2i = 2 if µ1 < y2i∗ ≤ µ2 ... y2i = 6 if µ5 < y2i∗. (6)
From equations (4) and (5), we derive:
E(y∗
2i|x1i, y1i= 1) = x02iβ2 + E(u2i|x1i, y1i = 1). (7)
There is a selection bias if the error terms u1i and u2i are correlated, that is to say
if E(u2i|x1i, y1i = 1) 6= 0. In this case, classical ordered probit estimations yield
inconsistent estimators.
Several methods may be used for treating this issue. Tobit models are not appropriate for two reasons: they apply to continuous data and they require that all determinants of non-response are common with those of the frequency of corruption. Heckman selection models enable some of the factors of non-response to be specific to the equation of selection but they also apply to continuous endogenous variables in the equation of interest. Here, we use a censored ordered probit model which fits with ordered polytomic endogenous variables in the equation of interest and which enables to have different variables (as well as common ones) in both equations.
As suggested in Heckman (1979), we include a correction term for E(u2i|x1i, y1i = 1)
to take into account a potential selection bias. We assume that
E(u2i|x1i, y1i= 1) = γ[y1i− E(y1i|xi)]. (8)
Thus, equation (5) becomes:
y∗∗
2i = x02iβ2+ γ[y1i− φ(x01iβb1)] + η2. (9)
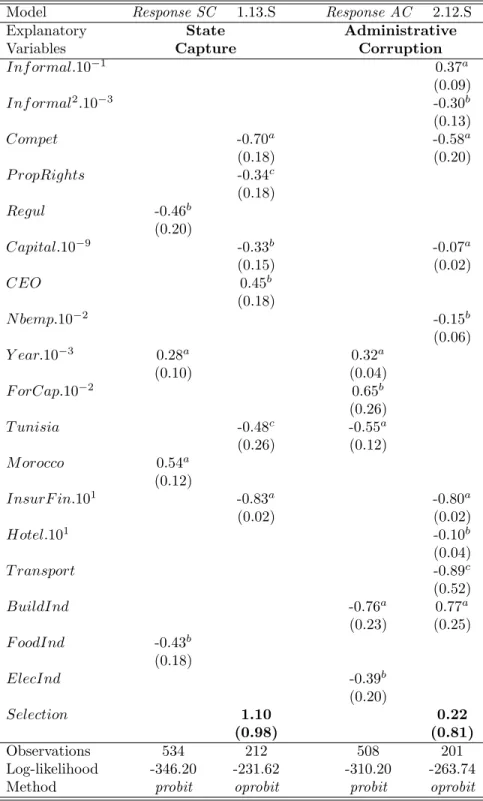
We run a two-step procedure, the results are presented in table 9. First, we run a probit regression on the selection equation which enables to highlight the main factors
of response to the questions on state capture (first column) and on administrative corruption (third column). From this regression, we build the variable Selection =
y1i− φ(x01iβb1) = cu1i. Secondly, we estimate the equation of interest by ordered probit:
we regress the frequency of state capture (column 2) and administrative corruption (column 4) on relevant factors retained in section 4 and augmented with the variable
Selection.
In columns ResponseSC and ResponseAC , we report the results of probit estimations of the factors of answer. The final specification is retained according to the same procedure as the one described for our main model (see section 4).
The correction term Selection included among regressors in the two equations of inter-est (1.13.S) and (2.12.S) has a very high z-statistic in both regressions, state capture and administrative corruption. This implies that there are no significant unobservable characteristics which determine both the probability of response (P (y1i = 1) and the
expected frequency of corruption (E(y∗
2i|x1i)): the selection bias is not significant. As
a robustness test for the existence of a selection bias, we calculate the likelihood ratio based on the null hypothesis that the parameter vector of the model satisfies the se-lection constraint. The likelihood ratio is equal to 15.24 with an associated p-value of 0.00. Hence, the heckman ordered probit estimation can be considered as equivalent to the combination of a probit for response and an ordered probit for the outcome, i.e. the frequency of corruption.
The probability of answering the question on the frequency of state capture significantly decreases with the respect of fiscal regulations and the age of the firm. Firms settled in Morocco and firms not working in the food-processing industry are more likely to answer such a question. In the same way, older firms are more likely to censor themselves on their involvement in administrative corruption, as well as Tunisian firms and firms with a higher share of national capital (private or public) relatively to foreign capital. Then, the probability of self-censoring on administrative corruption is higher for firms in building or electrical sectors. However, as mentioned, self-censorship does have a significant influence on the frequency of both forms of corruption. And the significance of the most relevant factors of corruption of the two main specifications are not affected by the introduction of the correction term.
6
Conclusion
The database we use provides new information on North African firms. In this paper, we seek to highlight the main factors of administrative corruption and state capture in this region, i.e. of both involvement in these two forms of corruption and frequency. We control for a potential selection bias and compare corruption behaviors in Maghreb, transition countries and Uganda.
The joint analysis of the main factors of administrative corruption and state capture in Algerian, Moroccan and Tunisian formal firms emphasizes a few major phenomena.