HAL Id: hal-03100573
https://hal.archives-ouvertes.fr/hal-03100573
Submitted on 29 Jan 2021
HAL is a multi-disciplinary open access
archive for the deposit and dissemination of sci-entific research documents, whether they are pub-lished or not. The documents may come from teaching and research institutions in France or abroad, or from public or private research centers.
L’archive ouverte pluridisciplinaire HAL, est destinée au dépôt et à la diffusion de documents scientifiques de niveau recherche, publiés ou non, émanant des établissements d’enseignement et de recherche français ou étrangers, des laboratoires publics ou privés.
Spatial Analysis of Natural and Anthropogenic Factors
Influencing Chimpanzee Repartition in Sebitoli (Kibale
National Park, Uganda)
Sarah Bortolamiol, Sabrina Krief, Frédéric Jiguet, Milena Palibrk,
Rwaburindore Protase, John Kasenene, Andrew Seguya, Marianne Cohen
To cite this version:
Sarah Bortolamiol, Sabrina Krief, Frédéric Jiguet, Milena Palibrk, Rwaburindore Protase, et al.. Spatial Analysis of Natural and Anthropogenic Factors Influencing Chimpanzee Repartition in Sebitoli (Kibale National Park, Uganda). International cartographic conference, Aug 2013, Dresden, Germany. �hal-03100573�
Spatial Analysis of Natural and Anthropogenic
Factors Influencing Chimpanzee Repartition in
Sebitoli (Kibale National Park, Uganda)
Sarah Bortolamiol1,2,3,6, Sabrina Krief3,6, Frederic Jiguet4, Milena
Pali-brk5, Protase Rwaburindore7, John Kasenene7, Andrew Seguya8, Mari-anne Cohen1,2,5, 6.
1 Université Paris Diderot – Paris 7, 5 rue Thomas-Mann - 75013 Paris.
2 UMR LADYSS - 200 avenue de la République - 92001 Nanterre cedex.
3 UMR 7206 - Eco-anthropologie et ethnobiologie, Muséum national
d’histoire naturelle - 43 rue Buffon - 75231 Paris Cedex 5.
4 UMR 7204 - MNHN-CNRS-UPMC ’Centre des Sciences de la
Conserva-tion’ - 55 Rue Buffon, CP 51 - 75005 Paris.
5 PPF Pôle Image – Université Paris Diderot – Paris 7, Case 7001 - 75205
Paris cedex 13.
6 Projet pour la Conservation des Grands Singes (PCGS) - 3 rue Titien -
75013 Paris.
7 Department of Botany Herbarium, Makerere University - P.O. Box 7062 -
Kampala, Uganda.
8 Uganda Wildlife Authority - P.O.Box 3530 - Kampala, Uganda.
Abstract. Using a combination of geographical data, spatial analysis is a
precious tool in environmental sciences. Many process are underlying land-scape, they are interacting together and having different impacts. We ana-lyzed 4 years of data collected in a wild chimpanzee community using a multidisciplinary method in order to determine natural and human factors that influence chimpanzee repartition. It seem that chimpanzee density is
high (4.4 individuals/km2) even if their home range is circumcised by
an-thropogenic elements. Chimpanzees are not avoiding forest edges in contact with human population and they are crossing the road passing through their home range.
1. Introduction
Worldwide conservation efforts are trying to cope increasing an-thropogenic pressure with disturbance of natural areas due to human ac-tivities. Great Apes are facing recent decline in suitable environmental con-ditions (Junker et al. 2012). Among them, our closest relative, the chimpan-zee (Pan troglodytes) is threatened (classified on IUCN red list as endan-gered, IUCN website), because of past and present forest exploitation, poaching activities and species-specific ecological requirements.
Our study aims to improve understanding of chimpanzees living in a forest area under human pressure. Analyzing landscape, species spatial distribution (vegetal and animal) and factors influencing their repartition could give some keys for a better management of nature conservation in anthropogenic environment.
The interactions between chimpanzees, landscapes and human soci-eties are closely related to spatial pattern and processes and for this reason, spatial analysis is useful to understand and even model them.
First of all, chimpanzees (Pan troglodytes) prefer certain habitats and they are supposed to be more abundant in places where environmental conditions are optimal (Turner et al. 2003, Kerr & Ostrovsky 2003) and food resources abundant (Potts 2009, Hockings et al. 2009).
Second, chimpanzees have a typical territorial behavior (Caldecott & Miles 2009, Goodall 1986) related to their fission-fusion social organiza-tion.
Third, interactions between human societies and chimpanzees are depending from the proximity between them (Naughton-Treves et al. 1998, Hartter et al. 2010) and occur within the edge between the protected forest and the agricultural landscape that surrounds it.
The aim of spatial analysis in ecology is to identify patterns that help understanding ecological processes (Fortin et al. 2006). Geographers use points, lines, areas and surfaces to describe spatial organization (Fother-ingham et al. 2000), underlying continuities and discontinuities in space (Alexandre et al. 2008). In this study, we combined several techniques and methods to tackle our objective.
The following article will start by a description of the study site fol-lowed by the method section, and then the results we obtained by the set of methods.
2. Materials and Methods
2.1. Materials
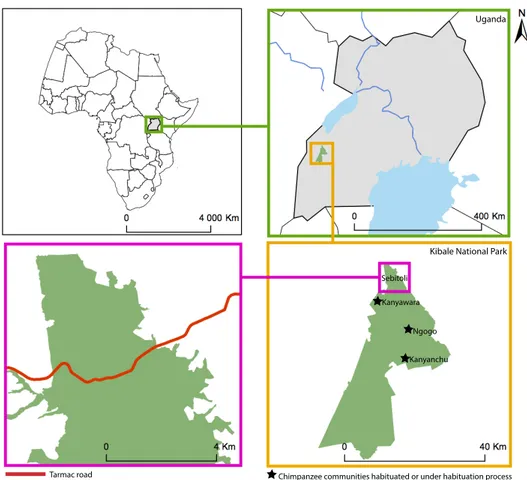
2.1.1. Study SiteKibale National Park (795 km2), located in southwestern Uganda (fig.1), is well known for its high diversity of plants and mammals. The habitat is a mosaic of mature forest (58%), colonizing forest used for agri-culture in the past (19%), grassland (15%), woodland (6%), lakes and wet-lands (2%) (Struhsaker 1997, Chapman & Lamber 2000, Chapman et al. 1997). Since1993, the forest has been classified as a National Park and is
under management of Uganda Wildlife Authority (UWA).
Sebitoli Kanyawara
Ngogo Kanyanchu
Uganda
Kibale National Park
Tarmac road
Sources: ESRI, PCGS. Chimpanzee communities habituated or under habituation process Figure 1. Location of Kibale National Park and Sebitoli study area.
A thousand Eastern chimpanzees - Pan troglodytes schweinfurthii – are organized in several chimpanzee communities, with varied densities
(Kanyawara 1,5 i/km2, Ngogo: 5.1, Potts 2009). Chimpanzee need up to 10
years to be observed and to get habituated1 to the presence of humans.
1 Habituation, defined in primatology by Johns (1996), is a process in which chimpanzees fleeing reaction decrease with frequency of contacts with humans.
Sebitoli study area, located extreme north of the park (Figure 1), in-cludes the protected forest and the agricultural area bordering it. The
densi-ty of chimpanzees is higher than 2 individuals/km2 (unpublished data,
col-lected by Sebitoli Chimpanzee Project supervised by S. Krief). Human activ-ities are frequent at the edge of the forest and inside (tarmac road). Many mammals are going outside the forest border to feed in neighboring gar-dens (Naughton-Treves 1998). Human communities are also entering the forest for illegal activities sometimes (MacKenzie et al. 2011).
We are analyzing 4 years of data collected in this area from February 2009 to January 2013.
2.1.2. Data
2.1.2.1. Imagery
A first step consisted in gathering imagery resources since no data on Sebitoli had ever been compiled. We first used 1964 topographical map
of Fort Portal (1/50 000e, Royal Museum of Central Africa – Tervuren,
Bel-gium) and a set of images captured from Google Earth Pro (23/06/2001 – N=11 – Premium resolution 4800 x 4775 pixels) assembled with Photoshop CS5 to create a mosaic picture of Sebitoli study area.
Landsat image (Landsat 7 - ETM+, 30m resolution, orthorectified, 14/03/2001) was used to create a land-cover map. Also, recent acquirement of Spot image (2,5m, color, orthorectified, 28/11/2008) allowed use to up-date and digitalize landscape elements. Finally, we also used a Digital Ele-vation Model (SRTM image – 30m resolution) from which we extracted slopes and elevations.
2.1.2.2. Botanical Information
We surveyed botanical information in 62 50x50m plots located in-side the forest, and 17 outin-side. In the protected area, we placed plots ran-domly using a stratified method where the number of plots is proportional to superficies of each land-cover class previously defined with Landsat im-age (Section 2.2.1). The 17 plots located outside the forest were sampled according to the type of edge, i.e. the type of landscape in contact according to land-cover classification.
Plot census was conducted with the help of two field assistants and Makerere University Botany Herbarium Department.
From georeferenced datasheets of chimpanzee habituation, we de-termined the species most consumed by chimpanzees.
2.1.2.3. Chimpanzee Monitoring
The chimpanzees survey, made by field-assistants, is helped by mov-ing transects (mapped on Figure 2) designed to access dense forest more easily. Chimpanzee presence (feces, direct observations, nests, footprints, vocalizations) is located with GPS points; distance of chimpanzee(s) from
observers, orientation, number of individuals, if possible their identity, ac-tivities and other information related to their behavior (for instance, con-sumed species) are specified. Anthropogenic signs (fire camp, snares, noise, footprints) are also gathered during the survey and their geographic coor-dinates are recorded in GPS.
Type of
signs Direct observations Vocalizations Feces Total
Total 1570 1401 481 3452
Table 1. Number of observation types between February 2009 and January 2013.
2.1.2.4. Socio-economical Information
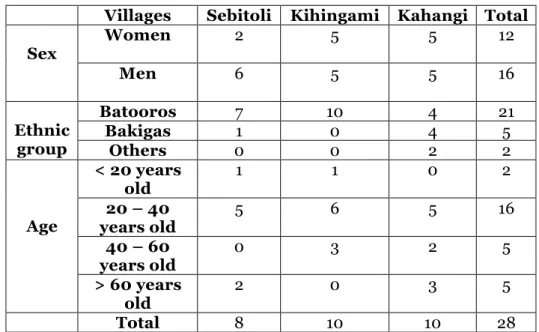
We conducted 28 semi-directive interviews and participative obser-vations in 3 local communities surrounding the forested area (Sebitoli, Kihingami, Kahangi) from October 2012 to January 2013. Our goal was to understand uses and practices of people living around the park, and their relationships with wild animals. We selected the villages according to their location (proximity to the road, orientation toward forest), land-cover char-acteristics (presence or absence of elephant trench constructed by UWA to avoid wildlife going out of the park, gardens location) and empirical infor-mation about communities (poaching activities signs). We try to represent different population categories and distances to the forest in order to have a representative sample of spatial and socio-demographic diversity encoun-tered around Sebitoli study area.
Villages Sebitoli Kihingami Kahangi Total
Sex Women 2 5 5 12 Men 6 5 5 16 Ethnic group Batooros 7 10 4 21 Bakigas 1 0 4 5 Others 0 0 2 2 Age < 20 years old 1 1 0 2 20 – 40 years old 5 6 5 16 40 – 60 years old 0 3 2 5 > 60 years old 2 0 3 5 Total 8 10 10 28
One UWA ranger is in charge of contact with public and we used their survey of the crop raiding incidents to determine in which village UWA was carrying more frequent interventions and for which animal spe-cies (January 2012 to December 2012).
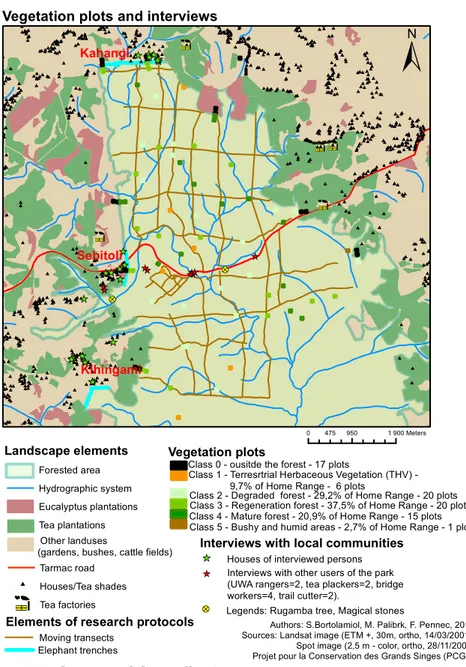
Figure 2. Study area and data collection ! ? ! ? #### # # # # ## # ## # # # # # # ## # # # # # # # # # #### # ## # # # # # # ####### # # # # # # # # # ## ## # # # # # ### # # # # # # # # # # # # # # # # # #### ## # # ## # ## # # # ##### # # # # # ## # # ## # ### # ###### ### # # # # ## # ### ## ## # # ### ## # # # # # # # ## # # # # # # # # ## # # # ### # ### # # # # # # ### ## #### # # ################### #### #### # # # # # # ## # # # ## #### # # # # # # # ###### ### # # # ##### # # ######## # # #### ## # # # # ### ## ### # ### # # # # # # # # # # # # # # # # # # # # # # # ####### # # # # # ################### ## ## ## # ## # # ## # ########### # # # # # ### # # ## # # # #### # # ## # # ## ## ## # ## # # ### # ###### # ## # ## ## # # # # ## ## # # # # ### # # # # # # # # # # ## ## # ###### # ### # ############# # ## ### # # # # # # # ## # # # # # ## # ###### # # # # # ## ### # # # # # #### ### # # ### ## ###### ## ## # ### # ##### # # # # # ###### ################ ### # # ## # # # # # # # # # # # # ### ## # # # # # # # # # # # # # # # # # # # # # # ## # # # # # #### ## # # # # # # #### ## # # # # # # # ## # # ###### ## # # ## # # # ########### # # # # # # # # # # ## # # ### # # # # # # # # # # # ### # # # ######## # # # # # # # # # # # # # # # # # # # # # # # # # # # # # # # # # # # # ## # # # ## # # # # # #### # # # # # # ## # # # # # # # ## # # # # # # ### ### # # # # ## ## # # # # # # ### # # ### # #### # # # # ## ## # ## # # # # # ### # # # ##### # # # # ### # # # # # ### # # ### # # # ### # # # # ## # # # # # #### # # # # # # # ### # ###### # # # # # # # # ### ## # # # # # # # # ## # # ## # # ## ## ##### # # # # # # # ### # # # ## # ## ## # ########### ### ## # # # # # # ### # # # # # # # # # ## # # # # ## # # # # # # ## # # # ## # # # ## ## # # # # # # # ## # # # # # # # # # # # [ _ [ _ [ _ [ _ [_ [ _[_ [ _ [ _ [ _ [ _ [ _ [_ [ _ [ _ [ _ [ _ [ _ [ _ [ _ [ _ [ _ [ _ [ _ [ _ [ _ [ _ [ _ [ _ [ _[_ [ _ [ _ [ _ [ _[_ S R S R S R S R S R
±
Vegetation plots and interviews
Landscape elements
Elements of research protocols
Forested area Hydrographic system Eucalyptus plantations Tea plantations Tarmac road Houses/Tea shades S R Tea factories Moving transects 0 475 950 1 900Meters
Interviews with local communities
Houses of interviewed persons
Legends: Rugamba tree, Magical stones
Sebitoli
Kihingami Kahangi
Elephant trenches
Interviews with other users of the park (UWA rangers=2, tea plackers=2, bridge workers=4, trail cutter=2).
[ _ [ _ # ! ? Other landuses
(gardens, bushes, cattle fields)
Vegetation plots
Class 0 - ousitde the forest - 17 plots
Class 1 - Terresrtrial Herbaceous Vegetation (THV) - 9,7% of Home Range - 6 plots
Class 2 - Degraded forest - 29,2% of Home Range - 20 plots Class 3 - Regeneration forest - 37,5% of Home Range - 20 plots Class 4 - Mature forest - 20,9% of Home Range - 15 plots Class 5 - Bushy and humid areas - 2,7% of Home Range - 1 plot
Authors: S.Bortolamiol, M. Palibrk, F. Pennec, 2013. Sources: Landsat image (ETM +, 30m, ortho, 14/03/2001), Spot image (2,5 m - color, ortho, 28/11/2008). Projet pour la Conservation des Grands Singes (PCGS).
2.2. Spatial analysis
2.2.1. Remote Sensing and Vegetation Survey: From Area to Points
We used Envi 4.5 to analyze satellite images of Kibale National Park. We used unsupervised classification followed by PCA on Landsat image to determine 6 different land-cover (from which we placed vegetation plots):
- Class 0: Outside the forest (houses, crops, tea, eucalyptus, road), - Class 1: Surface of Terrestrial Herbaceous Vegetation (THV), - Class 2: Surface of degraded forest,
- Class3: Surface of regeneration forest, - Class 4: Surface of mature forest,
- Class 5: Surface of bushy and humid areas.
2.2.2. GIS Analysis
We used ArcGIS 10.0 (License Arcinfo - ESRI) to integrate maps, images and GPS points, georeferenced in the WGS 84 geodesic system and UTM 36N cartographic projection. ArcTool box and ETGeowizard allowed us to perform spatial analysis treatments.
2.2.2.1. Digitalizing Landscape Elements
We digitalized landscape elements such as eucalyptus plantations, hydrographic system, roads, forest edge, houses and plantations from topo-graphical map of Fort Portal, Google Earth mosaic and Spot image.
2.2.2.2. Representing Chimpanzee Home Range: From Points to Area We used Polygon Convex Minimum method (PCM, Mohr 1987) available with ETGeowizard, in order to connect GPS points and define the boundaries of Sebitoli chimpanzee home range (Steiniger et al. 2010, Dick-son et al. 2005). We disregard external points corresponding to vocaliza-tions and crop-raiding events.
To determine if chimpanzee home range was frequented equally, we calculated Kernel density estimator. We normalized the result by multiply-ing values of each range by 0,00165519 (=Total number of chimpanzee ob-served during the study period/density sum) (Di Salvo et al. 2005).
2.2.2.3. From Points to Grid Cell: Modeling Chimpanzee Repartition
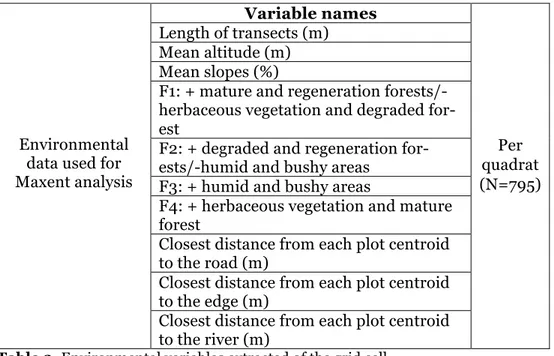
With ETGeowizard, we created a grid of 200 x 200 meter quadrats inside the chimpanzee home range. By intersecting it with other GIS layers (DEM, Land-cover classification, chimpanzees GPS points) we extract the environmental characteristics of each cell of the grid. We performed a Prin-cipal Component Analysis (PCA) to avoid problems of auto-correlations, and retained the values of the 4 four Principal Components of the PCA (F1, F2, F3, F4).
Environmental data used for Maxent analysis Variable names Per quadrat (N=795) Length of transects (m) Mean altitude (m) Mean slopes (%)
F1: + mature and regeneration forests/-herbaceous vegetation and degraded for-est
F2: + degraded and regeneration for-ests/-humid and bushy areas
F3: + humid and bushy areas
F4: + herbaceous vegetation and mature forest
Closest distance from each plot centroid to the road (m)
Closest distance from each plot centroid to the edge (m)
Closest distance from each plot centroid to the river (m)
Table 3. Environmental variables extracted of the grid cell
Maxent program version 3.3.3 has been used to determine the prob-ability of chimpanzees presence across Sebitoli from this set of data (Elith et al. 2011).
A first step in the modeling framework was to validate the model obtained when using all available observation locations with Maxent. So we first bootstrapped Maxent model 50 times, by randomly selecting for each run 75% of the occurrence locality grid cells as training data with the re-maining 25% reserved for testing the resulting model. We used recom-mended default values as in Junker et al. (2012) for the convergence
threshold (105), maximum number of iterations (500) and regularization
value (104), and let the program automatically select ‘features’
(environ-mental variables) following default rules according to the number of pres-ence records (Phillips et al. 2006). Overall model performance was evaluat-ed by means of the ‘Area under the Curve’ (AUC) determinevaluat-ed by the Receiv-er OpReceiv-erating CharactReceiv-eristic Curves (ROC) analysis (Phillips et al., 2006). Random prediction (AUC=0,5) would predict 50% of potential chimpanzee repartition surface using 50% of presence data. Therefore, the more AUC and training data curves turn to 1 (and above 0,75 – Fielding et al. 1997), the more the model is trustful. We finally ran a complete model using 100% of observations, which output is presented here (Figure 7).
To compare Kernel estimation and Maxent model, we performed a linear correlation between pixel values of Maxent and Kernel grid cells.
2.2.2.4. Measuring edge effect by a buffer analysis
To characterize land use around Sebitoli chimpanzee home range, we created a 2500 meters buffer zone in which we determined the surface of land-use categories.
From our of interviews with local communities, we are using some quantitative information to represent interactions between local communi-ties and wildlife in ArcGis such as frequency of crop raiding observations as well as the public complaints recorded by the Park ranger.
3. Results
3.1. From Area to Points: Landscape and Food Resources
Spa-tial Patterns
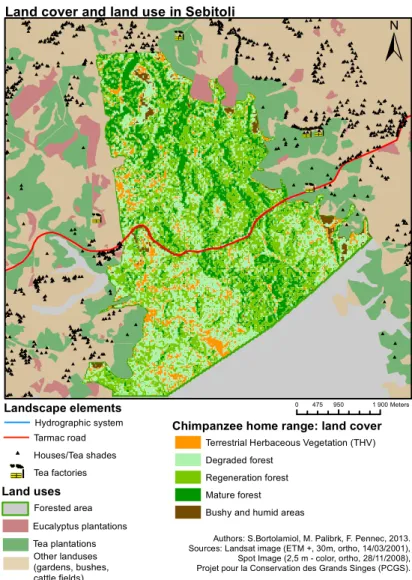
The protected forest, including chimpanzee home range, is mostly composed of regeneration forest (37%), followed by degraded forest (28%), mature forest (21%), Terrestrial Herbaceous Vegetation (9%) and bushy/humid vegetation (6%), depicting a more degraded landscape than in the whole Park (Section 2.1.1).
The spatial distribution of these types suggests a strong spatial pat-tern (Figure 3), opposing wespat-tern and easpat-tern sides, probably due to the previous intensive exploitation of timber, when the forest was not yet under protection.
Figure 3. Land-cover and land use in Sebitoli study area.
Tea plantations are more important (21.45 km2) than eucalyptus
plantations (3.37 km2); only 4 plantations are connected to the park.
Hous-es are observed on the northern and south-wHous-estern sidHous-es of the protected forest. On north-western side, gardens, bushes and cattle-field are close to the forest edge.
3.1.1. Species Availability in Vegetation Plots
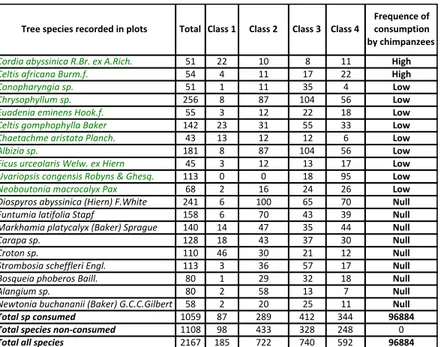
In the 62 vegetation plots located in the 5 habitat classes of the for-est defined with Landsat, we counted 7163 stems of 362 species (or 205 genus) more or less consumed by Sebitoli chimpanzees (Tables 4 and 5)
#### # # # # ## # ### # ## # # ## # # # # # # # # # #### # ## # # # # # # ####### # # # # # # # ## ## ## # # # # # ## # # # # # # # # # # # # # # # # # # ###### # # ## # ## # # # ##### # # # # # ## # # ## # # ## # ######### # # # # ## # ### ## ## # # ### ## # # # # # # # ## # # # # # # # # ## # # # ### # ### # # ### ## ###### ############### ## ## #### #### # # # # # # ## # # # ## #### # # # # # # # ###### ### # ## ##### # # ######## # # #### ## # # # # # # # # # # # # # ##### # ####### ## ## ## # ## # # ## # ########### # # # # # ### # # # # # # # #### # ### # # ## ## ## # # # # # ### # ###### # ### ## ## # # ## ## ### # # # ### # # ## # # # # # ##### # ###### # ### # ############# # # # ### # # # # # # # ## # # # # # ## # ###### # # ## # ## #### # # # # #### ### # # ### ## ###### ## ### ## ## ##### # # # # # ###### ################ #### # ## # # # # # # # # # # # # ### ## # # # # # # # # # # # # # # # # # # # # # # ## # # # # #### ## # # # # # ######## # # # # # # ## # # ###### ## ### # # # ############ # # # # # # # # ##### # ### # # # # # # # # # # # ### # # # ######## # # # # # # # # # # # # # # # # # # # # # # # # # # # # # # # # # # # # ## # # # # # # #### # # # # # # # # # # # # # # # ## # # # # # ### ### ## # # ##### # # ## # # # # # # #### # # # ##### # # # # ## # # # # # # ## # ### # # # # # ### # # ## # # # # # # # #### # # # # # # # ## # # ###### # # # # # # # # ### # ## # # ## ## ##### # # # # ## # # # ## # # ## ############ ### ## # # # # # # ### # # # # # # # # # # ## # # # # # # ## # # # ## # # # ## # # # # S R S R S R S R S R
±
Land cover and land use in SebitoliLandscape elements Forested area Hydrographic system Eucalyptus plantations Tea plantations Tarmac road Houses/Tea shades S R Tea factories 0 475 950 1 900Meters
Authors: S.Bortolamiol, M. Palibrk, F. Pennec, 2013. Sources: Landsat image (ETM +, 30m, ortho, 14/03/2001), Spot Image (2,5 m - color, ortho, 28/11/2008), Projet pour la Conservation des Grands Singes (PCGS).
#
Chimpanzee home range: land cover
Land uses
Other landuses (gardens, bushes, cattle fields)
Terrestrial Herbaceous Vegetation (THV) Degraded forest
Regeneration forest Mature forest Bushy and humid areas
Tree$species$recorded$in$plots Total Class$1 Class$2 Class$3 Class$4 Frequence$of$ consumption$ by$chimpanzees Cordia'abyssinica'R.Br.'ex'A.Rich. 51 22 10 8 11 High Celtis'africana'Burm.f. 54 4 11 17 22 High Conopharyngia'sp. 51 1 11 35 4 Low Chrysophyllum'sp. 256 8 87 104 56 Low Euadenia'eminens'Hook.f. 55 3 12 22 18 Low Celtis'gomphophylla'Baker 142 23 31 55 33 Low Chaetachme'aristata'Planch. 43 13 12 12 6 Low Albizia'sp. 181 8 87 104 56 Low Ficus'urceolaris'Welw.'ex'Hiern 45 3 12 13 17 Low Uvariopsis'congensis'Robyns'&'Ghesq. 113 0 0 18 95 Low Neoboutonia'macrocalyx'Pax 68 2 16 24 26 Low Diospyros'abyssinica'(Hiern)'F.White 241 6 100 65 70 Null Funtumia'latifolia'Stapf 158 6 70 43 39 Null Markhamia'platycalyx'(Baker)'Sprague 140 14 47 35 44 Null Carapa'sp. 128 18 43 37 30 Null Croton'sp. 110 46 30 21 12 Null Strombosia'scheffleri'Engl. 113 3 36 57 17 Null Bosqueia'phoberos'Baill. 80 1 29 32 18 Null Alangium'sp. 80 2 58 13 7 Null Newtonia'buchananii'(Baker)'G.C.C.Gilbert'&'Boutiqu58 2 20 25 11 Null Total&sp&consumed 1059 87 289 412 344 96884 Total&species&non0consumed 1108 98 433 328 248 0 Total&all&species 2167 185 722 740 592 96884
Table 4. Top 20 tree species recorded in plots and their consumption by Sebitoli chimpanzees (null, low >1000, medium (1000 – 12000), high (>12000)).
THV$species$recorded$in$plots Class$ 1 Class$ 2 Class$ 3 Class$ 4 Class$ 5 Total Frequence$of$ consumption$ by$ chimpanzees Aframomum(sp. 16 83 80 56 0 235 Medium Piper(capense(L.f. 6 38 41 25 0 110 Low Fern(sp. 13 282 114 66 23 498 Low Hypoestis(forskaolii(((Vahl)(R.(Br. 9 6 49 141 0 205 Null Cynodon(dactylon((L.)(Pers. 0 198 0 0 0 198 Null Mimulopsis(arboreus 14 69 17 83 0 183 Null Allophylus(sp. 35 52 42 53 0 182 Null Panicum(sp. 3 48 72 37 0 160 Null Unknown(tree(sp. 17 66 60 11 0 154 Null Desmodium(sp. 21 67 33 19 1 141 Null Acalypha(sp. 0 44 51 34 0 129 Null Crassocephalum(sp. 1 101 3 6 0 111 Null Cyperus(sp. 0 8 0 0 90 98 Null Psychotria(sp. 17 16 40 21 0 94 Null Commelina(sp. 5 23 19 44 0 91 Null Palisota(sp. 1 27 44 19 0 91 Null Tarenna(pavettoides((Harv.)(Sim 5 12 16 56 0 89 Null Aspilia(africana((Pers.)(C.D.Adams 1 20 15 39 7 82 Null Dracaena(sp. 1 36 29 16 0 82 Null Brillantaisia(cicatricosa(Lindau 11 26 12 10 0 59 Null Total&sp&consumed 35 403 235 147 23 843 8466 Total&species&non0consumed 130 793 490 579 98 2090 0 Total&all&species 165 1196 725 726 121 2933 8466
Table 5. Top 20 THV species recorded in plots and their consumption by Sebitoli chimpanzees (null, low >1000, medium (1000 – 12000), high (>12000)).
Forest habitats contain more food resources for chimpanzees than non forest sectors. Feeding trees are abundant in mature and regeneration forest, while herbaceous resources are abundant in degraded forest.
3.2. From Points to Area
3.2.1. Spatial interpolation of chimpanzee observations
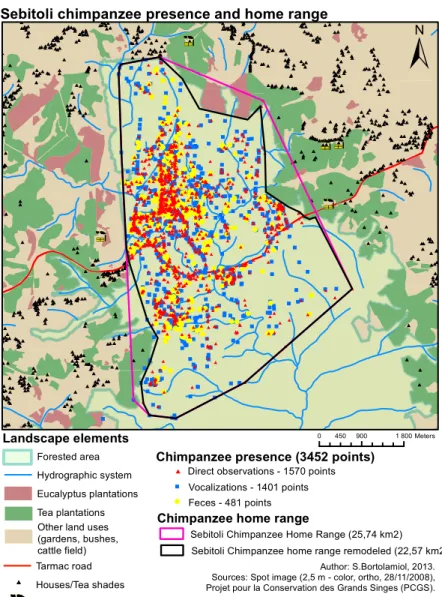
Using Polygon Convex Minimum method on the 3452 recorded
points, we determined chimpanzee home range was 22.5 km2. This home
range is located in the northern part of the protected forest, including the tarmac road.
Figure 4. Sebitoli chimpanzee home range
#### # # # # # # # ## # # # # # # ## # # # # # # # # # ####### # # # # # # ####### # # # # # # # ## ## ## # # # # # ## # # # # # # # # # # # # # # # # # # #### ## # # ## # ## # # # ##### # # # # # ## # # ## # # ## # ###### ### ############ # # # # ### ## # # # # # # # ## # # # # # # # # ## # # # ### # ### # # ## ## ###### ############### ## # # #### #### # # # # # ## # # # ## #### # # # # # # # ######### # # # ##### # # ######## # # #### ## # # # # # # # # # # ## ###### ## ## ## # ## # # ## # ########## # # # # # ### # # # # # # # #### # # ## # # ## ## ## # ## # # ### # ### ## # # ### ## ## # # # # ## ### # # # ### # # # # # # # # # # ## ## # ###### # ### # ############# # ## ### # # # # # # # ## # # # # # # # # ###### # # # # # ## ### # # # # # #### ### # # ### ## ###### ## ## # ### # ##### # # # # # ##### # ################ ### # # ## # # # # # # # # # # # # ### ## # # # # # # # # # # # # # # # # # # # # # # ## # # # # ### #### # # # # ##### ## # # # # # # # ## # # ###### ## # ## # # # # ########### # # # # # # # # # # ## # # ### # # # # # # # # # # # ### # # # ######## # # # # # # # # # # # # # # # # # # # # # # # # # # # # # # # # # # # # ## # # # # # # #### # # # # # # ## # # # # # # # # # # # # # ### ### # # # # ### # ## # ## # # ### # # # ######### ### # # # # # ## # ### # # # # # ### # # ## # # # # # # # #### # # # # # # # ## # # ###### # # # # # # # # # ## ## # # ## ## ##### # # # ### # # # ## # # ## # ########### ### ## # # # # # # ### # # # # # # # # # # ## # # # # # # ## # # # ## # # # ## # # # # S R S R S R S R S R " " " " " " " " " " " " " " " " " " " " " " " " " " " " " " " " " " " " " " " " " " " " " " " "" " " " " "" " " " " " " " " " " " " " " " " " " " " " " " " " " " " " " " " " " " " " " " " " " " " " " " " " " " " " " " " " " " " " " " " " " " " " " " " " " " " " " " " " " " " " " " " "" " " " " " " "" " " " " " " " " " " " " " " " " " " " " " " " " " " " " " " " " " " " " " " " " "" " " " " " " " " " " " " " " " " " " "" " " " " " " " " " " " " " " " " " " " " " " " " " " " " " " " " " " " " " " "" " " " "" " " " " " " " " " " " " " " """" "" " """" " " " " " " " " " " " " " " " " " " " " " " " " " " " " " " " "" " " " "" " " " " " " " " " " " " " "" " " " " " " " " " " " " " " " " " " " " " " " " """ " " " " " " " " " " " " " " " " " " "" " " " " " " " " " " " " " " " " " " " " " " " " " " "" " " " " " " " " " " " " " " " " " " " " " " " " " " " " " " " " " " " " " " " " " " " " " " " " " " " " " " " " " " " " " " " " " " "" " " " " " " " " " " " " " " " " " "" " " " " " """ " " " " " " " " " " " " "" " " " " " " " " " " " " " " " " " " " " " " " " " " " " " " " " " " " " " " " " " " " " " " " " " " " " " " " "" " " " " " " " " " " " " " " " " " " " " " " " " " " " " " " " " " " " " "" " " " " " " " "" " " " " " " " " " " " " " " " " " " " " " " " " " " " "" " " " " " " " " " " " " " " " " " " " " " " " " " " " "" " " " " " " " " " " " " " " " " " " " " "" " " " " " " " " " " " " " " " " " " " " " " " " " " " " " " " " " " " " " " " " " " " " " " " " " " " " " " " " " " " " " " " " " " " " " " " " " """ " " " " " " " " " " " "" " " " " " " " " " " " " " " " " " " " " " " " " " " " " " " " " " " " " " " " " " " " " " " " " " " " " " " " " " " " " " " " "" " " " " " " " " " " " " " " " " " " " " " " " "" " " " " " " " " " " " " " " " " " " " " " " " " """" " " " " " " " " " " " " " " " "" " " " " " " " " " " " " " " " " " " " " " " " " " " " " " " " " " " " " " " " " " " " " " " "" " " " " "" " " " " "" " " " "" " " " " " " " " " " " " " " " " " " " " " " " " " " " " " " """ " " " " "" " " " " " " " " " " " " " " " " " " " " " "" " " " " " " " " " " " " " " " " " " " " " " " " " " "" " " " " " " " " " " " " " " " " " " " " " " " " " " " " " " " " " " " " " " " " " " " " " " " " " " " " " " " " " " " " " " " " " " " " " " " " " "" " " " " " " " " " " " " " " " " " " " " " " " " " " " " " " " " " " " " " " " " " " " " """"" " " " " " " " " " " " " " " " " " " " " " " " " " " " " " " " " " " " " " " " " " " " " " " " " " "" " " " " " " " " " " " " " " " """ " " " " " " " " " " " " " " " " " " " " " " " " " " " " " " " "" " " " " " " " " " " " " " " " " " " " " " " " " " " " " " " " " " " " " " " " " " " " " " " " """ " " " " " " " " " " " " " " " " " " " " " " " " " " " " " " " " " " " " # # # #### # # # # # # # # # # # # # # # # # # # # # # # # # # # # # # # # # # # # # # # # # # # # # # # # # # # # # # # # # # # # # # # # # # # # # # # # # # # # # ## ## # # # # # ## ## # # # # # # # ## # # # # # # # # # # # # # # # # # # ## # # # # ## # # # # # # # # # # # # # # # ## # # # # # # # # # # # # # # # # # # # # # # # # # # # # # # # # # # # ## # # # # # # # # # # # # # # # # ## # # # # # # # # # ### # # # # # # # # # # # # # # # # # # # # # # # # # # # # # # ## # # # # # # # # # # # # # # # # # # # # # # # # # # # # # # # # # # # # # # # # # # # # # # # # # # # # # ### # # # # # # # # # # # # # # # ## ## # # ##### # # # # # # # # # # # # # # # # # # # # # # # # # # # # # # ## # # # # # # # ## # # # # # # # # # # # # # # # # # # ## # # # # # # ## # # # # # # ## # # # # # # # # # # # # # # # # # # # # # # # # # # # # # # # # # # # # # # # # # # # # # # # # # # ## # # # # # ## # # # # # # # # # # # # # # # # # # # # # # # # # # # # # # # # # # # # # ## # # # # # # ## # ##### # # # # # # # # # # # ## ## # # # # # # # # # # # # # ## # # # # # # # # # # # # ## # # # # # # # # # # # # # # # # # # ## # # # # # # # # # # # # # # # # # # # # # # # # # # # # # # # # # # # # # # # # # # # # # # # # # # # # ## # # # # # # # # # # # # # # # # # # # ## # # ## # ## # # # # # ## # # # # # # # # # # # # # # # # # ## # # # # # # ## # # # # # # # # # # # # # # # # # # # # # ### # # # # ### #### # # # # ###### # #### # # # # # ## # ##### # # # # # # # # # # # # # # # ## # # ## # # ## # # ### # # # # # ## # ## # # # # # # # # # ## # # # # # # # ### # # # # # # # # # # # # # # ## # # # # # # # # # ### # # # # # # # # # # # # # # # ## # # # # # # # # # # # # ### # # # # # # # # # # # # # # # # # ## # # # # # ## # # # # # # # # # # # # # # # # # # # # # ## # # # # # # # # # # # # # # # # # # # ## # # # ## ## # # ## ## # # # # # # # # # ## # # # # ## # # # # # # # # # # # # # # # # # # # # # # # # ## # # # # # # # # # # # # # # # # # # # # # # # # # # # # # # # # # # # # # # ## # # # # # # ### # # # # # # # # # # # # # # # ## # # # # # # # # # # # # # ## # # # # # # # # # # # # # # # # # # # # # # # # # # # # ### # # # # # # # # # # # # # # # # # # # # # # # # # # # # # # # # # # # # # ## # # # # # # # # # # # # # # # # # # # # # # # # # # # # # # # # # # ## # # # # # # # # # # # # # # # # # # ## # # # # # ##### # # # # # ### # # # # ## # # # # # # # # # # # # # # # # # # # # # # # # ## # # # # # # # # ## # # # # # # # # # # # # # # # # # # # # # # # # # # # # # # # # # # # # # # # # # # # # # # # # # # # ## # # # # # # # # # # # # # # # # # # # # # # # # # # # # # # # # # # # # # # # ## # # # # ## # # # # # # # # # # # # # # ## # # ## # # # # ## # # # ## # # # # # # # ## # # # # # # # # # # # # # # # # # # # # # # # # # # # # # # # # # # # # # # # # # # # ## # # # # # # # # # # # # # # # # # # # ## # # # # # ## # # # # # # # # # # # # # # # # # # # # # # # # # # # # # # # # # # # # # # # # # # # # # # # # # # # # # # # # # # # # # # # # ### # # # # # # # # # # # # #
±
Sebitoli chimpanzee presence and home range
Landscape elements Forested area Hydrographic system Eucalyptus plantations Tea plantations Tarmac road Houses/Tea shades S R Tea factories 0 450 900 1 800Meters
# Direct observations - 1570 points " Vocalizations - 1401 points
Feces - 481 points
Chimpanzee presence (3452 points)
Sebitoli Chimpanzee Home Range (25,74 km2) Author: S.Bortolamiol, 2013. Sources: Spot image (2,5 m - color, ortho, 28/11/2008), Projet pour la Conservation des Grands Singes (PCGS).
#
Chimpanzee home range
Sebitoli Chimpanzee home range remodeled (22,57 km2) Other land uses
(gardens, bushes, cattle field)
Considering that Sebitoli chimpanzee community counts about 100 individuals at this stage of habituation, we estimate chimpanzee
densi-ty at 4,4 individuals/km2 which is very close to the highest chimpanzee
den-sity known in the world (5,1 individual/km2 - Potts 2009).
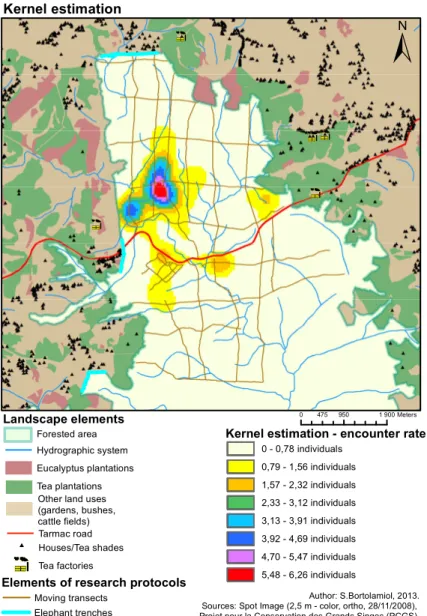
Figure 5. Kernel estimation of most frequented areas of Sebitoli chimpanzee home range.
Kernel density estimator highlights that chimpanzees are concen-trate up to 6,26 i/km² in a small patch on the western side of northern
S R S R S R S R S R
±
Kernel estimation Landscape elementsElements of research protocols
Forested area Hydrographic system Eucalyptus plantations Tea plantations Tarmac road Houses/Tea shades S R Tea factories
Moving transects Author: S.Bortolamiol, 2013.
Sources: Spot Image (2,5 m - color, ortho, 28/11/2008), Projet pour la Conservation des Grands Singes (PCGS).
0 475 950 1 900Meters
Elephant trenches
#
Kernel estimation - encounter rate
0 - 0,78 individuals 0,79 - 1,56 individuals 1,57 - 2,32 individuals 2,33 - 3,12 individuals 3,13 - 3,91 individuals 3,92 - 4,69 individuals 4,70 - 5,47 individuals 5,48 - 6,26 individuals Other land uses
(gardens, bushes, cattle fields)
compartment of the forest. This area has a heterogeneous land-cover
(Fig-ure 3), associated with herbaceous and ligneous feeding species (Section 3.3.2). This area is close to the edge, which is less human-populated and
mainly covered with gardens, bushes and cattle-field.
3.3.2. Modeling Chimpanzee Repartition Within a Grid Cell
Maxent used the set of data gathered in the grid cell and attributes values to each pixel corresponding to chimpanzee presence probability. Most pixels of Maxent model correspond to a medium probability of chim-panzee presence (N=396+273).
The Area Under the Curve (AUC) value of Maxent model (AUC=0,800, maximum = 1) was relevant (above 0, 75, Fielding et al. 1997).
The more contributive variables to Maxent model are: distance to the road (30.1%), the edge (14.6%), the river (13.4%) and mean altitude (13.7%). This confirms that chimpanzee repartition is largely influenced by spatial variables.
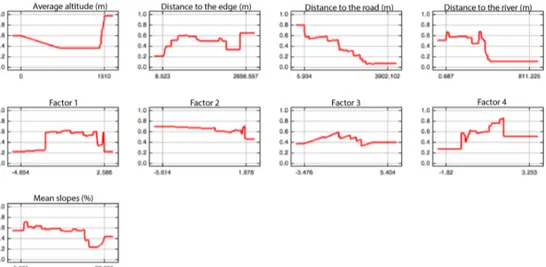
Figure 6. Response curves of environmental variables to Maxent model.
Figure 6 shows to what extent each environmental variable affects
Maxent prediction. Abscissa axis corresponds to the probability of presence of chimpanzee while ordinate axis corresponds to the range of each value. We can identify favoring, unfavoring or variable effect environmental fac-tors influencing chimpanzee repartition.
- Favoring factors:
There are high probabilities of observing chimpanzees at high eleva-tion (up to 1510 m), as well as when mature forest and regeneraeleva-tion forest (F1+) or degraded and regeneration forest are associated (F2+).
- Unfavoring factors:
The more distance to the road or to the rivers increase, the less we have chances to meet chimpanzees. It is the same when slopes are between 23 to 28%, and when herbaceous and degraded forest are combined in the same area (F1-).
- Variable effect factors:
Depending on local factors, distance to the edge can favor chimpan-zee presence. The habitat factors 3 (humid areas) and 4 (herbaceous and mature forest) apparently influenced the presence probability beyond some thresholds.
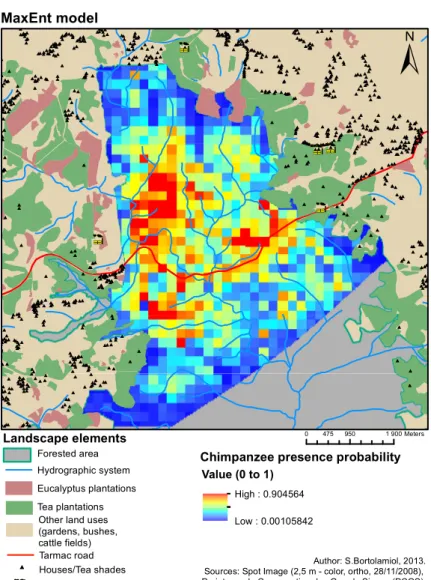
Figure 7. Maxent model
#### # # # # ## # ## # # # # # # # # # # # # # # # # # #### ### # # # # # # ####### # # # # # # # ## ## ## # # # # # ## # # # # # # # # # # # # # # # # # # #### ## # # ## # ## # # # ##### # # # # # ## # # ## # # ## # ###### ### # # # # # # # ### ## # # # # ### ## # # # # # # # ## # # # # ## # # ## # # # ### # ### # # ## ## ##### # ################### #### #### # # # # # ## # # # ## #### # # # # # # # ###### ### # ## ##### # # # ####### # # #### ## # # # # # # # # # # ## ###### ## ## ## # ## # # ## # ######### # # # # # # ### # # # # # # # # ## # # # ## # # ## ## ## # # # # # ### # ###### # ### ## ## # # # # ## ## # # # # ### # # # # # # # # # # ## ## # ###### # ### # ############# # ## ### # # # # # # # ## # # # # # ## # ###### # # # # # ## ### # # # # # #### ### # # ### ## ###### ## ## # ###### ### # # # # # ###### ################ ### # # ## # # # # # # # # # # # # ### ## # # # # # # # # # # # # # # # # # # # # # # ## # # # # #### # # # ## # # ##### ## # # # # # # # ## # # ###### ## # # ## # # # ########### # # # # # # # # # ### # # ### # # # # # # # # # # # ### # # # ######## # # # # # # # # # # # # # # # # # # # # # # # # # # # # # # # # # # # # ## # # # # # # #### # # # # # # # # # # # # # # # # # # # # # ### ### ## # # ### # ## # ## # # ### # # # ##### # # # # ## # # # # # # ## # ## ### # # # ### # # ## # # # # # # # #### # # # # # # # ## # # ###### # # # # # # # # # ## ## # # ## ## ##### # # # # ## # # # ## # # ## ############ ### ## # # # # # # ### # # # # # # # # # # ## # # # # # # ## # # # ## # # # ## # # # # S R S R S R S R S R
±
MaxEnt model Landscape elements Forested area Hydrographic system Eucalyptus plantations Tea plantations Tarmac road Houses/Tea shades S R Tea factories Author: S.Bortolamiol, 2013. Sources: Spot Image (2,5 m - color, ortho, 28/11/2008), Projet pour la Conservation des Grands Singes (PCGS).0 475 950 1 900Meters
#
Chimpanzee presence probability
Other land uses (gardens, bushes, cattle fields)
Value (0 to 1) High : 0.904564 Low : 0.00105842
Chimpanzees have high probabilities of being encountered more frequently when they are near the road or forest edges (Figure 7). The cohe-sion of both models –Kernel and Maxent- is verified by a linear correlation
(R2= 0,377; p < 0,0001).
3.3.3 Deducing Interactions Between Wild Animals and Human
Population from a Buffer Analysis
In the 2500m buffer zone around the chimpanzees home range, the most represented land-use is those which gather gardens, with crops, wet-lands and bush (72 %), followed by tea (24%) and eucalyptus (4%) planta-tions. 1505 houses and 4 tea factories have been counted.
Frequency and damages of crop-raid by wild animals can vary in a season in function of crops planted and distance to the forest edge.
From interviews conducted with local communities, chimpanzees are not the most seen and damageable wild animal in people’s gardens. In every interview (N=28), elephants have been cited as the most destroying mammal. Chimpanzees are more rare (N=20) and less damageable than elephants, but they are targeting crops in particular: maize, guava and sug-arcane. We used UWA record book to estimate which villages were seeking more support from UWA rangers.
Figure 8. Number of UWA interventions per village in 2012.
In 2012, UWA rangers took action 67 times, in 40 out of 67 they chased away wild animals in the 3 villages where we conducted interviews (N=57 for elephants, N= 6 for baboons, N= 1 for chimpanzee, N= 1 for buf-faloes, N= 2 times for unknown carnivore animals).
If we consider that the number of intervention is correlated to the number of wildlife incursion into people’s gardens, Sebitoli, the closest to the forest edge, seems to be the village that is mostly suffering from wildlife damages.
It seems that local communities are soliciting UWA interventions more frequently for elephants than for chimpanzees.
#### # # # # ## # ## # # # # # # # # # # # # # # # # # ###### # # # # # # # ####### # # # # # # # # # ## ## # # # # # ### # # # # # # # # # # # # # # # # # #### ## # # ## # ## # # # ##### # # # # # ## # # ## # # ## # ###### ### ############ # # # # ### ## # # # # # # # ## # # # # ## # # ## # # # ### # ### # # ### ## ###### ############### ## # # #### #### # # # # # # ## # # # ## #### # # # # # # # ###### ### # ## ##### # # # ####### # # #### ## # # # # # # # # # # # # # ####### # # ######### ## ## ## # ## # # ## # ########### # # # # # ### # # # # # # # ### # # # ## # # ## ## ## # # # # # ### # ### ## # # ### ## ## # # # # ## ## # # # # ### # ## # # # # # # # ## ## # ###### # ### # ############# # ## ### # # # # # # # ## # # # # # ## # # ##### # # ## # ## ### # # # # # #### ### # # ### ## ###### ## ### ### # ##### # # # # # ###### ##### # ######### # #### # ## # # # ## # # # # # # # ### ## # # # # # # # # # # # # # # # # # # # # # # ## # # # # # ### #### # # # # # #### ## # # # # # # # ## # # ###### ## ### # # # # ########### # # # # # # # # # ### # # ### # # # # # # # # # # # ### # # # ######## # # # # # # # # # # # # # # # # # # # # # # # # # # # # # # # # # # # # ## # # # # # # #### # # # # # # # # # # # # # # # ## # # # # # # ### ### ## # # ## # # # # # # # ### # # ## # ## # # # # # ### # # # ######### ## # # # # # # ## # #### # # # # ### # # ## ## # # # # # #### # # # # # # # ## # # ###### # # # # # # # # # ## # # # # ## # # ## ## ##### # # # ### # # # # # # ## ## ############ ### ## # # # # # # # ## # # # # # # # # # # ## # # # # # # ## # # # ## # # # ## # # # # S R S R S R S R S R
±
UWA interventionsLandscape elements Elements of research protocols
Forested area Hydrographic system Eucalyptus plantations Tea plantations Tarmac road Houses/Tea shades S R Tea factories Moving transects 0 475 950 1 900Meters
Number of UWA interventions Sebitoli
Kihingami Kahangi
Elephant trenches
Author: S.Bortolamiol, 2013. Sources: Spot Image (2,5 m - color, ortho, 28/11/2008), Projet pour le Conservation des Grands Singes (PCGS).
#
Other landuses
(gardens, bushes, cattle fields)
11 18
4. Conclusion
Combining scales, data from different disciplines and spatial analy-sis allow us to better understand local factors that influence Sebitoli chim-panzee community and its high density (4.4 individuals/km²).
While their home range covers most of the protected forest, chim-panzees are concentrated in nucleus where forest-cover is heterogeneous, with a diversity of food resources. The proximity of tarmac road and of river are favoring factors, according to the results of the Maxent model, as well as high elevation areas. Chimpanzees do not avoid forest edges, particularly those connected to high proportion of gardens and plantations, where they may find extra food resources and of surrogate habitats.
Many authors have shown that chimpanzees require optimal envi-ronmental conditions (Turner et al. 2003, Kerr & Ostrovsky 2003), which is not the case of the Sebitoli study area. Nevertheless, other authors insist on the importance of food resource abundance (Potts 2009, Hockings et al. 2009), which is confirmed by our study.
The high density of chimpanzees means that they require a high quantity of food, the main part inside the forest and a complement outside it. Our study have confirmed the importance of distance and spatial pat-terns for the understanding of the interactions between chimpanzees, land-scape and human population. It also gives some keys for a better manage-ment of conservation of nature in an anthropogenic environmanage-ment.
References
Alexandre F, Génin A (2008) Continu et discontinu dans l'espace géographique. PUF, Tours, pp. 444.
Debinski DM, Ray C, Saveraid EH (2001) Species diversity and the scale of the landscape mosaic: do scales of movement and patch size affect diversity? Bi-ol.Cons. 98: 179-190.
Boyle SA, Lourenço WC, Da Silva LR, Smith AT (2009) Home Range Esti-mates Vary with Sample Size and Methods. Folia Primatol. 80: 33–42.
Caldecott J, Miles J (2009) Atlas mondial des grands singes et de leur conserva-tion. UNESCO, Paris. pp. 1-492.
Campbell-Smith G, Campbell-Smith M, Singleton I, Linkie M (2011) Apes in Space: Saving an Imperilled Orangutan Population in Sumatra. PLoS ONE 6 (2): e17210.
Chapman CA, Wrangham R (1993) Range use of the Forest Chimpanzees of Kibale: Implications for the understanding of Chimpanzee social organization. Am.J.Primatol. 31 (4): 263-273.
Chapman CA, Chapman, LJ (1997) Forest regeneration in logged and un-logged forest of Kibale National Park, Uganda. Biotropica, 29 (4): 396-412.
Chapman, CA, Lambert JE (2000) Habitat alteration and the conservation of African primates: case study of Kibale National Park, Uganda. Am. J.Primatol., 50: 169–185.
Dickson BG, Jenness JS, Beier P (2005) Influence of vegetation, topogra-phy, and roads on cougar movement in southern California. J.Wild.Manage. 69: 264-276.
Di Salvo M, Gadais M, Roche-Woillez G (2005) L’estimation de la densité par la méthode du noyau – méthode et outils. Notice analytique commanditée par le Ministère de l’équipement. pp. 26.
Elith J, Phillips SJ, Hastie T, Dudik M, Enchee Y, Yates CJ (2011) A statisti-cal explanation of Maxent for ecologists. Divers.Distrib.17: 43-57.
Fielding A, Bell H, JF (1997) A review of methods for the assessment of prediction errors in conservation presence/absence models. Environ. Conserv. 24: 38–49.
Fortin MJ, Dale MRT, Hoel J (2006) Spatial Analysis in ecology. Encyclop. Environmetrics, pp. 1-380.
Fotheringham AS, Brunsdon C, Charlton M (2000) Qualitative geography - Perspectives on Spatial Data Analysis. Sage, London. pp. 1-270.
Goodall J (1986) The chimpanzees of Gombe: patterns of behaviour. Cambridge: Belknap Press. pp. 1-673.
Grueter C, Li D, Ren B, Wei F (2009) Choice of analytical method can have dramatic effects on primate home range estimates. Primates, 50 (1): 81-84.
Hartter J, Goldman A, Southworth J (2011) Responses by households to resource scarcity and human-wildlife conflict: Issues of fortress conservation and the surrounding agricultural landscape. J. Nature Conserv. 19 (2): 79–86.
Hartter J (2010) Resource use and ecosystem services in a forest landscape. Soc.natural res. 23, 207-223.
Hockings KJ, Anderson JR, Matsuzawa T (2009) Use of Wild and Cultivat-ed Foods by Chimpanzees at Bossou, Republic of Guinea: FeCultivat-eding Dynamics in a Human-Influenced Environment. Amer. J.of Primatol., 71: 636-646.
International Union for Conservation of Nature (IUCN). http://www.iucnredlist.org/, consulted 04/14/2013.
Johns BG (1996) Responses of chimpanzees to habituation and tourism in the Kibale forest, Uganda.Biol. Conserve. 78, 257-262.
Junker J, Blake S, Boesch C, Campbell G, Du Toit L, , Duvall C, Ekobo A, Etoga G, Galat-Luong A, Gamys J, Ganas-Swaray J, Gatti S, Ghiurghi A, Granier N, Hart J, Head J, Herbinger I, Cleveland Hicks T, Huijbregts B, Imong IS, Kuempel N, Lahm S, Lindsell J, Maisels F, McLennan M, Martinez L, Morgan B, Morgan D, Mulindahabi F, Mundry R, N’Goran KP, Normand E, Ntongho A, Tiku Okon D, Petre CA, Plumptre A, Rainey H, Regnaut S, Sanz C, Stokes E, Tondossama A, Tranquilli S, Sunderland-Groves J, Walsh P, Warren Y, Williamson EA, Kuehl HS (2012) Recent decline in suitable environmental conditions for African great apes. Div.Distrib. 1-15.
Kerr JT, Ostrovsky M (2003) From space to species: ecological applications for remote sensing. Trends Ecol.Evol., 18 (6): 299-305.
MacKenzie CA, Chapman CA, Sengupta R (2011) Spatial patterns of illegal resource extraction in Kibale National Park,Uganda. Environ. Conserv.39 (1): 38-50.
Mohr CO (1947) Table of equivalent populations of North American mam-mals. Amer.Midland Natur. 37, 223-247.
chimpanzees from the Budongo Forest, Uganda. Afric.J.Ecol.41: 150-156.
Naughton-Treves L, Chapman CA, Wrangham R (1998) Temporal patterns of crop-raiding by primates: linking food availability in croplands and adjacent forest. J.app.Ecol. 35: 596-606.
Phillips SJ, Anderson RP, Schapire RE (2006) Maximum entropy modeling of species geographic distributions. Ecol. Model., 190 (3-4): 231-259.
Potts KB, Chapman CA, Lwanga JS (2009) Floristic heterogeneity between forested sites in Kibale National Park, Uganda: insights into the fine-scale determi-nants of density in a large-bodied frugivorous primate. J. Animal Ecol. 78 (6): 1269–1277.
Steiniger S, Timmins TL, Hunter AJS (2010) Implementation and compar-ison of home range estimators for grizzly bears in Alberta, Canada, based on gps data. Poster, GIScience 2010, 6ème Conf.Int. Sc. Inf.Géogr.,Zurich, Suisse.
Struhsaker TT (1997) Ecology of an African rain forest: logging in Kibale and the conflict between conservation and exploitation. Gainesville: Univ.Florida Press. pp. 1-432.
Turner W, Sterling EJ, Janetos AC (2001) Introduction. Conserv.Biol.15 (4): 832-834.
Uganda Wildlife Authority (2005) Ground census of mammals in Kibale national park. Rapport scientifique: UWA Monitoring and research Unit – Kibale. pp. 19.
Wrangham R (1996) Ecology and social relationships in two species of chimpanzee. Ecological Aspects of Social Evolution. D. I. Rubenstein and R. Wrangham. Princeton, New Jersey, Princeton University Press: 352-378.
Acknowledgments
Data have been collected thanks to a partnership signed between Museum national of natural history (MNHN – Paris), Uganda Wildlife Authority and Makerere University. We are grateful toward Uganda Wildlife Authority and Uganda National Council for Science and Technology, Makerere Uni-versity, Paris-Diderot UniUni-versity, Pôle Image. Field trips have been granted by Museum national of natural history/ATM 16, ANR JC-JC SAFAPE, Pro-jet pour la Conservation des Grands Singes and Société Francophone de Primatologie. We are particularly grateful to Japan Musinguzi, Ronald Musinguzi, Emmanuel Balinda, Christopher Aliganyira, Deogratius Kyomuhangi, John Tweheyo, Joseph Alinaitwe, Denis Sebugwaho and Ni-colas Kwezi in Uganda for the data collection. Finally, we wish to thank all farmers who were willing to help us in our research.