HAL Id: hal-02440773
https://hal.archives-ouvertes.fr/hal-02440773
Submitted on 15 Jan 2020
HAL is a multi-disciplinary open access
archive for the deposit and dissemination of
sci-entific research documents, whether they are
pub-lished or not. The documents may come from
teaching and research institutions in France or
abroad, or from public or private research centers.
L’archive ouverte pluridisciplinaire HAL, est
destinée au dépôt et à la diffusion de documents
scientifiques de niveau recherche, publiés ou non,
émanant des établissements d’enseignement et de
recherche français ou étrangers, des laboratoires
publics ou privés.
greening of northern vegetation
Xu Lian, Shilong Piao, Laurent Li, Yue Li, Chris Huntingford, Philippe Ciais,
Alessandro Cescatti, Ivan Janssens, Josep Peñuelas, Wolfgang Buermann, et
al.
To cite this version:
Xu Lian, Shilong Piao, Laurent Li, Yue Li, Chris Huntingford, et al.. Summer soil drying exacerbated
by earlier spring greening of northern vegetation. Science Advances , American Association for the
Advancement of Science (AAAS), 2020, 6 (1), pp.eaax0255. �10.1126/sciadv.aax0255�. �hal-02440773�
E N V I R O N M E N T A L S T U D I E S
Summer soil drying exacerbated by earlier spring
greening of northern vegetation
Xu Lian1, Shilong Piao1,2,3*, Laurent Z. X. Li4, Yue Li1, Chris Huntingford5, Philippe Ciais6,
Alessandro Cescatti7, Ivan A. Janssens8, Josep Peñuelas9,10, Wolfgang Buermann11,12,
Anping Chen13, Xiangyi Li1, Ranga B. Myneni14, Xuhui Wang1,6, Yilong Wang6, Yuting Yang15,
Zhenzhong Zeng1, Yongqiang Zhang16, Tim R. McVicar17,18
Earlier vegetation greening under climate change raises evapotranspiration and thus lowers spring soil moisture, yet the extent and magnitude of this water deficit persistence into the following summer remain elusive. We pro-vide observational epro-vidence that increased foliage cover over the Northern Hemisphere, during 1982–2011, triggers an additional soil moisture deficit that is further carried over into summer. Climate model simulations independent-ly support this and attribute the driving process to be larger increases in evapotranspiration than in precipitation. This extra soil drying is projected to amplify the frequency and intensity of summer heatwaves. Most feedbacks operate locally, except for a notable teleconnection where extra moisture transpired over Europe is transported to central Siberia. Model results illustrate that this teleconnection offsets Siberian soil moisture losses from local spring greening. Our results highlight that climate change adaptation planning must account for the extra summer water and heatwave stress inherited from warming-induced earlier greening.
INTRODUCTION
A widespread shift in the phenology of northern vegetation under global warming, toward earlier spring leaf emergence (i.e., earlier spring “greening”), has been unambiguously documented using indices of satellite-monitored vegetation greenness (1–3) and ground observations (4–6). Both modeling and observational studies have shown that the early onset of vegetation phenology causes an increase in ecosystem productivity through an extension of the active carbon uptake peri-od (7, 8). On the other hand, however, there is a growing concern that the earlier vegetation greening may induce soil moisture deficits in late spring through increased evapotranspiration (ET), which may amplify summer droughts and have detrimental effects on summer ecosystems (9–13). Direct observational evidence for this ET-centered legacy hypothesis is nonetheless very scarce. Furthermore, the influence of earlier spring greening on summer soil moisture can be more
com-plex than just by modifying ET. For instance, more rapid spring soil moisture losses raise moisture levels of the atmosphere, facilitate cloud formation, and trigger extra precipitation (14–16). Any additional rainfall may compensate, at least partly, the greening-induced deficit of soil moisture. A further biophysical feedback is that soil moisture deficits result in less conversion of surface incident sunlight into water evaporation. Lower latent heat from the land may suppress the de-velopment of clouds and subsequent precipitation (17, 18). Beyond local effects, these feedback mechanisms may also operate as telecon-nections between locations. Large-scale atmospheric circulation (14, 19) redistributes the extra recycled moisture across the Earth’s land sur-face and contributes to additional precipitation in downwind regions. The overall impact of these potential interseasonal feedbacks on summer water cycles, unfortunately, is still poorly characterized.
Quantifying this vegetation–soil moisture legacy effect must take full account of the complete loop of soil-vegetation-atmosphere ex-changes of water and energy fluxes. Many feedback mechanisms, as summarized in the above paragraph, are essential for accurate assess-ments of global or regional soil moisture changes, yet are ignored by previous studies (9–12). In particular, without characterizing atmo-spheric feedbacks and including those that are interseasonal, it still remains an open question on the extent to which vegetation greening influences summer soil moisture. Here, we first analyze multiple strands of direct observational data to characterize the spring-to-summer vegetation–soil moisture feedbacks. We then perform factorial exper-iments with a state-of-the-art coupled land-atmosphere climate model to better understand the underlying mechanisms.
RESULTS
Observational evidence for summer drying induced by earlier spring greening
To examine spatiotemporal connections between recent spring pheno-logical changes (section S1 and fig. S1) and soil water content (SWC) dynamics in the following summer, we first analyze long-term satellite data of spring leaf area index (LAI; as a proxy for vegetation phenology
1Sino-French Institute for Earth System Science, College of Urban and Environmental Sciences, Peking University, Beijing 100871, China. 2Key Laboratory of Alpine Ecology, Institute of Tibetan Plateau Research, Chinese Academy of Sciences, Beijing 100101, China. 3Center for Excellence in Tibetan Earth Science, Chinese Academy of Sciences, Beijing 100085, China. 4Laboratoire de Météorologie Dynamique, CNRS, Sorbonne Université, Ecole Normale Supérieure, Ecole Polytechnique, Paris, France. 5Centre for Ecology and Hydrology, Wallingford, Oxfordshire OX10 8BB, UK. 6Laboratoire des Sciences du Climat et de l’Environnement (LSCE), CEA CNRS UVSQ, 91191 Gif Sur Yvette, France. 7European Commission, Joint Research Centre, Directorate for Sustainable Resources, I-21027 Ispra (Varese), Italy. 8Department of Biology, University of Antwerp, Universite-itsplein 1, Wilrijk 2610, Belgium. 9CREAF, Cerdanyola del Valles, Barcelona, Catalonia 08193, Spain. 10CSIC, Global Ecology Unit CREAF-CSIC-UAB, Bellaterra, Barcelona, Catalonia 08193, Spain. 11Institute of the Environment and Sustainability, University of California, Los Angeles, Los Angeles, CA 90095, USA. 12Department of Geography, University of Augsburg, 86159 Augsburg, Germany. 13Department of Forestry and Natural Resources, Purdue University, West Lafayette, IN 46907, USA. 14Department of Earth and Environment, Boston University, Boston, MA 02215, USA. 15State Key Laboratory of Hydro-Science and Engineering, Department of Hydraulic Engineer-ing, Tsinghua University, BeijEngineer-ing, China. 16Key Lab of Water Cycle and Related Land Surface Processes, Institute of Geographic Sciences and Natural Resources Research, Chinese Academy of Sciences, Beijing 100101, China. 17CSIRO Land and Water, Canberra, Australian Capital Territory, Australia. 18Australian Research Council Centre of Excellence for Climate Extremes, Canberra, Australian Capital Territory, Australia.
*Corresponding author. Email: slpiao@pku.edu.cn
Copyright © 2020 The Authors, some rights reserved; exclusive licensee American Association for the Advancement of Science. No claim to original U.S. Government Works. Distributed under a Creative Commons Attribution NonCommercial License 4.0 (CC BY-NC). on January 15, 2020 http://advances.sciencemag.org/ Downloaded from
and growth; Materials and Methods) (20) and summer values of two observation-driven SWC-related datasets for the period of 1982–2011. The two SWC-related data include root-zone soil moisture from the Global Land Evaporation Amsterdam Model (GLEAM; Materials and Methods) (21) and the long-term reconstruction of terrestrial water storage (TWS) anomalies based on Gravity Recovery and Climate Experiment satellites (GRACE-REC) (22). Our study domain only covers the middle to high latitudes of the Northern Hemisphere (25° to 90°N) because of their distinctive vegetation seasonality and particular-ly pronounced recent changes in springtime LAI phenology (fig. S1). We define spring across the domain as the period from March to May (MAM) and summer as the period from June to August (JJA). We calculate partial correlations between spring LAI and summer SWC (or TWS), whereby covarying effects of summer LAI and climatic variables (i.e., temperature, precipitation, and solar radiation) are controlled for (Materials and Methods). As potential nonlocal pre-cipitation feedbacks modulate the local relationship between spring LAI and summer SWC (14, 19), we also implement a lagged maximum covariance analysis (MCA; Materials and Methods, section S2) (23). This statistical approach isolates pairs of coupled spatial patterns that explain a maximum fraction of the covariance between two space-time data fields (in our case, spring LAI and summer SWC). Hence, the MCA method has obvious advantages over routine correlation analysis that only partially describes covariability between two fields (i.e., spatial correlation using geographical points only or temporal correlation using time series only).
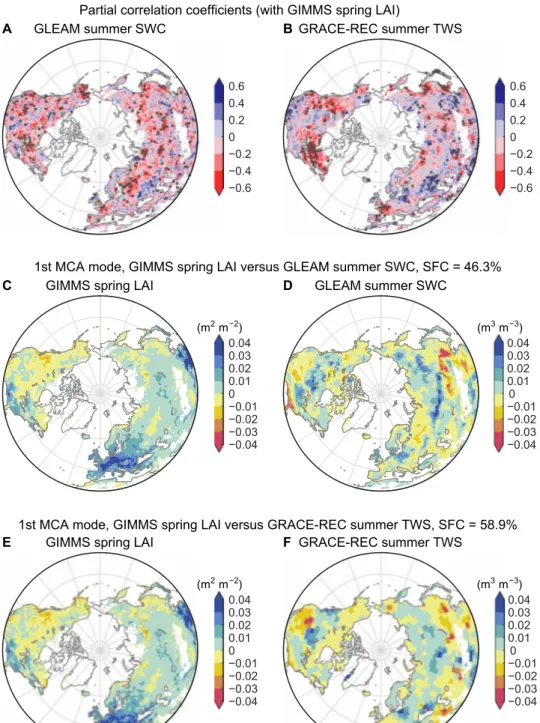
Partial correlations between spring greenness and subsequent sum-mer SWC show a widespread negative pattern across most northern lands (64% of land area for GLEAM SWC and 56% for GRACE-REC TWS) (Fig. 1, A and B), including significantly greening regions of Europe, eastern United States, East Asia, and Siberia (fig. S1). For temperate and semi-arid grasslands where LAI is coupled to shallow moisture, this dominance of negative correlation between spring LAI and summer moisture is additionally supported by using micro-wave-derived summer top-layer soil moisture (fig. S2). The wide-spread negative correlation indicates that, when effects of interannual variations of precipitation are factored out, earlier greening in spring generally results in local soil drying in subsequent summers. On the other side, positive correlation is also apparent over regions including the North China Plain, central and southeastern Europe, and the U.S. Great Plains, especially for TWS that additionally captures storage varia-tions in canopy, snow, streams, lakes, and groundwater (Fig. 1, A and B). Many such regions are influenced by intensive agricultural activities, which potentially decouples the relationship between spring LAI and summer SWC observed in natural ecosystems. By averag-ing land surface undisturbed by cropland management, we find a negative correlation between spring LAI and summer SWC that is statistically significant (−0.44 for GLEAM SWC and −0.40 for GRACE-REC TWS, P < 0.05) (fig. S3). However, an increasing fraction of land areas affected by croplands leads to a weakening of this negative cor-relation, which shifts robustly to being positive when croplands oc-cupy over 50% of local land areas (fig. S3).
Figure 1 (C to F) presents the leading first MCA mode characterizing spatial patterns of the coupling between spring LAI and summer SWC. This mode, in particular, includes potential nonlocal impacts of LAI-induced moisture transport anomalies on SWC at downwind regions. This mode pair explains 46 and 59% of the total squared covariance between the two variables for GLEAM SWC and GRACE-REC TWS, respectively. For both SWC-related products, the first
spring LAI mode shows widespread positive anomalies (i.e., earlier greening) in the majority of the Eurasia (>80%) and eastern United States, while negative anomalies (i.e., delayed greening, also known as browning) cover vast areas of central and western North America (Fig. 1,C and E). The patterns of the leading LAI mode generally resemble the trend pattern of satellite-observed spring LAI (fig. S1). As a consequence, the leading summer SWC (or TWS) mode (Fig. 1, D and F) coupled to the spring LAI patterns demonstrates a direct response pattern of summer SWC to the emerging spring greening. The MCA-based annual time series linked to the spring LAI and summer SWC (or TWS) pattern are also highly correlated (r = 0.86 for GLEAM SWC and r = 0.80 for GRACE-REC TWS, P < 0.05 for both; fig. S4). This reiterates the strong coupling between the two coupled patterns shown in Fig. 1 (C to F). In general, negative summer SWC anomalies (i.e., soil drying) are preceded by spring greening, whereas positive SWC anomalies (i.e., soil wetting) dominate the western North America with spring browning (Fig. 1, D and F versus C and E). The domi-nance of negative LAI-SWC coupling, as also seen by partial correla-tion patterns, implies an impact of earlier spring onset on local summer soil drying. The cropland-dominated central Europe has wetter summers during years with greener springs (Fig. 1, C to F), which is in agreement with the positive correlation between spring greenness and summer soil moisture (Fig. 1, A and B). A notable exception occurs in the Siberia region, where summer SWC increases despite the presence of a clear positive spring LAI anomaly and limited human interventions. This is also in sharp contrast to the negative partial correlations in central Siberia after removing covarying effects of cipitation (Fig. 1, A and B). Such difference implies that altered pre-cipitation patterns driven by spring LAI changes cause extra moisture to be brought into this area.
Simulating the spring-to-summer vegetation feedbacks Statistical analyses of observation-based data show that summertime soil moisture anomalies negatively co-vary with the preceding spring greening patterns. However, the detection of systematic legacy ef-fects of spring LAI on summer soil moisture within data is partially affected by noise from weather variability, potential nonlinearity in soil moisture responses, different rooting depth and moisture access across ecosystems, and slowly varying drivers of both LAI and soil moisture trends such as vapor pressure deficit and rising atmospheric CO2. To confirm a causal link between spring greening and summer soil drying, and to better understand the local and nonlocal mecha-nisms, we perform further analyses using the IPSL-CM4 coupled land-atmosphere global climate model (GCM; Materials and Methods) (24). Coupled land-atmosphere models explicitly describe biophys-ical interactions between the land surface and the atmosphere. This includes local exchanges of water and energy fluxes and large-scale changes of atmospheric circulation and moisture convergence. Paired time-evolving (i.e., transient) numerical experiments are run with the land surface component of IPSL-CM4, ORCHIDEE (Organizing Car-bon and Hydrology In Dynamic Ecosystems; Materials and Methods), forced with two contrasting spring LAI conditions. One set of sim-ulations (labeled as “ LAI obsMAM ”) is prescribed with annually varying LAI from satellite observations (20) during all seasons, including MAM. The second set of simulations (labeled as “ LAI climMAM ”) is also prescribed with annually varying LAI during all seasons, except in MAM when it is fixed to the climatological mean LAI conditions observed during 1982–2011 (Materials and Methods). Apart from the spring LAI differences, the two model experiments are forced
on January 15, 2020
http://advances.sciencemag.org/
identically with observed boundary conditions of sea-surface temperature (SST), sea-ice fraction (SIF), and atmospheric CO2 concentration. This enables us to account for the vegetation bio-physical feedbacks stemming from interactions with changes in oceanic processes or CO2 radiative/physiological forcings. Multimember paired ensembles are generated for each coupled model experiment by performing 30 repeated runs but with different initial conditions (Materials and Methods).
Model evaluation against global observational datasets supports the capacity of the IPSL-CM4 GCM to capture the annual and sea-sonal features of key hydrological variables, including ET and pre-cipitation (fig. S5, A and B; further details in section S3). To avoid systematic biases from the diverging magnitude of modeled and observation-based SWC, SWC changes are instead compared as the fraction of the present-day climatological mean (1982–2011) (25). At the scale of the Northern Hemisphere (25° to 90°N), the IPSL-simulated
A GLEAM summer SWC −0.6 −0.4 −0.2 0 0.2 0.4 0.6 B GRACE-REC summer TWS
Partial correlation coefficients (with GIMMS spring LAI)
−0.6 −0.4 −0.2 0 0.2 0.4 0.6
C GIMMS spring LAI
−0.04 −0.03 −0.02 −0.01 0 0.01 0.02 0.03 0.04 (m2 m−2) D GLEAM summer SWC
1st MCA mode, GIMMS spring LAI versus GLEAM summer SWC, SFC = 46.3%
−0.04 −0.03 −0.02 −0.010 0.01 0.02 0.03 0.04 (m3 m−3)
E GIMMS spring LAI
−0.04 −0.03 −0.02 −0.01 0 0.01 0.02 0.03 0.04 (m2 m−2) F GRACE-REC summer TWS
1st MCA mode, GIMMS spring LAI versus GRACE-REC summer TWS, SFC = 58.9%
−0.04 −0.03 −0.02 −0.010 0.01 0.02 0.03 0.04 (m3 m−3)
Fig. 1. Coupling between observed spring LAI and summer SWC during 1982–2011. Spatial pattern of partial correlation coefficients between Global Inventory
Monitoring and Modeling Studies (GIMMS) spring LAI and (A) GLEAM summer SWC or (B) GRACE-REC summer TWS for 1982–2011. Black stipples indicate regions with a statistically significant correlation (P < 0.05). Heterogeneous regression maps of (C and E) GIMMS spring LAI and (D and F) GLEAM summer SWC (or GRACE-REC summer TWS), associated with the first MCA mode for 1982–2011. The squared fractional covariance (SFC) explained by the first MCA mode is 46.3 and 58.9% for the GLEAM and GRACE-REC datasets, respectively.
on January 15, 2020
http://advances.sciencemag.org/
SWC shows a negative trend, whereas GLEAM SWC shows a weaker positive trend (fig. S5C). While this sign difference is possibly a concern for global mean changes, we find zonally coherent patterns of the IPSL-simulated SWC trend compared to GLEAM SWC (fig. S5, D to I). The IPSL-simulated SWC broadly captures regions where soil wetting or drying occurs, at both annual and seasonal time scales (fig. S5, D to I). This regional consistency strengthens our confidence in examining both the observed zonally different fingerprint of spring greening on summer soil moisture and the ability of our GCM to ex-plain such changes.
The difference between the two factorial simulations with vari-able and fixed spring LAI ( LAI obsMAM − LAI
clim
MAM ) allows us to isolate the fingerprint of observed spring LAI changes on summer soil moisture (SWC) and other important hydrological variables. The symbol “” hereafter denotes the influence of spring LAI changes on other target variables of interest. Our factorial model simulations
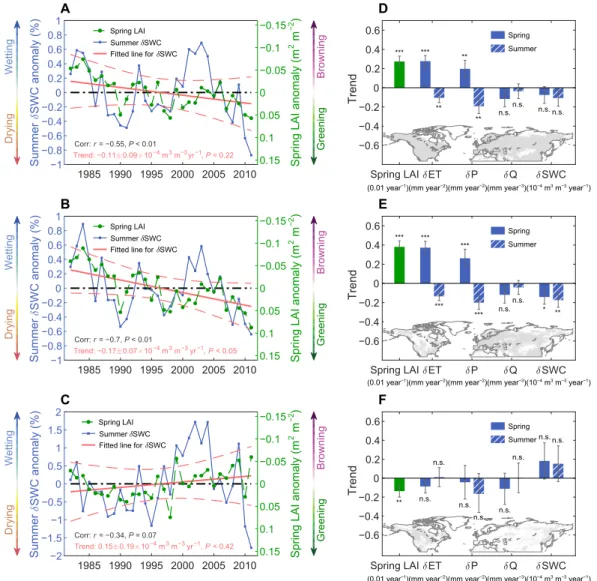
con-firm a strong coupling between spring LAI and summer SWC anomalies (r = −0.51, P < 0.01) (Fig. 2A). Hence, on a year-to-year basis, the observed higher spring LAI values prescribed to our GCM cor-respond to lower summer SWC estimates. We then examine whether there is a robust overall trend of decreasing SWC, driven by the significantly increasing spring LAI (greening). This effect is more difficult to detect because the interannual trend of LAI over the past 30 years is smaller than concurrent climate-driven variabilities. Aver-age summer SWC across all the northern lands (25° to 90°N) tends to decrease at a rate of −0.11 ± 0.09 × 10⁻⁴ m3 m−3 year−1 (linear trend: mean ± 1 SD, P = 0.22) due to the spring LAI changes. This overall summer SWC trend is negative, in line with our hypothesis that higher green foliage cover is transpiring more in spring and leaving soils drier in summer. The calculated trend is not statistically significant, partly due to the presence of contrasting effects on summer SWC in regions with spring greening (i.e., positive LAI trends) versus spring
1985 1990 1995 2000 2005 2010 −1 −0.8 −0.6 −0.4 −0.20 0.2 0.4 0.6 0.81 SWC anomaly (%) Corr: r = −0.55, P < 0.01 Trend: −0.11 0.09 10−4 m3 m−3 yr−1, P = 0.22 Spring LAI Summer SWC Fitted line for SWC
A 0.15 0.1 0.05 0 −0.05 −0.1 −0.15
Spring LAI anomaly (m
2 m −2) Greening Browning Drying Wetting Spring LAI ET P Q SWC −0.6 −0.4 −0.2 0 0.2 0.4 0.6 Trend *** *** ** ** ** n.s. n.s. n.s. n.s.
(0.01 year−1)(mm year−2)(mm year−2)(mm year−3)(10−4 m3 m−3 year−1)
(0.01 year−1)(mm year−2)(mm year−2)(mm year−3)(10−4 m3 m−3 year−1)
(0.01 year−1)(mm year−2)(mm year−2)(mm year−3)(10−4 m3 m−3 year−1) Spring Summer D 1985 1990 1995 2000 2005 2010 −1 −0.8 −0.6 −0.4 −0.2 0 0.2 0.4 0.6 0.8 1 SWC anomaly (%) Corr: r = −0.7, P < 0.01 Trend: −0.17 0.07 10−4 m3 m−3 yr−1, P < 0.05 Spring LAI Summer SWC Fitted line for SWC
B 0.15 0.1 0.05 0 −0.05 −0.1 −0.15
Spring LAI anomaly (m
2 m −2) Greening Browning Drying Wetting Spring LAI ET P Q SWC −0.6 −0.4 −0.2 0 0.2 0.4 0.6 Trend *** *** *** *** *** n.s. n.s. * ** Spring Summer E 1985 1990 1995 2000 2005 2010 −2 −1.5 −1 −0.5 0 0.5 1 1.5 2 SWC anomaly (%) Corr: r = −0.34, P = 0.07 Spring LAI Summer SWC Fitted line for SWC
C 0.15 0.1 0.05 0 −0.05 −0.1 −0.15
Spring LAI anomaly (m
2 m −2) Greening Browning Drying Wetting Spring LAI ET P Q SWC −0.6 −0.4 −0.2 0 0.2 0.4 0.6 Trend ** n.s. n.s. n.s. n.s. n.s. n.s. n.s. Spring Summer F n.s. n.s. Summer Summer Summer Trend: 0.15 0.19 10−4 m3 m−3 yr−1, P < 0.42
Fig. 2. IPSL-simulated changes in summer soil moisture induced by spring LAI changes. (A to C) Interannual anomalies of the area-weighted average of spring LAI
(green dotted lines) and summer SWC (blue solid lines) for (A) all northern latitudes (25° to 90°N), (B) regions with positive LAI trends (i.e., greening), and (C) regions with negative LAI trends (i.e., browning). The red lines indicate the least-squares linear regression of GCM-based SWC (straight lines) against time and the 95% confidence intervals (curves). Note that the right axes are reversed, so higher LAI values are toward the bottom of the plots. (D to F) Interannual trends in mean spring LAI and resultant changes in the spring and summer hydrological variables of ET, precipitation (P), runoff (Q), and SWC. The subplot maps at the bottom of each main panel display the corresponding averaged areas as gray [corresponding to (A) to (C)]. ***P < 0.01; **P < 0.05; *P < 0.1; n.s., P > 0.1.
on January 15, 2020
http://advances.sciencemag.org/
browning (i.e., negative LAI trends). When instead considering only regions where spring LAI generally increases, a statistically significant and much stronger summer drying trend in summer SWC (−0.17 ± 0.07 × 10⁻⁴ m3 m−3 year−1, P < 0.05) is detected (Fig. 2B). On aver-age, including areas with spring browning, this decreasing trend of summer SWC associated with spring LAI changes contributes an additional 16% to the simulated decrease in summer SWC directly caused by climate change during 1982–2011 (overall decrease, −0.68 × 10⁻⁴ m3 m−3 year−1 from the LAI obsMAM simulation).
We also perform the MCA analysis on observed spring LAI- and IPSL-simulated summer SWC (from simulation LAI obsMAM ). The cou-pling patterns between spring LAI and summer SWC for the first mode (fig. S6, A and B) show high accordance with those purely based on observations (Fig. 1, C to F), confirming the ability of our GCM to simulate the interseasonal vegetation–soil moisture feedbacks. We further test whether insights based on our GCM-based factorial simulations could be overly influenced by water-stressed regions at low latitudes. In doing so, we calculate spring LAI and summer SWC anomalies weighted by both area and annual mean soil moisture values. Again, a significant negative correlation is found between spring LAI and summer SWC (fig. S6, C and D). This spring LAI-induced drying trend of summer SWC (−0.09 ± 0.06 × 10⁻⁴ m3 m−3 year−1) is consistent with that without assigning a lower weight to drier regions (Fig. 2A), partly because earlier greening mainly occurs in regions with favorable moisture conditions. Therefore, our GCM simulations provide robust process-based evidence that the observed overall earlier greening of northern land causes extra decreases in summer soil moisture.
Intra- and interseasonal soil moisture anomalies are determined by the balance between changes in ET, precipitation, and runoff (schematic, Fig. 3). To gain more insights into how spring vegetation changes feedback on soil moisture, we further use the paired GCM experi-ments to examine changes in these major hydrological fluxes. High-er spring LAI levels tend to accelHigh-erate watHigh-er recycling from the land surface to the atmosphere through enhanced plant transpiration. As transpiration dominates total terrestrial ET (average transpiration/ ET ratio of IPSL-CM4: 0.47 for spring and 0.76 for summer) (26), a higher spring transpiration directly leads to higher modeled spring ET (+0.28 ± 0.06 mm year−2, P < 0.01) (Fig. 2D). We also note that the overall trend of IPSL-simulated spring ET is not statistically sig-nificant (P > 0.05), which is confirmed by two observation-based ET products (fig. S5A). This is mainly because the significant ET increase in regions with spring greening is compensated by the ET decrease in regions with spring browning when integrated to the hemispheric scale (fig. S7). For this greening-enhanced ET, however, only a pro-portion (71%) is subsequently recycled as additional land precipitation during MAM (0.20 ± 0.09 mm year−2, P < 0.01) (Fig. 2D). During MAM, this imbalance between increasing precipitation and ET due to earlier phenology and LAI development results in a decreasing trend in both soil moisture (−0.11 ± 0.09 × 10⁻⁴ m3 m−3 year−1) and surface runoff (−0.08 ± 0.09 mm year−2). The larger increase in ET than in precipitation is much more pronounced when considering only regions with spring greening, where it causes a strong signal of soil drying (Fig. 2, B and E). However, in regions with spring browning, there is a stronger decrease in ET than in precipitation, thus causing soil wetting (Fig. 2, C and F). These contrasting responses, where ET changes do not balance precipitation changes, suggest a geograph-ical redistribution of the extra atmospheric water vapor from
re-gions with earlier greening, toward rere-gions with browning, within the springtime.
Our factorial model simulations allow further investigation of the soil moisture legacy effects into the summer following a spring with altered phenology and hydrology. We find that the spring soil mois-ture deficit caused by earlier greening is carried over into the summer months (Fig. 2D, blue bars). The interseasonal soil moisture mem-ory propagates this moisture deficit forward, and this also involves additional contribution of soil moisture–atmosphere biophysical feed-backs. Given the short memory of days to weeks of the atmosphere, the atmospheric moisture anomaly from earlier greening is dissipat-ed mainly in the springtime through extra spring rainfall (Fig. 2D). The lower soil moisture levels in late spring due to a prolonged period of stronger decrease and insufficient rainfall resupply become less ac-cessible for plant root uptake and soil evaporation (27), particularly in climatologically water-stressed regimes. Hence, summer ET decreases substantially across the entire study area (−0.10 ± 0.05 mm year−2), and summer P (precipitation) decreases even more (−0.19 ± 0.08 mm year−2), leading to a slightly strengthened decreasing trend in summer SWC (−0.11 ± 0.09 × 10⁻⁴ m3 m−3 year−1) (Fig. 2D). This summer drying signal is larger and statistically significant in areas with extra spring greening (Fig. 2E). The significantly decreasing spring LAI (P < 0.05) in areas with spring browning do not, however, generate significant changes in any of the hydrological fluxes in summer (i.e., ET, P, run-off, and SWC; all P > 0.1) (blue bars in Fig. 2F). In these browning regions, soil moisture anomalies in spring have little impact on sub-sequent summer water recycling (ET ≈ 0) and hence summer rain-fall feedbacks. It is noteworthy that both spring greening and browning tend to decrease the amount of summer precipitation (Fig. 2, E and F). This implies that the current spring LAI levels may have evolved to be an optimum that maximizes the precipitation retained on con-tinents in the subsequent summer season.
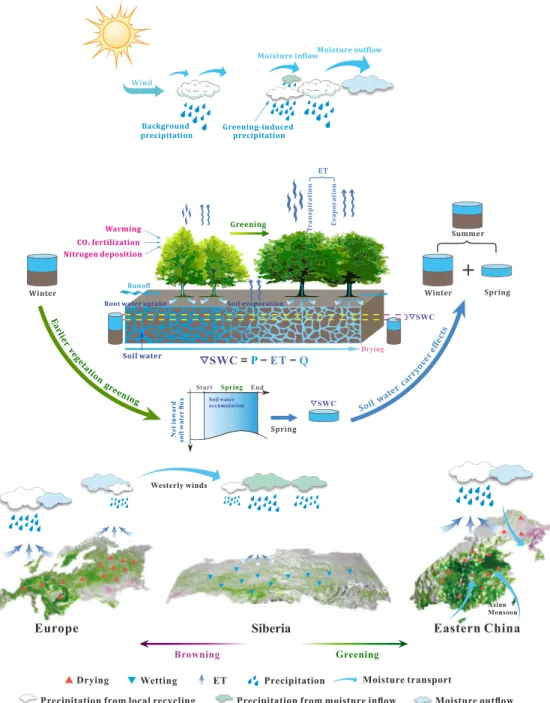
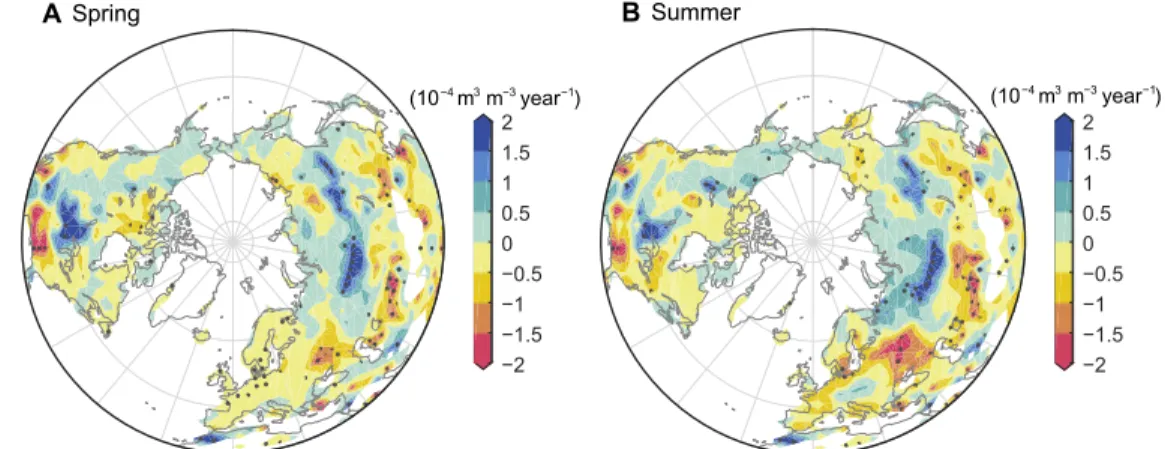
We further investigated the spatial pattern of the GCM-derived soil moisture trend in SWC (Fig. 4; other hydrological fluxes in fig. S8). In general, the modeled summer SWC pattern and observed summer SWC anomalies associated with the first MCA mode (Fig. 1, D and F) are highly similar, providing mechanistic support for our observation-based findings. Besides, the summer SWC pattern closely resembles the spring SWC pattern (Fig. 4B versus Fig. 4A), implying the dominant role of soil moisture memory in carrying this greening-induced water deficit into the summer. Areas with the high-est rates of summer drying (>0.1 × 10⁻³ m3 m−3 year−1) occur main-ly in Europe, eastern Asia, western Asia, and eastern North America (Fig. 4B), where pronounced advances of vegetation greening occur during spring (fig. S1). Conversely, a summer wetting trend of soil moisture dominates regions with spring browning, such as central and northwestern North America (Fig. 4B versus fig. S1). One nota-ble exception is again the central Siberian regions, where a strong modeled soil wetting trend occurs in both spring and summer (>0.05 × 10⁻³ m3 m−3 year−1) (Fig. 4), despite the presence of a clear spring greening tendency there that generally lowers summer soil moisture elsewhere (Fig. 4 and fig. S1). The GCM simulations show that this trend of regional wetting in Siberia is caused by different mechanisms in the two seasons. In spring, the extra water vapor recycled into the atmosphere in upstream regions (Europe) with strong greening is carried to Siberia by westerly winds (fig. S9A). This imported extra precipitation moistens local soils and offsets the soil moisture deficit originated from local spring greening (schematic, Fig. 3). During the following summer, when the prevailing westerly winds become weaker
on January 15, 2020
http://advances.sciencemag.org/
(fig. S9B), the Siberian region operates as a more closed system with intensified local water recycling (fig. S8). Consequently, the imported extra soil moisture in springtime helps to sustain local positive feedbacks on summer precipitation and is ultimately retained in the Siberian soils throughout the boreal summer. This additional sum-mer wetting from the earlier greening of local and remote regions, in total, accounts for over 90% of the overall summer soil wetting trend derived from LAI obsMAM , showing its much more impor tant role for Siberia than the ongoing climate change.
Implications for near-surface land climate in summer Lower soil moisture can trigger the occurrence, or amplify the fre-quency and intensity of heatwaves, by altering the surface energy bal-ance (17, 28, 29). Our finding that earlier greening preconditions summer soils to be drier thus implies a shift in the distribution of summer surface air temperature toward even more hot extremes, adding to the warming-induced increase in extreme occurrence. To verify this mechanism with our paired GCM simulations, we calculate two ex-treme hot temperature indices (30): (i) the summer maximum of daily SWC = − P ET −Q SWC Drying Ne t inward soil wate r flu x Start End Soil water accumulation Spring SWC Greening Browning
Drying Wetting ET Precipitation Moisture transport
Westerly winds
Europe Siberia Eastern China
Asian Monsoon
Precipitation from local recycling Precipitation from moisture inflow Moisture outflow
Fig. 3. Schematic of the effect of earlier greening on summer soil moisture. Earlier spring greening influences spring soil moisture by altering land-atmosphere water
exchanges (via ET, P, and Q) and by the redistribution of atmospheric water vapor by atmospheric circulation. This spring soil moisture anomaly persists later into the following summer due to the carryover effects of soil moisture. The magnitude of this cross-seasonal vegetation feedback and the role of atmospheric circulation, how-ever, vary geographically. Three typical examples of the circulation-modulated vegetation feedback (Europe, Siberia, and eastern China) are displayed at the bottom of the schematic.
on January 15, 2020
http://advances.sciencemag.org/
maximum temperature (TXx) and (ii) the number of summer days with maximum temperatures exceeding the local 90th percentile of a given base period, here as 1982–2011 (TX90p) (see Materials and Methods). We find that earlier spring greening increases both TXx and TX90p (Fig. 5 and fig. S10) across those land regions where greening depletes summer soil moisture more strongly (Fig. 4B). Conversely, regions with additional summer soil wetting from spring LAI changes exhibit fewer hot extremes in summer. On average, our paired GCM analysis shows that the overall soil drying causes an additional 23 and 26% increase (increasing rates of 0.8 days decade−1 for summer TX90p and 0.07°C decade−1 for summer TXx) in TX90p and TXx, respectively, which exacerbates the sum-mer heatwaves caused directly by background global warming. This finding implies the existence of a positive feedback: Human-induced global warming causes earlier spring greening and thus forces lower
summer soil moisture. This, in turn, further aggravates the higher frequency and intensity of hot summer extremes driven by rising greenhouse gas concentrations (31).
DISCUSSION
Our combined use of satellite observations and model simulations sug-gests that a more intense water loss from land soils during spring, due to earlier vegetation greening, lowers soil moisture in spring and summer. This moisture depletion further reduces surface evapora-tive cooling and thus increases the possibility of stronger summer heatwaves. Exacerbated soil water limitation, together with more ex-treme weather events in summer, may restrain vegetation growth and suppress ecosystem productivity, especially for climatologically arid ecosystems that are sensitive to summer water availability (e.g., ASpring −2 −1.5 −1 −0.5 0 0.5 1 1.5 2 (10−4 m3 m−3 year−1) BSummer −2 −1.5 −1 −0.5 0 0.5 1 1.5 2 (10−4 m3 m−3 year−1)
Fig. 4. Spatial patterns of IPSL-simulated trends in soil moisture induced by spring LAI changes. Spatial patterns of the linear trends in spring (left) and summer
(right) SWC changes are shown. This change in soil moisture induced by earlier spring greening, SWC, is obtained as the difference between the two simulations with and without spring LAI changes. (i.e., LAI obsMAM – LAI
clim
MAM ). Black stipples indicate regions with a statistically significant linear trend (P < 0.05).
−2 to −1.6−1.6 to −1.2−1.2 to −0.8−0.8 to −0.4−0.4–0 0–0.4 0.4–0.8 0.8–1.2 1.2–1.6 1.6–2.0 SWC trend (10−4 m3 m−3 year−1) −0.15 −0.1 −0.05 0 0.05 0.1 0.15 0.2 TXx or TX90p trend TXx (oC decade-1) TX90p (days year-1) −6−4 − −2 0 2 4 6 SWC trend −0.6 −0.3 0 0.3 0.6 TX90p trend r = −0.41, P < 0.01 −6−4−2 0 2 4 6 SWC trend −0.6 −0.3 0 0.3 0.6 TXx trend r = −0.27, P < 0.01
Fig. 5. IPSL-simulated changes in summer extreme hot temperature indices related to SWC changes. The average linear trend of TXx and TX90p due to earlier
greening for different summer SWC trends binned into 0.4 (×10−4 m3 m−3 year−1) intervals. The TXx and TX90p values are obtained as the difference between the two simulations with and without spring LAI changes ( LAI obsMAM − LAI
clim
MAM ). The insets are scatterplots of trends in TXx (left) and TX90p (right) versus trends in SWC for 1982–2011. Each colored dot in the scatterplots represents a grid cell in the pattern of trends in TXx or TX90p (fig. S10).
on January 15, 2020
http://advances.sciencemag.org/
western United States). Our study has important implications for more accurate predictions of summer weather and climate features. For many parts of the world, climate models and measurements show that surface meteorological conditions are affected by both large-scale atmospheric circulation patterns and local soil moisture status in some regions with strong vegetation-atmosphere coupling (17, 32). The results of this study highlight the necessity of also accounting for spring plant phenology in weather and climate forecasting of sum-mer months, given their capacity to modulate sumsum-mer soil moisture levels through the interseasonal biophysical feedbacks.
One limitation of our analysis is the examination of diagnostics from an ensemble based on a single climate model. This concern is offset by our findings of modeled spring-to-summer greenness–soil moisture linkages having consistency with results of parallel observation–based analysis (Fig. 1). However, for future studies, we encourage other mod-eling centers to perform similar factorial experiments to ours to ver-ify the lagged hydrological impacts of earlier vegetation phenology. This includes independent model evidence of our discovery that precipitation feedbacks can alleviate greening-induced soil drying for some locations, involving the role of atmospheric teleconnections. Such assessment must rely on high-resolution GCMs that have ac-curate representations of large-scale atmospheric circulation pro-cesses. Furthermore, root-zone soil moisture relevant to deep-rooted plants is not directly measurable at large spatial scales. Hence, cur-rently, some uncertainties exist in soil moisture estimates from both observation-driven products and GCMs, in terms of the magnitude, interannual variability, and trends. Future improvements of root-zone soil moisture may be fulfilled by integrating in situ soil moisture mea-surements at different depths, microwave-based surface soil mois-ture, and robust surface–to–root zone scaling approaches [e.g., (33)]. This will enable additional verification of our identified soil mois-ture responses to the ongoing earlier greening and also aid enhanced soil moisture parameterizations in the next generation of global climate models (CGMs). While we are confident of the broad applicability of our findings, such improved simulations of soil moisture will allow refinement of magnitudes of our discovered feedbacks.
Human land-use changes may have strong imprints on the sea-sonal linkage between natural plants and soil moisture. The phenology of crops is strongly controlled by management actions, including fer-tilizer use, cropping calendars, multicropping, quick-growing hy-brid cultivars, pest control, and, notably, irrigation. The latter can effectively sustain soil moisture of irrigated croplands throughout the growing season, causing different correlations between crop growth and soil moisture. However, at present, many agricultural practices are not explicitly represented in GCMs, which limits our capacity to simulate the hydrological consequences of cropland managements. As we illustrate how vegetation greening feedbacks can be strongly modulated by human land use, this demonstrates the importance for the next generation of GCMs to include dynamic crop growth and realistic irrigation schemes. This will enable more accurate simulation of vegetation–soil moisture interactions with human interventions. In addition, the hydrological feedbacks of afforestation, reforesta-tion, and forest management practices over regions like China are not assessed separately from those of natural vegetation greening. Deliberately planted trees are expected to have similar variations in LAI as existing forests, causing similar alterations to the water cycle via changing transpiration and regional to large-scale precipitation patterns. Nonetheless, the ability of plants to transpire water varies with species composition and forest age (34), which should be taken
into account in future assessment of hydrological impacts of large-scale afforestation/reforestation.
MATERIALS AND METHODS Experimental design
We used satellite-derived measurements of LAI (as a proxy for veg-etation “greenness”) and reanalysis-based soil moisture to identify any significant relations between spring vegetation phenology and summer soil moisture, using the MCA approach. We also used fac-torial experiments by the IPSL-CM Earth System Model to provide process understanding of observation-based greenness–to–soil mois-ture linkages.
Observational datasets
Vegetation greenness was characterized using a gridded biweekly LAI dataset derived from the Global Inventory Monitoring and Model-ing Studies (GIMMS) LAI3g at an 8-km spatial resolution and 15-day interval for the period 1982–2011 (20). This global LAI product was generated from the GIMMS Advanced Very High Resolution Radi-ometer (AVHRR) Normalized Difference Vegetation Index (NDVI) 3g data and Moderate Resolution Imaging Spectroradiometer (MODIS) LAI data using an artificial neural network algorithm (20).
The GIMMS LAI3g data have been demonstrated to have good quality through direct comparisons with field measurements and inter-comparisons with other satellite-derived LAI products (35). Monthly LAI maps were obtained by calculating the maximum value of the two composites in each month at the original 8-km resolution and were then aggregated to each 0.5° × 0.5° grid cell that was used for our model simulation during the study period.
Besides LAI, other observed boundary conditions prescribed for IPSL-CM include SST and SIF maps and atmospheric CO2 concen-trations, all covering the study period 1982–2011. Monthly SST and SIF datasets were both obtained from the Atmospheric Model Inter-comparison Project (https://esgf-node.llnl.gov/news/list/input4mips/) with a 1° × 1° spatial resolution. Global annual atmospheric CO2 con-centrations were derived from those used for transient simulations of the TRENDY project (“Trends and drivers of the regional scale sources and sink of carbon dioxide”, http://dgvm.ceh.ac.uk/node/9).
Two independent SWC-related datasets covering the period of 1982–2011 were used for detecting coupled patterns of variability with changes in spring LAI and for evaluating modeling results. The first one is the satellite-derived root-zone soil moisture from GLEAM v3.2a (21). The GLEAM dataset fully assimilates reanalysis-based tempera-ture and radiation and remotely sensed top-layer soil moistempera-ture, L-band vegetation optical depth (VOD), and snow water equivalents from different satellite sensors (21) and also uses multisource precipita-tion forcings. The assimilaprecipita-tion of surface soil moisture allows us to diagnose where irrigation in agricultural regions is perturbing the hydrological cycle and the vegetation–soil moisture feedbacks be-tween spring and summer. Meanwhile, the forced precipitation and implied differences in hydrological balance provide data-based in-dications of where atmospheric teleconnections are transporting ex-tra moisture. In addition, GLEAM incorporates VOD to calculate the effects of water stress, heat stress, and phenological constraints on ET (21). In this way, it indirectly accounts for the influence of plant phenological changes on soil moisture. VOD and LAI are intrinsically related, but this does not generate circularity as we test for the link between GLEAM summer SWC and spring LAI measurements from
on January 15, 2020
http://advances.sciencemag.org/
optical satellite data. This is because VOD is controlled not only by plant structure (in part characterized by LAI) but also by plant hy-draulic strategies (i.e., stomatal and xylem regulation on water use) (36). The seasonal development of L-band VOD and LAI is proven to differ considerably for some biomes, such as woody savannas, of which water is mainly stored in stems or branches (36). The GLEAM SWC data have been extensively used in examining land-atmosphere feedbacks and benchmarking climate model simulations [e.g., (16)]. Note that the GLEAM root-zone soil moisture, of which the maxi-mum depth ranges between 10 and 250 cm depending on local veg-etation types, was here treated as a substitute for total soil moisture. The other soil moisture–related data are GRACE-REC, a global reconstruction of TWS anomalies based on the GRACE satellite retrievals (22). The past TWS anomalies were reconstructed using a sta-tistical model forced by daily precipitation and temperature anoma-lies, but trained with original TWS data from GRACE satellites for 2002 to present (22). The TWS anomalies, expressed as the equiva-lent water thickness (in centimeters), include not only soil moisture in the upper layers but also snowpack, canopy water, riverine and lacustrine water, and groundwater. Removing these non–soil mois-ture components from the TWS anomalies is technically challeng-ing, so some caution is needed when interpreting the TWS-based results (Fig. 1, B, E, and F).
We also obtained a range of observation-based datasets to evalu-ate model performance for hydrological variables besides SWC (ET and P). No direct observations of global land ET have been reported, so we used two satellite-derived reconstructions of long-term land ET. The first, FLUXNET-MTE, is based on field eddy-covariance mea-surements (37), and the second, WB-MTE, is based on information for precipitation, river discharge, and changes in water mass balance (38). Both ET products used satellite measurements to scale up either site- or catchment-level ET observations to a 0.5° × 0.5° global grid cell using a machine learning algorithm. Gridded data for global monthly precipitation were obtained from the Global Precipitation Climatology Centre (39) version 6.0 and the Climate Research Unit (CRU) TS3.22 datasets (40).
Model and experimental setup
IPSL-CM (24) is a coupled land-atmosphere GCM, versions of which continuously contribute to the Coupled Model Intercomparison Project initiatives, thus informing assessment reports of the Inter-governmental Panel on Climate Change. We used the IPSL-CM ver-sion 4 GCM, which consists of the atmospheric component LMDZ (the Laboratoire de Météorologie Dynamique general circulation model with zooming capability) and the land surface component ORCHIDEE (41). The soil hydrology within ORCHIDEE consists of two mois-ture layers with a constant total depth of 2-m water content per unit soil volume. Vegetation in this land surface model is described glob-ally with 13 plant functional types (PFTs), each using different gov-erning equations and taking different parameter values to represent the onset and offset processes of the leafy season (41). Using the IPSL-CM coupled model, changes in hydrological fluxes due to vegetation biophysical feedbacks were determined by replacing the modeled LAI in the ORCHIDEE land surface model with satellite observa-tions prescribed for each of the 13 PFTs.
To investigate how spring vegetation feedbacks modulate sum-mer soil moisture patterns in the last 30 years, we conducted a pair of transient GCM simulations prescribed with different spring LAI conditions. One experiment (abbreviated as LAI obsMAM ) was prescribed
with satellite-observed annually varying monthly LAI maps for 1982–2011 (including MAM). The other experiment (abbreviated as LAI climMAM ) was also prescribed with satellite-observed LAI maps identically to the LAI obsMAM experiment, except for spring months. During MAM, the LAI maps for each year were replaced with average monthly values over the entire study period (1982–2011). Spring greening in the real world may affect soil moisture by coupling to changes in oceanic and atmospheric conditions; hence, both experi-ments were fed additionally with other boundary conditions of SST, SIF, and atmospheric CO2 concentration. With this numerical ex-periment design, the fingerprint of earlier greening on summer hy-drological variables can be calculated as the difference between the two experiments (i.e., LAI obsMAM – LAI
clim
MAM ). The original or MAM- averaged LAI data–based time series (20) were used to prescribe LAI for each GCM grid cell and for each PFT within a grid cell. To reduce the effect of initial condition uncertainty due to internal climate variability, we conducted an ensemble of 30 simulations for each experiment with different initial conditions. The initial condi-tions were derived from the model outputs of an undisturbed 60-year run (i.e., with average LAI for all seasons, average SST, SIF, and at-mospheric CO2 concentrations): the first 30 years of the run for the spin-up of the simulation and then each of the last 30 years of the run for providing an alternative initial condition. All our model-based analyses were based on the 30-member ensemble mean of each tran-sient experiment. Only vegetated areas, defined as regions with mul-tiyear (1982–2011) average LAI ≥ 0.1, were considered to reduce the spurious influence of bare and sparsely vegetated areas on the over-all trend in LAI. All quantities averaged over the Northern Hemi-sphere (25° to 90°N) were weighted by area, unless otherwise noted. Indices of extreme hot temperatures
We used two metrics to measure modeled changes in summer ex-treme hot temperatures due to the earlier spring vegetation onset, following a previous study of extreme temperature detection (30). One metric measures the frequency of extreme hot temperatures, ex-pressed as the number of summer days, with maximum daily tem-peratures exceeding the 90% percentile of a baseline period (TX90p). The percentiles were calculated for each calendar day over a 15-day moving window using the 30-year simulation forced by observed LAI and other boundary conditions (i.e., LAI obsMAM ) (1982–2011). The other metric measures the intensity of extreme hot temperature events, expressed as the summer maximum of daily maximum temperature (TXx). Both indices were first calculated for both 30-ensemble mean experiments ( LAI obsMAM and LAI climMAM ), and changes in TX90p and TXx induced by earlier spring greening were then calculated as the dif-ference between the indices derived from the two simulations with and without spring LAI changes.
Statistical analysis
We applied partial correlation analysis in this study to evaluate the relationship between spring LAI and summer soil moisture after statis-tically controlling for the covarying effects of summer LAI and cli-matic variables (including summer temperature, precipitation, and solar radiation). These climatic variables were all derived from the CRU TS3.22 datasets. We also used the MCA analysis to characterize the coupling patterns between spring LAI and summer SWC. This ap-proach is also known as the singular value decomposition (SVD) (23), which can be considered as a generalization of principal components
on January 15, 2020
http://advances.sciencemag.org/
analysis. MCA has been widely used in environmental sciences to detect teleconnection patterns in the ocean-atmosphere-land system [e.g., (42)]. The MCA analysis looks for pairs of spatial patterns and associated time series (or called expansion coefficients) that efficiently explain the covariance between two space-time data fields. This was realized by performing SVD on the cross-covariance matrix between the two fields, yielding a set of singular vectors and singular values that are associated with pairs of spatial patterns. The time series for each pattern pair (fig. S4) were calculated by projecting one data field onto the respective singular vector. The correlation coefficient be-tween the time series of the two fields indicates how strongly related the coupled patterns are. Heterogeneous regression maps (Fig. 1, C to F, and fig. S6, A and B) were generated by regressing the gridded values of one field to the time series of the pattern amplitude of the other. Detailed mathematical basis of the MCA algorithm is described in section S2.
SUPPLEMENTARY MATERIALS
Supplementary material for this article is available at http://advances.sciencemag.org/cgi/ content/full/6/1/eaax0255/DC1
Supplementary Text
Section S1. Earlier spring vegetation greening revealed by remote sensing Section S2. Mathematical basis of the MCA analysis
Section S3. Model evaluation using available observations
Fig. S1. Spatial patterns of the trend in spring vegetation changes for 1982–2011. Fig. S2. Grassland partial correlations between ESA-CCI summer SWC and GIMMS spring LAI during 1982–2011.
Fig. S3. Partial correlations between spring LAI and either summer SWC or summer TWS, as affected by agricultural extent.
Fig. S4. Time series (or expansion coefficients) of the leading first MCA patterns. Fig. S5. Validation of IPSL-simulated hydrological variables.
Fig. S6. Robustness test of the IPSL-simulated relationship between spring LAI and summer SWC. Fig. S7. Comparison of trends of observation-based and IPSL-simulated ET.
Fig. S8. Spatial patterns of IPSL-simulated trends in key hydrological variables induced by spring LAI changes.
Fig. S9. IPSL-simulated average global prevailing wind at 10-m height.
Fig. S10. Spatial patterns of IPSL-simulated trends in summer extreme hot temperature indices induced by spring LAI changes.
Reference (43)
REFERENCES AND NOTES
1. J. Barichivich, K. R. Briffa, R. B. Myneni, T. J. Osborn, T. M. Melvin, P. Ciais, S. Piao, C. Tucker, Large-scale variations in the vegetation growing season and annual cycle of atmospheric CO2 at high northern latitudes from 1950 to 2011. Glob. Chang. Biol. 19, 3167–3183
(2013).
2. S. Piao, J. Tan, A. Chen, Y. H. Fu, P. Ciais, Q. Liu, I. A. Janssens, S. Vicca, Z. Zeng, S.-J. Jeong, Y. Li, R. B. Myneni, S. Peng, M. Shen, J. Peñuelas, Leaf onset in the northern hemisphere triggered by daytime temperature. Nat. Commun. 6, 6911 (2015).
3. Q. Liu, Y. H. Fu, Z. Zhu, Y. Liu, Z. Liu, M. Huang, I. A. Janssens, S. Piao, Delayed autumn phenology in the Northern Hemisphere is related to change in both climate and spring phenology. Glob. Chang. Biol. 22, 3702–3711 (2016).
4. M. D. Schwartz, R. Ahas, A. Aasa, Onset of spring starting earlier across the Northern Hemisphere. Glob. Chang. Biol. 12, 343–351 (2006).
5. A. Menzel, T. H. Sparks, N. Estrella, E. Koch, A. Aasa, R. Ahas, K. Alm-Kübler, P. Bissolli, O. Braslavská, A. Briede, F. M. Chmielewski, Z. Crepinsek, Y. Curnel, Å. Dahl, C. Defila, A. Donnelly, Y. Filella, K. Jatczak, F. Måge, A. Mestre, Ø. Nordli, J. Peñuelas, P. Pirinen, V. Remišová, H. Scheifinger, M. Striz, A. Susnik, A. J. H. Van Vliet, F.-E. Wielgolaski, S. Zach, A. Zust, European phenological response to climate change matches the warming pattern. Glob. Chang. Biol. 12, 1969–1976 (2006).
6. Y. H. Fu, S. Piao, M. op de Beeck, N. Cong, H. Zhao, Y. Zhang, A. Menzel, I. A. Janssens, Recent spring phenology shifts in western Central Europe based on multiscale observations. Glob. Ecol. Biogeogr. 23, 1255–1263 (2014).
7. C. D. Keeling, J. F. S. Chin, T. P. Whorf, Increased activity of northern vegetation inferred from atmospheric CO2 measurements. Nature 382, 146–149 (1996).
8. S. Piao, P. Friedlingstein, P. Ciais, N. Viovy, J. Demarty, Growing season extension and its impact on terrestrial carbon cycle in the Northern Hemisphere over the past 2 decades.
Global Biogeochem. Cycles 21, GB3018 (2007).
9. S. Wolf, T. F. Keenan, J. B. Fisher, D. D. Baldocchi, A. R. Desai, A. D. Richardson, R. L. Scott, B. E. Law, M. E. Litvak, N. A. Brunsell, W. Peters, I. T. van der Laan-Luijkx, Warm spring reduced carbon cycle impact of the 2012 US summer drought. Proc. Natl. Acad. Sci. U.S.A.
113, 5880–5885 (2016).
10. A. Angert, S. Biraud, C. Bonfils, C. C. Henning, W. Buermann, J. Pinzon, C. J. Tucker, I. Fung, Drier summers cancel out the CO2 uptake enhancement induced by warmer springs. Proc. Natl. Acad. Sci. U.S.A. 102, 10823–10827 (2005).
11. W. Buermann, P. R. Bikash, M. Jung, D. H. Burn, M. Reichstein, Earlier springs decrease peak summer productivity in North American boreal forests. Environ. Res. Lett. 8, 024027 (2013).
12. W. Buermann, M. Forkel, M. O’Sullivan, S. Sitch, P. Friedlingstein, V. Haverd, A. K. Jain, E. Kato, M. Kautz, S. Lienert, D. Lombardozzi, J. E. M. S. Nabel, H. Tian, A. J. Wiltshire, D. Zhu, W. K. Smith, A. D. Richardson, Widespread seasonal compensation effects of spring warming on northern plant productivity. Nature 562, 110–114 (2018).
13. S. Sippel, M. Forkel, A. Rammig, K. Thonicke, M. Flach, M. Heimann, F. E. L. Otto, M. Reichstein, M. D. Mahecha, Contrasting and interacting changes in simulated spring and summer carbon cycle extremes in European ecosystems. Environ. Res. Lett. 12, 075006 (2017).
14. R. J. Van Der Ent, H. H. G. Savenije, B. Schaefli, S. C. Steele-Dunne, Origin and fate of atmospheric moisture over continents. Water Resour. Res. 46, W09525 (2010). 15. Z. Zeng, S. Piao, L. Z. X. Li, T. Wang, P. Ciais, X. Lian, Y. Yang, J. Mao, X. Shi, R. B. Myneni,
Impact of Earth greening on the terrestrial water cycle. J. Climate 31, 2633–2650 (2018). 16. Y. Li, S. Piao, L. Z. X. Li, A. Chen, X. Wang, P. Ciais, L. Huang, X. Lian, S. Peng, Z. Zeng,
K. Wang, L. Zhou, Divergent hydrological response to large-scale afforestation and vegetation greening in China. Sci. Adv. 4, eaar4182 (2018).
17. B. Quesada, R. Vautard, P. Yiou, M. Hirschi, S. I. Seneviratne, Asymmetric European summer heat predictability from wet and dry southern winters and springs. Nat. Clim. Chang.
2, 736–741 (2012).
18. A. Berg, K. Findell, B. Lintner, A. Giannini, S. I. Seneviratne, B. van den Hurk, R. Lorenz, A. Pitman, S. Hagemann, A. Meier, F. Cheruy, A. Ducharne, S. Malyshev, P. C. D. Milly, Land-atmosphere feedbacks amplify aridity increase over land under global warming.
Nat. Clim. Chang. 6, 869–874 (2016).
19. A. L. S. Swann, I. Y. Fung, J. C. H. Chiang, Mid-latitude afforestation shifts general circulation and tropical precipitation. Proc. Natl. Acad. Sci. U.S.A. 109, 712–716 (2012). 20. Z. Zhu, J. Bi, Y. Pan, S. Ganguly, A. Anav, L. Xu, A. Samanta, S. Piao, R. R. Nemani,
R. B. Myneni, Global data sets of vegetation leaf area index (LAI)3g and Fraction of Photosynthetically Active Radiation (FPAR)3g derived from Global Inventory Modeling and Mapping Studies (GIMMS) Normalized Difference Vegetation Index (NDVI3g) for the period 1981 to 2011. Remote Sens. 5, 927–948 (2013).
21. B. Martens, D. G. Miralles, H. Lievens, R. van der Schalie, R. A. M. de Jeu, D. Fernández-Prieto, H. E. Beck, W. A. Dorigo, N. E. C. Verhoest, GLEAM v3: Satellite-based land evaporation and root-zone soil moisture. Geosci. Model Dev. 10, 1903–1925 (2017).
22. V. Humphrey, L. Gudmundsson, S. I. Seneviratne, A global reconstruction of climate-driven subdecadal water storage variability. Geophys. Res. Lett. 44, 2300–2309 (2017).
23. C. S. Bretherton, C. Smith, J. M. Wallace, An intercomparison of methods for finding coupled patterns in climate data. J. Climate 5, 541–560 (1992).
24. O. Marti, P. Braconnot, J.-L. Dufresne, J. Bellier, R. Benshila, S. Bony, P. Brockmann, P. Cadule, A. Caubel, F. Codron, N. de Noblet, S. Denvil, L. Fairhead, T. Fichefet, M.-A. Foujols, P. Friedlingstein, H. Goosse, J. Y. Grandpeix, E. Guilyardi, F. Hourdin, A. Idelkadi, M. Kageyama, G. Krinner, C. Lévy, G. Madec, J. Mignot, I. Musat, D. Swingedouw, C. Talandier, Key features of the IPSL ocean atmosphere model and its sensitivity to atmospheric resolution. Climate Dynam. 34, 1–26 (2010).
25. A. Berg, J. Sheffield, P. C. D. Milly, Divergent surface and total soil moisture projections under global warming. Geophys. Res. Lett. 44, 236–244 (2017).
26. X. Lian, S. Piao, C. Huntingford, Y. Li, Z. Zeng, X. Wang, P. Ciais, T. R. McVicar, S. Peng, C. Ottlé, H. Yang, Y. Yang, Y. Zhang, T. Wang, Partitioning global land evapotranspiration using CMIP5 models constrained by observations. Nat. Clim. Chang. 8, 640–646 (2018). 27. M. Stéfanon, P. Drobinski, F. D’Andrea, N. De Noblet-Ducoudré, Effects of interactive
vegetation phenology on the 2003 summer heat waves. J. Geophys. Res. 117, D24103 (2012). 28. M. Hirschi, S. I. Seneviratne, V. Alexandrov, F. Boberg, C. Boroneant, O. B. Christensen,
H. Formayer, B. Orlowsky, P. Stepanek, Observational evidence for soil-moisture impact on hot extremes in southeastern Europe. Nat. Geosci. 4, 17–21 (2011).
29. M. M. Vogel, R. Orth, F. Cheruy, S. Hagemann, R. Lorenz, B. J. J. M. Hurk, S. I. Seneviratne, Regional amplification of projected changes in extreme temperatures strongly controlled by soil moisture-temperature feedbacks. Geophys. Res. Lett. 44, 1511–1519 (2017). 30. S. E. Perkins, L. V. Alexander, On the measurement of heat waves. J. Climate 26,
4500–4517 (2013).
31. N. Christidis, G. S. Jones, P. A. Stott, Dramatically increasing chance of extremely hot summers since the 2003 European heatwave. Nat. Clim. Chang. 5, 46–50 (2014). 32. D. L. Swain, D. E. Horton, D. Singh, N. S. Diffenbaugh, Trends in atmospheric patterns
conducive to seasonal precipitation and temperature extremes in California seasonal precipitation and temperature extremes. Sci. Adv. 2, e1501344 (2016).
on January 15, 2020
http://advances.sciencemag.org/
33. C. Albergel, C. Rüdiger, T. Pellarin, J. C. Calvet, N. Fritz, F. Froissard, D. Suquia, A. Petitpa, B. Piguet, E. Martin, From near-surface to root-zone soil moisture using an exponential filter: An assessment of the method based on in-situ observations and model simulations.
Hydrol. Earth Syst. Sci. 12, 1323–1337 (2008).
34. S. T. Brantley, C. F. Miniat, P. V. Bolstad, Rainfall partitioning varies across a forest age chronosequence in the southern Appalachian Mountains. Ecohydrology 12, e2081 (2019). 35. H. E. Beck, T. R. McVicar, A. I. J. M. van Dijk, J. Schellekens, R. A. M. de Jeu, L. A. Bruijnzeel,
Global evaluation of four AVHRR–NDVI data sets: Intercomparison and assessment against Landsat imagery. Remote Sens. Environ. 115, 2547–2563 (2011).
36. F. Tian, J.-P. Wigneron, P. Ciais, J. Chave, J. Ogée, J. Peñuelas, A. Ræbild, J.-C. Domec, X. Tong, M. Brandt, A. Mialon, N. Rodriguez-Fernandez, T. Tagesson, A. al-Yaari, Y. Kerr, C. Chen, R. B. Myneni, W. Zhang, J. Ardö, R. Fensholt, Coupling of ecosystem-scale plant water storage and leaf phenology observed by satellite. Nat. Ecol. Evol. 2, 1428–1435 (2018). 37. M. Jung, M. Reichstein, P. Ciais, S. I. Seneviratne, J. Sheffield, M. L. Goulden, G. Bonan,
A. Cescatti, J. Chen, R. de Jeu, A. J. Dolman, W. Eugster, D. Gerten, D. Gianelle, N. Gobron, J. Heinke, J. Kimball, B. E. Law, L. Montagnani, Q. Mu, B. Mueller, K. Oleson, D. Papale, A. D. Richardson, O. Roupsard, S. Running, E. Tomelleri, N. Viovy, U. Weber, C. Williams, E. Wood, S. Zaehle, K. Zhang, Recent decline in the global land evapotranspiration trend due to limited moisture supply. Nature 467, 951–954 (2010).
38. Z. Zeng, T. Wang, F. Zhou, P. Ciais, J. Mao, X. Shi, S. Piao, A worldwide analysis of spatiotemporal changes in water balance-based evapotranspiration from 1982 to 2009. J. Geophys. Res. Atmos. 119, 1186–1202 (2014).
39. A. Becker, A. Meyer-Christoffer, B. Rudolf, K. Schamm, U. Schneider, M. Ziese, A description of the global land-surface precipitation data products of the Global Precipitation Climatology Centre with sample applications including centennial (trend) analysis from 1901–present. Earth Syst. Sci. Data 5, 71–99 (2013).
40. I. Harris, P. D. Jones, T. J. Osborn, D. H. Lister, Updated high-resolution grids of monthly climatic observations—The CRU TS3.10 Dataset. Int. J. Climatol. 34, 623–642 (2014). 41. G. Krinner, N. Viovy, N. de Noblet-Ducoudré, J. Ogée, J. Polcher, P. Friedlingstein, P. Ciais,
S. Sitch, I. C. Prentice, A dynamic global vegetation model for studies of the coupled atmosphere-biosphere system. Global Biogeochem. Cycles 19, GB1015 (2005).
42. A. Dai, Increasing drought under global warming in observations and models.
Nat. Clim. Chang. 3, 52–58 (2013).
43. S. Piao, Q. Liu, A. Chen, I. A. Janssens, Y. Fu, J. Dai, L. Liu, X. Lian, M. Shen, X. Zhu, Plant phenology and global climate change: Current progresses and challenges.
Glob. Chang. Biol. 25, 1922–1940 (2019).
Acknowledgments: We acknowledge the National Supercomputer Center in Tianjin, China
(NSCC-JI, http://www.nscc-tj.cn/) and the National Computer Center IDRIS of CNRS in France for providing computing resources. Funding: This study was supported by the National Key Research and Development Program of China (grant 2018YFC1507704), the Second Tibetan Plateau Scientific Expedition and Research Program (Grant No. 2019QZKK0208), the National Natural Science Foundation of China (41561134016 and 41988101), the National Youth Top-notch Talent Support Program in China, and the 111 Project (B14001). C.H. acknowledges the Center for Ecology and Hydrology (CEH) National Capability fund. P.C., I.A.J., and J.P. were funded by the European Research Council Synergy (grant SyG-2013-610028 IMBALANCE-P). Author
contributions: S.P. designed the research. X.L. performed analysis. X.L. and S.P. drafted the paper.
All authors contributed to the interpretation of the results and to the text. Competing interests: The authors declare that they have no competing interests. Data and materials availability: All methods needed to evaluate the conclusions in the paper are present in the paper and/or the Supplementary Materials. All data related to this paper, along with code for interpretation of data and preparation of diagrams, are available on request from the corresponding author. Submitted 15 February 2019
Accepted 6 November 2019 Published 3 January 2020 10.1126/sciadv.aax0255
Citation: X. Lian, S. Piao, L. Z. X. Li, Y. Li, C. Huntingford, P. Ciais, A. Cescatti, I. A. Janssens, J. Peñuelas, W. Buermann, A. Chen, X. Li, R. B. Myneni, X. Wang, Y. Wang, Y. Yang, Z. Zeng, Y. Zhang, T. R. McVicar, Summer soil drying exacerbated by earlier spring greening of northern vegetation. Sci. Adv. 6, eaax0255 (2020).
on January 15, 2020
http://advances.sciencemag.org/
Zhenzhong Zeng, Yongqiang Zhang and Tim R. McVicar
DOI: 10.1126/sciadv.aax0255 (1), eaax0255. 6
Sci Adv
ARTICLE TOOLS http://advances.sciencemag.org/content/6/1/eaax0255
MATERIALS
SUPPLEMENTARY http://advances.sciencemag.org/content/suppl/2019/12/20/6.1.eaax0255.DC1
REFERENCES
http://advances.sciencemag.org/content/6/1/eaax0255#BIBL
This article cites 43 articles, 5 of which you can access for free
PERMISSIONS http://www.sciencemag.org/help/reprints-and-permissions
Terms of Service
Use of this article is subject to the
is a registered trademark of AAAS. Science Advances
York Avenue NW, Washington, DC 20005. The title
(ISSN 2375-2548) is published by the American Association for the Advancement of Science, 1200 New Science Advances
License 4.0 (CC BY-NC).
Science. No claim to original U.S. Government Works. Distributed under a Creative Commons Attribution NonCommercial Copyright © 2020 The Authors, some rights reserved; exclusive licensee American Association for the Advancement of
on January 15, 2020
http://advances.sciencemag.org/