HAL Id: hal-02999730
https://hal.archives-ouvertes.fr/hal-02999730
Submitted on 18 Dec 2020
HAL is a multi-disciplinary open access
archive for the deposit and dissemination of
sci-entific research documents, whether they are
pub-lished or not. The documents may come from
teaching and research institutions in France or
abroad, or from public or private research centers.
L’archive ouverte pluridisciplinaire HAL, est
destinée au dépôt et à la diffusion de documents
scientifiques de niveau recherche, publiés ou non,
émanant des établissements d’enseignement et de
recherche français ou étrangers, des laboratoires
publics ou privés.
major urban and agricultural emission sources for use in
source apportionment studies
Ashish Kumar, Vinayak Sinha, Muhammed Shabin, Haseeb Hakkim, Bernard
Bonsang, Valerie Gros
To cite this version:
Ashish Kumar, Vinayak Sinha, Muhammed Shabin, Haseeb Hakkim, Bernard Bonsang, et al..
Non-methane hydrocarbon (NMHC) fingerprints of major urban and agricultural emission sources for use
in source apportionment studies. Atmospheric Chemistry and Physics, European Geosciences Union,
2020, 20, pp.12133-12152. �10.5194/acp-20-12133-2020�. �hal-02999730�
https://doi.org/10.5194/acp-20-12133-2020 © Author(s) 2020. This work is distributed under the Creative Commons Attribution 4.0 License.
Non-methane hydrocarbon (NMHC) fingerprints of major
urban and agricultural emission sources for use in source
apportionment studies
Ashish Kumar1,z, Vinayak Sinha1, Muhammed Shabin1, Haseeb Hakkim1, Bernard Bonsang2, and Valerie Gros2
1Department of Earth and Environmental Sciences, Indian Institute of Science Education and Research Mohali,
Sector 81, S. A. S. Nagar, Manauli PO, Punjab, 140306, India
2Laboratoire des Sciences du Climat et de l’Environnement (LSCE), CNRS/CEA/UVSQ, IPSL, Université Paris-Saclay,
F91191 Gif-sur-Yvette, France
zInvited contribution by Ashish Kumar, recipient of the EGU Atmospheric Sciences Outstanding Student Poster
and PICO Award 2019.
Correspondence: Vinayak Sinha (vsinha@iisermohali.ac.in) Received: 19 December 2019 – Discussion started: 20 January 2020
Revised: 5 September 2020 – Accepted: 17 September 2020 – Published: 26 October 2020
Abstract. In complex atmospheric emission environments such as urban agglomerates, multiple sources control the ambient chemical composition driving air quality and re-gional climate. In contrast to pristine sites, where reliance on single or a few chemical tracers is often adequate for resolving pollution plumes and source influences, the com-prehensive chemical fingerprinting of sources using non-methane hydrocarbons (NMHCs) and the identification of suitable tracer molecules and emission ratios becomes neces-sary. Here, we characterise and present chemical fingerprints of some major urban and agricultural emission sources ac-tive in South Asia, such as paddy stubble burning, garbage burning, idling vehicular exhaust and evaporative fuel emis-sions. A total of 121 whole air samples were actively col-lected from the different emission sources in passivated air sampling steel canisters and then analysed for 49 NMHCs (22 alkanes, 16 aromatics, 10 alkenes and one alkyne) us-ing thermal desorption gas chromatography flame ionisation detection. Several new insights were obtained. Propane was found to be present in paddy stubble fire emissions (8 %), and therefore, for an environment impacted by crop residue fires, the use of propane as a fugitive liquefied petroleum gas (LPG) emission tracer must be done with caution. Propene was found to be ∼ 1.6 times greater (by weight) than ethene in smouldering paddy fires. Compositional differences were observed between evaporative emissions of domestic LPG
and commercial LPG, which are used in South Asia. While the domestic LPG vapours had more propane (40 ± 6 %) than n-butane (19 ± 2 %), the converse was true for com-mercial LPG vapours (7 ± 6 % and 37 ± 4 %, respectively). Isoprene was identified as a new tracer for distinguishing paddy stubble and garbage burning in the absence of iso-prene emissions at night from biogenic sources. Analyses of source-specific inter-NMHC molar ratios revealed that toluene/benzene ratios can be used to distinguish among paddy stubble fire emissions in the flaming (0.38 ± 0.11) and smouldering stages (1.40 ± 0.10), garbage burning flam-ing (0.26 ± 0.07) and smoulderflam-ing emissions (0.59 ± 0.16), and traffic emissions (3.54 ± 0.21), whereas i-pentane / n-pentane can be used to distinguish biomass burning emis-sions (0.06–1.46) from the petrol-dominated traffic and fossil fuel emissions (2.83–4.13). i-butane / n-butane ratios were similar (0.20–0.30) for many sources and could be used as a tracer for photochemical ageing. In agreement with pre-vious studies, i-pentane, propane and acetylene were iden-tified as suitable chemical tracers for petrol vehicular and evaporative emissions, LPG evaporative and vehicular emis-sions and flaming-stage biomass fires, respectively. The sec-ondary pollutant formation potential and human health im-pact of the sources was also assessed in terms of their hy-droxyl radical (OH) reactivity (s−1), ozone formation po-tential (OFP; gO3/gNMHC) and fractional benzene, toluene,
ethylbenzene and xylenes (BTEX) content. Petrol vehicular emissions, paddy stubble fires and garbage fires were found to have a higher pollution potential (at ≥ 95 % confidence interval) relative to the other sources studied in this work. Thus, many results of this study provide a new foundational framework for quantitative source apportionment studies in complex emission environments.
1 Introduction
Non-methane hydrocarbons (NMHCs) are an important class of volatile organic compounds (VOCs) that drive atmo-spheric chemistry and contribute to the formation of tropo-spheric ozone and secondary organic aerosols (SOAs; Pois-son et al., 2000; Hallquist et al., 2009; Derwent et al., 2010; Ortega et al., 2016). Ground level ozone affects ambient air quality, human health and climate, thus making it a primary target in air quality regulations (EPA, 1990). Furthermore, by reacting with the hydroxyl radical (OH), they can also affect the oxidative capacity of the atmosphere (Atkinson, 2000). NMHCs have a wide variety of anthropogenic, py-rogenic and biogenic sources. In urban areas, anthropogenic sources, such as vehicular emissions, industries and fugitive solvent evaporation, dominate the emissions (Barletta et al., 2005; Baker et al., 2008; Kansal, 2009; Jaimes-Palomera et al., 2016). However, in an agrarian and developing economy like India and other parts of South Asia, other major an-thropogenic activities like crop residue burning and garbage burning have emerged as poorly regulated emission sources. Every year the northwest Indo–Gangetic Plain (NW-IGP) experiences episodes of large-scale open burning of paddy stubble in the post-harvest months of October and Novem-ber, where > 12 685 km2of area of Punjab alone is estimated to be burnt in the open farm fields (Badarinath et al., 2006). This results in emission of a large number of gaseous and particulate pollutants into the air and causes severe deteri-oration in regional air quality (Sarkar et al., 2013; Chandra and Sinha, 2016; Kumar et al., 2016, 2018; Garg et al., 2016; Sharma et al., 2019).
Previous studies have characterised the emissions of se-lected VOCs, greenhouse gases and primary air pollutants, like benzenoids, carbon monoxide, nitrogen oxides and black carbon (Venkataraman et al., 2006; Sahai et al., 2007), from paddy stubble burning over NW-IGP. However, there is still a considerable deficit in knowledge concerning the speci-ated non-methane hydrocarbons, which are co-emitted in the smoke (Andreae, 2019; Sinha et al., 2019). The NMHC emis-sions from different sources, when expressed as emission source profiles (Watson et al., 2001; Hong-li et al., 2017), provide detailed insights for quantitative source apportion-ment in source receptor models. Moreover, they are helpful for assessing human health risks due to exposure to toxic and hazardous compounds and secondary pollutant
forma-tion tendencies and, therefore, assist in prioritisaforma-tion of pol-lution control strategies and policies.
The ratio of two NMHCs with different chemical lifetimes can also be used to constrain the photochemical age of air masses and atmospheric transport times (Parrish et al., 1992; McKeen and Liu, 1993). Several source profiles have been compiled for different emission sources in North America (Dallmann et al., 2012; Gentner et al., 2012), Europe (Pas-sant, 2002; Niedojadlo et al., 2007), East Asia (Na et al., 2004; Liu et al., 2008; Zhang et al., 2013; Zheng et al., 2013; Mo et al., 2016; Hong-li et al., 2017) and other areas (Doskey et al., 1999); however, there is still a considerable gap in the data of speciated NMHCs from active emission sources in South Asia. Using the emission source profiles from differ-ent regions of the world for modelling and emission inven-tories can result in large uncertainties as the emissions can change from country to country, depending upon the quality and composition of fuels, combustion practices and vehicu-lar fleet. Therefore, it is essential to have a comprehensive database of regional and local source profiles which can be used to yield more accurate data for the calculation of emis-sions and source apportionment tools, such as positive matrix factorisation.
In this study, we report the NMHC fingerprinting of paddy stubble burning emissions, garbage burning emissions, fuel evaporative emissions and idling exhaust emissions of ve-hicles powered by liquefied petroleum gas (LPG), com-pressed natural gas (CNG), diesel and petrol using 49 spe-ciated NMHCs (22 alkanes, 16 aromatics, 10 alkenes and one alkyne). These compounds were measured using thermal desorption gas chromatography flame ionisation detection (TD-GC-FID). Based on the measured source profiles, chem-ical tracers were identified to distinguish the varied emis-sion sources and also for use in positive matrix factorisation (PMF) source apportionment models. Furthermore, we as-sessed the secondary pollutant formation potential and health risks of the sources in terms of their OH reactivity (s−1), ozone formation potential (OFP; gO3/gNMHC) and the
frac-tional sum of benzene, toluene, ethylbenzene and xylenes (BTEX) content.
2 Materials and methods
2.1 Whole air sampling from specific sources in passivated steel canisters
Table 1 summarises the details of the whole air sample col-lection experiments for emissions from paddy stubble burn-ing, garbage burnburn-ing, busy traffic junctions, idling vehicu-lar exhaust emissions and fuel evaporation. The paddy stub-ble burning samples (three flaming and three smouldering) were collected at an agricultural field in Kurari, Mohali (30.605◦N, 76.744◦E), on 4 November 2017 between 16:30 and 18:30 local time (LT). The garbage burning samples (five
Table 1. Number of samples investigated per source for the measurements of non-methane hydrocarbons (NMHCs) source profiles. Note: liquefied petroleum gas – LPG; compressed natural gas – CNG; light-duty vehicle – LDV; heavy-duty vehicle – HDV.
Sources Description No. of samples
Paddy stubble burning (flaming stage) Agricultural field in Kurari, Mohali (30.605◦N, 76.744◦E) on 4 November 2017
3
Paddy stubble burning (smouldering stage) Agricultural field in Kurari, Mohali (30.605◦N, 76.744◦E) on 4 November 2017
3
Garbage burning (flaming stage) Waste sorting and disposing stations in Mohali and surrounding villages (30.642–30.699◦N, 76.713–76.729◦E) in February 2017
5
Garbage burning (smouldering stage) Waste sorting and disposing stations in Mohali and surrounding villages (30.642–30.699◦N, 76.713–76.729◦E) in February 2017
5
Traffic Busy traffic junctions in Chandigarh and Mohali (30.691◦N, 76.698◦E, 30.678◦N, 76.721◦E and 30.717◦N, 76.812◦E) in on 3, 8 and 15 March 2017 between 11:00 and 17:00 local time
3
Petrol vehicular exhaust Petrol LDV and two wheelers in idling stage in Chandigarh and Mohali (30.660–30.750◦N, 76.700–76.840◦E) between
March 2017 and October 2018
23
Diesel vehicular exhaust Diesel LDV four wheelers and three wheelers and HDV in idling stage in Chandigarh and Mohali (30.660–30.750◦N, 76.700–76.840◦E) between March 2017 and October 2018
33
LPG vehicular exhaust LPG three wheelers in idling stage in Chandigarh and Mohali (30.660–30.750◦N, 76.700–76.840◦E) between
March 2017 and October 2018
9
CNG vehicular exhaust CNG three wheelers and LDV four wheelers in idling stage in Chandigarh and Mohali (30.660–30.750◦N, 76.700–76.840◦E) between
March 2017 and October 2018
7
LPG evaporative emissions LPG vapours collected directly from domestic (5) and commercial LPG cylinders (5) in Mohali, Chandigarh and Panchkula on 13–14 August 2020
10
Petrol evaporative emissions Petrol vapours collected directly from the headspace of the fuel tank of the petrol vehicles between 13 and 14 August 2020 at IISER Mohali campus (30.665◦N, 76.730◦E)
10
Diesel evaporative emissions Diesel vapours collected directly from the headspace of the fuel tank of the diesel vehicles between 13 and 14 August 2020 at IISER Mohali campus (30.665◦N, 76.730◦E)
10
flaming and five smouldering) were collected at waste sort-ing and dispossort-ing stations in Mohali and surroundsort-ing vil-lages (30.642–30.699◦N, 76.713–76.729◦E) between 7 and 17 February 2017. Figure S1 shows the flaming and smoul-dering fires, which were distinguished by a visual inspection of the presence of flame and white smoke as per previous studies (Chandra et al., 2017; Kumar et al., 2018). The fire in the flaming stage showed a clear flame with little smoke, while in the smouldering stage there was white smoke and no flame. The traffic samples were collected from three busy traffic junctions in Chandigarh and Mohali (Sohana Gu-rudwara Chowk, Mohali, 30.691◦N, 76.698◦E; Sector 79 and 80, Chowk, Mohali, 30.678◦N, 76.721◦E; and Trans-port Chowk, Chandigarh, 30.717◦N, 76.812◦E) from 3 to
15 March 2017. Although the vehicular emissions are known to be dependent upon several factors, their idling operation results in quite high emissions and fuel residues in the ex-haust fumes (Yamada et al., 2011; Shancita et al., 2014). This is because, in idling operations, the engine does not work at its peak operating temperature and efficiency (Brodrick et al., 2002), resulting in incomplete fuel combustion (Rahman et al., 2013). In this study, prior to vehicular exhaust sampling, the engine was left running for about 5 min until it warmed up to normal working temperature (70–90◦C), and then the air was sampled directly from the mouth of the exhaust tailpipe, with the car in a stationary position and the engine running at idle speed. The idling vehicular exhaust samples were col-lected from 23 petrol vehicles (14 two wheelers and nine
light-duty four wheelers), 33 diesel vehicles (six three ers, 12 light-duty four wheelers and 15 heavy-duty wheel-ers), nine LPG vehicles (three wheelers) and seven CNG ve-hicles (six three wheelers and one light-duty four wheeler) from March 2017 to October 2018 in Chandigarh and Mo-hali (30.660–30.750◦N, 76.700–76.840◦E). For a better rep-resentation in the results, the most common vehicle models on Indian roads were selected for this study based upon per-sonal field observations and motor vehicle data provided by Ministry of Road Transport and Highways (MoRTH, 2017). The fuel evaporative emissions samples (10 each from the headspace of LPG, petrol and diesel) were collected in Mo-hali, Chandigarh and Panchkula on 13–14 August 2020. In India, the most commonly used LPG is of two types, namely domestic LPG for household cooking and commercial LPG for various commercial and industrial activities like hotels, restaurants, metallurgical applications, textiles, automotive, etc. Out of the total 10 samples of LPG evaporative emis-sions, five samples each were of domestic and commercial LPG. For a better representation, the samples of evapora-tive emissions were also collected from the most common brands of petrol, diesel and LPG fuels sold all over India and in Nepal, Bangladesh and Sri Lanka (namely Indian Oil, Hin-dustan Petroleum, Bharat Petroleum, Bharat Gas and Indane Gas). In addition, prior to the lighting of fires or turning on the engines, ambient air samples were also collected from the aforementioned sites to correct for ambient background concentrations.
The whole air was actively sampled in commercially avail-able 6 L passivated SilcoCan air sampling steel canisters (Restek) and then analysed, using a thermal desorption gas chromatograph equipped with a flame ionisation detector (TD-GC-FID), within 1 d of the sample collection as per the collection procedure described in previous works (Chandra et al., 2017; Vettikkat et al., 2020). Stability tests of the com-pounds in the canisters were also conducted, which showed that all the measured compounds reported in this work, in-cluding alkenes and alkyne, remained stable for up to 3 d. The air was actively sampled into the canisters using a Teflon VOC pump (model N86 KT.45.18; KNF) operating at a flow rate of ∼ 5500 mL/min and pressurised up to 30 psi. The steel canisters were protected from dust and air particles using a Teflon membrane filter (pore size – 0.45 µm) in the sample inlet line. Prior to each sampling the canisters were cleaned and preconditioned as per EPA Method 15, using a TO-Clean canister cleaner (Wasson-ECE Instrumentation) and humidified nitrogen.
2.2 NMHC measurements by thermal desorption – gas chromatography-flame ionisation detection (TD-GC-FID)
NMHCs in the sample air were measured using a gas chro-matograph equipped with two flame ionisation detectors (GC-FID 7890B; Agilent Technologies). Sampling and
pre-concentration was performed using a thermal desorption (CIA Advantage-HL and Unity 2; Markes International) unit coupled to the GC-FID system. Helium (99.999 % pure; Sigma Gases and Services) was used as the carrier gas. Hy-drogen (99.9995 %; Precision HyHy-drogen 100 H2Generator;
Peak Scientific), synthetic air (99.999 %; Sigma Gases and Services) and nitrogen (99.9995 %; Precision Nitrogen trace 250 N2 Generator; Peak Scientific) were used as the FID
gases (Table S1). Synthetic air (99.9995 %; Precision Zero Air 1.5 gas generator; Peak Scientific) was also used as the purge gas for the Markes thermal desorption unit.
Figure S2 shows the schematic representation of the TD-GC-FID instrument during a typical sample injection and chromatographic run. In the first stage, sample air was passed through a Nafion dryer (integrated into the CIA Advantage) to remove water (Badol et al., 2004; Gros et al., 2011). It was then preconcentrated at −30◦C (maintained by a
Peltier cooling system) at 20 mL/min on an ozone precur-sor trap (U-T17O3P-2S; Markes International). The trap was a quartz tube (2 mm internal diameter; 60 mm long) contain-ing Tenax TA, Carboxen 1003 and Carbosieve SIII as ad-sorbents. The preconcentrated trap was thermally desorbed by heating the trap rapidly to 325◦C, and held at this tem-perature for 20 min, so that all the preconcentrated NMHCs were thermally desorbed. Thermally desorbed NMHCs were then transferred via a heated inlet (130◦C) line onto the GC instrument consisting of two capillary columns (dimethyl polysiloxane, DB-1; 60 m × 0.25 mm, 1.00 µm film thick-ness; Alumina PLOT, Al2O3 deactivated with Na2SO4 and
50 m × 0.32 mm, 8 µm film thickness; Agilent Technolo-gies). Table S1 lists the settings at which the flame ionisa-tion detectors (FIDs) were operated and the oven tempera-ture was ramped. Initially a temperatempera-ture of 30◦C was
main-tained for 12 min, and thereafter it was increased at two sub-sequent rates of 5◦C/min (up to 170◦C) and 15◦C/min (up to 200◦C). The two columns were connected via a Dean’s switch, which was turned on after 17 min of the chromato-graphic run. In these initial 17 min, the two columns were connected to each other in a series, and the eluents from the first column (DB-1) were directed onto the second column (Alumina PLOT). After 17 min, the series connection be-tween both the columns was broken by turning on the Dean’s switch, and the eluents from both columns were directed onto their respective FIDs. C6and higher NMHCs were
re-solved on DB-1 column and detected on FID 1, while C2-C5
NMHCs were resolved on Alumina PLOT column and de-tected on FID 2. Thus, in a single run, C2-C10 compounds
were measured simultaneously in two chromatograms. Prior to the sampling, the instrument was calibrated by dynamic dilution with zero air at different mixing ratios (in the range of 2–200 parts per billion – ppb) using a standard gas calibration unit (GCU-s, v2.1; Ionimed, Ionicon Ana-lytik GmbH). A NIST calibrated flow meter (Bios DryCal Definer 220) was used to measure the flows of both the stan-dard gas and zero air mass flow controllers before and
af-ter the calibration experiments. Figure S3 shows the sensi-tivity and linearity of NMHCs obtained from the calibra-tion experiments performed over a dynamic range of 2– 200 ppb over two sets of calibrations, namely regular cali-bration of 2–20 ppb and a high mixing ratio calicali-bration of 10–200 ppb. This covers a range of 2 orders of magnitude over which the instrument exhibited an excellent linearity (r2>0.99) for all the 49 NMHCs. Figure S4 shows a typ-ical chromatogram of the standard gas during the calibra-tion experiment. Peak identificacalibra-tion and quantificacalibra-tion were performed using PC software (OpenLab CDS, ChemSta-tion EdiChemSta-tion, Rev. C.01.06(61); Agilent Technologies). Fur-thermore, Supplement 2 provides an example chromatogram for each source that was sampled. All the chromatograms were manually inspected to ensure correct peak identifica-tion, baseline determination and peak area calculation. The FID signal of a compound was recorded in the form of a current (picoampere – pA) by the instrument, and the area under the peak was calculated and expressed in units of pAs (picoampere seconds) and used to quantify the analyte. Indi-vidual peak areas (in pAs) were converted to parts per billion using the sensitivity factors obtained from calibration experi-ments. For highly concentrated samples, appropriate dilution was performed prior to the sample injection so that the mea-sured concentrations were within the range of 5–30 ppb for most of the compounds. However, there were still a few com-pounds that were 50–200 ppb in some sources even after dilu-tion (Table S2). The instrument linearity was therefore tested at high concentrations of up to 200 ppb, and excellent linear-ity (r2≥0.99) was observed for all the compounds (Fig. S3). The Supplement 3 (in Excel file format) provides details of the measured mixing ratios for each individual sample measured by the TD-GC-FID system after dilution, mix-ing ratios of the compound in the actual sample after cor-recting for dilution along with uncertainty and the values in the corresponding background samples. For the major compounds determining the normalised source profiles (pre-sented and discussed in Sect. 3.1), the sample values were significantly higher than the background values (even by an order of magnitude or more for smoke and vehicular ex-haust source categories). Therefore, while the background values were used to calculate excess concentrations, they hardly played any role in the determination of the emission profiles. The peaks in the chromatograms of the emission sources were also well resolved and separated and were iden-tified using the calibration gas standards. In case a shoul-der peak was present, the parent peak was separately inte-grated, i.e., any interference from a shoulder peak was sub-tracted from the parent signal. In the calibration gas stan-dard, some additional compounds were also present, namely 2,2,4-trimethylpentane, 2,3,4-trimethylpentane and methyl-cyclohexane, each of which had a well-resolved and separate peak during the calibration experiments. However, during the analysis of emission source samples, these compounds ex-hibited poor peak features like peak shape, several
shoul-der peaks, etc. Therefore, to remain consistent across all samples, these compounds were excluded from the analysis, and only those compounds that were well resolved were in-cluded. Table S3 lists the details of two VOC gas standards, namely the (1) gas standard (Chemtron Science Laborato-ries Private Limited) containing VOCs at a mixing ratio of circa 1 parts per million by volume (ppmv; stated accuracy of ±5 %) and the (2) gas standard (Apel Riemer Environ-mental, Inc.) containing VOCs at circa 500 ppb (stated ac-curacy better than 5 %) with which the instrument was cal-ibrated. Instrumental sensitivities can change during a long run deployment owing to a change in settings and mechanical wear and tear, and therefore, regular calibrations are impor-tant to assess the instrumental stability. Table S4 shows the average sensitivity factors (pAs/ppb) and standard deviation derived from 13 calibrations performed regularly between December 2016 and October 2018, with no major changes (8 %–12 % for most of the measured compounds) observed in the instrumental sensitivities. A reasonable agreement (considering the maximum instrumental uncertainty error of <15 %) was found for the average calibration factors be-tween December 2016 and October 2018 and derived from the two different gas standards for the common compounds, such as isoprene (53.2 ± 4.9 and 55.6 ± 5.9 pAs ppb−1), benzene (67.8 ± 5.6 and 69.2 ± 5.5 pAs ppb−1) and toluene (74.6 ± 6.6 and 81.3 ± 7.7 pAs ppb−1). Table 2 lists the compound-specific precision errors, limit of detection (LOD) and total uncertainties. The precision of the instrument was evaluated under identical conditions, using the relative stan-dard deviation of five individual measurements of 1 and 5 ppb of the standard gas mixture, and was in the range of 1 %–6 % for 1 ppb and 0.1 %–0.5 % for 5 ppb of the reported com-pounds. The limit of detection of the instrument was eval-uated according to Eq. (1) at 5 % probability, using the stan-dard deviation of eight zero/blank samples measurements un-der identical conditions (Penkett, 2007; ACTRIS, 2014).
LOD = 2t σ. (1)
Here, σ is the standard deviation of eight blank measure-ments (manual integration of peaks in the blank sample; if peaks were missing then the integration of the baseline corre-sponding to the same retention time and average peak width was used), and t is the Student’s t value for the 5 % proba-bility and 7◦of freedom. The instrumental LOD was in the range of 2–104 parts per trillion (ppt). The total uncertainties were calculated using the root mean square propagation of individual uncertainties, like the 5 % accuracy error inherent in the VOC gas standard concentration, error in the linear fit of the calibration curve, the error in the flow reproducibility of the two mass flow controllers and the precision error of the instrument. The overall uncertainties for all compounds were less than 15 %.
Figure 1. Normalised source profiles of (a) paddy stubble burning – flaming. (b) Paddy stubble burning – smouldering. (c) Garbage burning – flaming. (d) Garbage burning – smouldering. (e) Commercial liquefied petroleum gas (LPG) evaporative emissions. (f) Domestic LPG evaporative emissions. (g) Petrol evaporative emissions. (h) Diesel evaporative emissions derived from the thermal desorption gas chro-matography flame ionisation detection (TD-GC-FID) measurements. Error bars represent the standard error of averaged normalised ratio. Grey highlights the aromatics, red the alkenes and alkyne and yellow the alkanes.
3 Results and discussion
3.1 NMHC chemical fingerprinting of emission sources 3.1.1 Paddy stubble fires and garbage fires
Figure 1a–d show the normalised emission profiles of the whole air samples collected from paddy stubble and garbage fires under flaming and smouldering conditions. The mix-ing ratios were corrected for ambient background levels us-ing samples collected just before the fires, normalised to the NMHC, with the maximum mass concentration in the respec-tive source sample and averaged for the different fires.
The largest contributors to the mass concentrations in paddy fires under flaming conditions were ethene (16 %), benzene (16 %), propene (13 %), acetylene (13 %) and ethane (12 %), while in smouldering conditions ethane (21 %), iso-prene (13 %), propene (13 %), propane (8 %) and ethene (6 %) were the highest ranked contributors. Acetylene was found to be negligible (< 1 %) in smouldering fires and, therefore, can be used as tracer for fires under flaming con-ditions. Amongst alkenes, the fraction of ethene and propene reduced in smouldering while that of isoprene increased by ∼3 times relative to the flaming stage emissions. In the stud-ies reported previously (Akagi et al., 2011; Andreae, 2019), ethene was reported to have higher emissions than propene from crop residue fires. Our study results reveal that ethene emissions were lower in the smouldering fires compared to propene. While previous studies compiled the results of mostly the laboratory combustion of fuels in controlled en-vironments that are more typical of flaming conditions, the smouldering stage of fire, which is characterised by poor combustion efficiency and therefore different flame chem-istry in the agricultural fields as encountered by us, may be a cause for this variance and emphasise why results from con-trolled burn experiments need to be complemented with field crop residue fire results. In the garbage fire emissions, un-der both flaming and smoulun-dering conditions, benzene (24 % and 26 %, respectively), propene (15 % and 11 %, respec-tively) and ethene (14 % and 7 %, respecrespec-tively) were the most dominant NMHCs. The differences in the burning ef-ficiency of the fires were highlighted again by the lower frac-tion of acetylene (∼ 1 %) in smouldering condifrac-tions, while in flaming conditions it was 11 %. Ethane, propane and n-butane increased by ∼ 2 times under smouldering conditions. The garbage burnt in this study mostly comprised of wet vegetable and food waste from households (Sharma et al., 2019) and, therefore, had lower styrene (< 1 %) compared to garbage samples containing plastic and packaging material, which can also be a source of styrene emissions due to the presence of plastic (polystyrene) waste (Lemieux et al., 2004; Tang et al., 2000). Isoprene was found to be very low (< 1 %) in the garbage fires compared to the paddy stubble fires and, therefore, could be potentially employed to distinguish paddy stubble and garbage burning activities in the absence of
iso-prene emissions at night from biogenic sources. Furthermore, propane has been widely used as an emission tracer for fugi-tive LPG emissions (Blake and Rowland, 1995; Barletta et al., 2002; Apel et al., 2010), but in a complex emission envi-ronment influenced by intensive paddy stubble fires, the use of propane as a fugitive LPG emission tracer may not be ideal as it is one of the major species (8 % of the total NMHC emis-sions) emitted from the paddy stubble burning.
3.1.2 Fuel evaporative emissions
Figure 1e–h show the normalised source profiles of the whole air samples collected from the headspace of liquefied petroleum gas (LPG), petrol and diesel.
Propane, n-butane, i-butane and butenes were the major constituents of LPG evaporative emissions. Remarkably, the composition was different in both the types of LPG evapo-rative emissions. The domestic LPG evapoevapo-rative emissions were a mixture of propane and butanes, with propane (40 %) as the most dominant emission by weight, followed by n-butane (19 %) and i-n-butane (16 %). However, the commer-cial LPG evaporative emissions were mostly butane rich, with lower propane (7 %) and higher butenes (31 % in to-tal from all isomers). n-butane (37 %) and i-butane (18 %) comprised of nearly half of the total evaporative emissions from commercial LPG cylinders. The most abundant species in petrol evaporative emissions were i-pentane (49 %), n-pentane (12 %), 2,2-dimethylbutane (6 %), 2-methyln-pentane (5 %), n-butane (5 %) and toluene (2 %). The total aromatic content in the petrol vapours was low (4 %), which is con-sistent with previous studies (Harley et al., 2000; Na et al., 2004). Diesel evaporative emissions were quite different from petrol and had a high fraction of heavier C5–C8
alka-nes (55 %) and aromatics (36 %), while unsaturated C2–C6
compounds comprised only about 4 % of the total emissions. The alkane content in our diesel evaporative emissions was 60.6 ± 1.8 % and was comparable to the Guangzhou diesel (53.8 ± 10.0 %), Zhuhai diesel (57.4 ± 5.3 %) and Macau diesel (64.3 ± 1.6 %; Tsai et al., 2006) along with having the characteristic of a higher fraction of heavier alkanes and C8–C10 aromatics. n-octane (8 %), n-heptane (7 %),
o-xylene (6 %), 1,2,4-trimethylbenzene (5 %), i-pentane (5 %), methylcyclopentane (5 %) and toluene (5 %) were the ma-jor species identified in diesel vapours. C8and C9aromatic
compounds were roughly 14 % each of the total emissions and constituted the major fraction of aromatic content in the diesel vapours.
3.1.3 Vehicular exhaust and traffic emissions
Figure 2 shows the normalised source profiles of the whole air samples collected from the exhaust tailpipe of idling vehi-cles with different fuel types and from busy traffic junctions. Among the NMHCs, compressed natural gas (CNG) vehic-ular emissions (Fig. 2a) had 70 % ethane by mass
concen-Figure 2. Normalised source profiles of (a) compressed natural gas (CNG) vehicular exhaust, (b) LPG vehicular exhaust, (c) petrol two-wheeler vehicular exhaust, (d) petrol four-two-wheeler vehicular exhaust, (e) diesel three-two-wheeler vehicular exhaust, (f) diesel four-two-wheeler vehicular exhaust, (g) diesel heavy-duty vehicle (HDV) exhaust and (h) traffic derived from the TD-GC-FID measurements. Error bars represent the standard error of averaged normalised ratio. Grey highlights the aromatics, red the alkenes and alkyne and yellow the alkanes.
tration, which is not surprising considering that it is mostly composed of methane and ethane (Goyal and Sidhartha, 2003). The other major NMHC emissions from CNG exhaust were propane (11 %) and ethene (10 %). Overall, alkanes (87 %) and alkenes (12 %) accounted for almost all NMHC emissions from the CNG vehicles.
Figure 2b shows that LPG vehicular emissions were mainly comprised of low molecular weight alkanes, i.e, C2–C4NMHCs. n-butane (23 %), i-butane (15 %), propane
(13 %), propene (12 %), trans-2-butene (11 %), 1-butene (8 %) and cis-2-butene (6 %) were the major components by mass concentration in these emissions. Alkanes accounted
for 56 % and alkenes 44 % of the total emissions, whereas aromatics were negligible. LPG fuel is known to completely combust at higher driving speeds, and therefore the pres-ence of propane and butanes in the exhaust was indicative of incomplete combustion at the idling stage (Guo et al., 2011). The major compounds in LPG-fuelled vehicle emis-sions found in this study were similar to studies in Taiwan (Chang et al., 2001) and Guangzhou (Lai et al., 2009). One major difference was that n-butane was the most abundant emission in the LPG vehicular exhaust in this study com-pared to propane, which is reported in the aforementioned studies. In Hong Kong, the LPG fuel composition shows a relative ranking of n-butane > propane > i-butane (Tsai et al., 2006). However, in our evaporative emission samples, we observed propane > n-butane > i-butane for domestic LPG cylinders and n-butane > i-butane > propane for commercial LPG cylinders. The differences in our observations, com-pared to the studies from Guangzhou (Lai et al., 2009), Taiwan (Chang et al., 2001) and Hong Kong (Guo et al., 2011), regarding the higher fraction of butanes as compared to propane in idling vehicular exhaust, could therefore be be-cause of different engine technology/efficiency and combus-tion condicombus-tions in addicombus-tion to the fuel composicombus-tion.
Figure 2c–d show the averaged vehicular emissions for two wheelers and four wheelers fuelled by petrol. Aromat-ics (44 %) and alkanes (42 %) were the major constituents of emissions from petrol vehicles, with toluene (15 %), i-pentane (11 %), m/p-xylene (10 %), benzene (4 %), 2,2-dimethylbutane (4 %) and acetylene (4 %) being the most abundant NMHC species. These results are also similar to the studies conducted in Taiwan (Chang et al., 2001) and the Pearl River Delta (Liu et al., 2008). The two-wheeler motorbikes and scooters have different motor engines pared to the four-wheeler vehicles and are known to com-bust the fuel inefficiently, resulting in high VOC emissions (Costagliola et al., 2014; Dröge et al., 2011; Liu et al., 2008; Tsai et al., 2014). Furthermore, they comprise nearly 73 % of the registered Indian vehicular fleet (MoRTH, 2018) and dominate the emissions from the road transport sector. Therefore, we present the normalised profiles of two wheel-ers and four wheelwheel-ers separately to undwheel-erstand the emission profiles and to assess their impact on regional air quality. The emissions from the tailpipes of two wheelers majorly comprised of toluene (16 %), i-pentane (11 %), m/p-xylene (10 %), acetylene (6 %), ethylbenzene (5 %), benzene (4 %) and 2,2-dimethylbutane (4 %). These NMHCs were also present in the emissions from four-wheeler vehicles, which were comprised of toluene (13 %), i-pentane (10 %), m/p-xylene (10 %), benzene (7 %), 2,2-dimethylbutane (5 %) and ethane (5 %). Higher fractions of C2–C4alkanes were
mea-sured in four wheelers and were primarily dominated by ethane. A high content of BTEX (34 %) in petrol exhaust emissions is also noteworthy, considering their potential im-pact on air quality and human health.
Figure 2e–g show the tailpipe emissions from light-duty three wheelers, light-duty four wheelers and heavy-duty ve-hicles fuelled by diesel. The diesel exhaust emission pro-files were much simpler than the petrol exhaust emissions. Alkenes and acetylene were the major constituents of the diesel vehicular exhaust, contributing 58 % to the total NMHC emissions. Furthermore, the BTEX (16 %) and C6
-C8(8 %) emissions were also lower than the petrol exhaust
emissions. Diesel engines are known for their better combus-tion efficiency (Reiter and Kockelman, 2016), due to which most of the higher hydrocarbons are combusted and yield the characteristic source profile of diesel exhaust contain-ing ethene (26 %), propene (14 %) and acetylene (11 %) by weight percent (Liu et al., 2008; Schauer et al., 1999). There were no major differences in the profiles of the different types of diesel vehicles and ethene, propene, acetylene, benzene, 1,2,3-trimethylbenzene and 1-butene were the most domi-nant NMHCs. However, the fraction of C9–C10 aromatics
was higher in heavy-duty vehicles (19 %) and three wheel-ers (11 %) compared to four wheelwheel-ers (6 %). Since i-pentane was found to be negligible (< 0.5 %) in diesel exhaust, it was identified as an ideal tracer for petrol vehicular emissions, as has also been reported previously (Tsai et al., 2006; Guo et al., 2011).
In comparison to petrol, the diesel exhaust had lower frac-tion of heavier C6–C8alkanes (8 %), which were likely
com-busted. Figure 2h shows the averaged source profile of the whole air sample collected from three busy traffic junctions which therefore represent the ambient traffic emissions mix-ture. Although the Indian vehicular fleet comprises vehicles running on petrol, diesel, LPG and CNG, more than 70 % of on-road vehicles are petrol fuelled (Guttikunda and Mohan, 2014; Goel and Guttikunda, 2015; Prakash and Habib, 2018). Therefore, the petrol vehicular exhaust emissions were ex-pected to dominate the ambient traffic mixing ratios. As the samples were collected during rush hour (afternoon and evening hours) within some of the busiest traffic thorough-fares in two cities (Chandigarh and Mohali) as mentioned in Table 1, the samples were influenced by a sufficiently diverse fleet mixture similar to most Indian cities. The sampling du-ration in each case was ∼ 15 min; therefore, they are not bi-ased by few individual vehicles and can be considered to be representative of the ambient city traffic emissions. These samples are not representative of highway emissions which, on the other hand, tend to be dominated by light-duty diesel vehicles and heavy-duty diesel vehicles. While more samples collected in other seasons in addition to spring would have been better, as combustion as environmental conditions can affect variability of emissions, changes in terms of the major compound mixture emitted are unlikely. In addition, since the traffic samples were collected from busy traffic junc-tions, these were more likely to be influenced by the emis-sions in the vehicular idling condition, as discussed earlier. Alkanes (51 %) and aromatics (34 %) formed a major frac-tion of the traffic emissions. Major NMHC species measured
Table 2. Compound-specific precision errors (%), limit of detection (LOD; in parts per trillion – ppt) and total measurement uncertainties (%). Note: ppb – parts per billion.
Compounds Precision Precision LOD Uncertainty Compounds Precision Precision LOD Uncertainty
at 1 ppb at 5 ppb (ppt) (%) at 1 ppb at 5 ppb (ppt) (%) (%) (%) (%) (%) Aromatics (n = 16) Benzene 1 0.2 21 5.9 p-Ethyltoluene 1 0.3 9 9.3 Toluene 2 0.3 87 6.2 1,2,3-Trimethylbenzene 2 0.2 104 11.3 Styrene 2 0.4 19 7.0 1,2,4-Trimethylbenzene 1 0.2 56 9.0 m/p-Xylene 1 0.1 45 7.1 1,3,5-Trimethylbenzene 3 0.2 14 9.0 o-Xylene 2 0.2 24 5.8 i-Propylbenzene 2 0.3 7 6.6 Ethylbenzene 1 0.3 41 6.5 n-Propylbenzene 1 0.2 8 8.0 m-Ethyltoluene 1 0.4 9 8.8 m-Diethylbenzene 1 0.1 5 12.3 o-Ethyltoluene 2 0.3 9 8.9 p-Diethylbenzene 2 0.1 17 14.7 Alkyne (n = 1) Acetylene 5 0.2 64 5.9 Alkenes (n = 10) Ethene 6 0.3 103 5.9 Isoprene 3 0.2 4 6.0 Propene 4 0.3 47 5.8 1-Pentene 2 0.1 2 5.8 1-Butene 3 0.2 3 5.8 trans-2-Pentene 1 0.2 4 5.8 trans-2-Butene 2 0.3 18 6.0 cis-2-Pentene 2 0.2 2 5.8 cis-2-Butene 1 0.2 8 5.8 1-Hexene 2 0.3 4 5.8 Alkanes (n = 22) Ethane 3 0.3 15 7.3 n-Hexane 2 0.5 3 5.8 Propane 5 0.2 20 5.8 2-Methylpentane 1 0.2 2 5.8 n-Butane 2 0.1 3 5.8 3-Methylpentane 1 0.2 3 5.8 i-Butane 4 0.2 6 5.8 2-Methylhexane 2 0.2 15 5.8 i-Pentane 2 0.2 4 7.3 3-Methylhexane 2 0.3 7 5.8 n-Pentane 1 0.1 4 5.8 2,3-Dimethylpentane 1 0.1 1 5.8 Cyclopentane 1 0.2 3 6.3 2,4-Dimethylpentane 2 0.2 11 5.8 Cyclohexane 1 0.2 2 5.8 n-Heptane 2 0.3 15 5.9 Methylcyclopentane 2 0.3 13 5.8 n-Octane 3 0.2 103 5.8 2,2-Dimethylbutane 2 0.2 4 5.8 2-Methylheptane 2 0.2 85 5.8 2,3-Dimethylbutane 1 0.1 2 5.8 3-Methylheptane 4 0.2 81 5.8
from the traffic were i-pentane (15 %), toluene (11 %), n-pentane (5 %), m/p-xylene (5 %), 2,2-dimethylbutane (5 %) and acetylene (4 %).
Based on the emission characteristics discussed earlier for each fuel type, petrol vehicles and LPG vehicles were identified as being the most likely sources of i-pentane and propane, respectively, in the traffic plume. Even though the Indian vehicular fleet is dominated by petrol-fuelled vehi-cles, the consumption of diesel in the road transport sec-tor is approximately twice as much as petrol (Sadavarte and Venkataraman, 2014; Prakash and Habib, 2018). This is be-cause the maximum diesel consumption (40 %) is by heavy-duty vehicles (HDVs) which run over large distances across intercity highways and have lower mileage than other vehicle classes.
In the past three decades, India has undergone rapid eco-nomic and industrial growth, which in turn has resulted in increased consumption of diesel to sustain the increased
freight transport across the country (Nielsen, 2013). As dis-cussed previously, the diesel vehicular exhaust and evapo-rative emissions were dominated by heavier C6–C8alkanes,
alkenes and aromatics, which are key precursors in OH reac-tivity and ozone formation. Furthermore, secondary organic aerosols (SOAs) formed from the diesel vehicular exhaust are estimated to be 2–7 times more than petrol vehicular exhaust in urban areas where diesel generally accounts for 10 %–30 % of total on-road fuel consumption (Gentner et al., 2012).
It was estimated that in 2009 the transport sector con-tributed 694 Gg of particulate matter (PM) emissions in In-dia, > 70 % of which came from vehicles fuelled by diesel (Sahu et al., 2014). Since LPG and CNG vehicular emis-sions are mostly comprised of C2–C4 alkanes and alkenes,
they have lower SOA formation potentials than petrol and diesel (Derwent et al., 2010) and, therefore, have emerged as cleaner fuel alternatives. However, the emission of a large
suite of reactive unsaturated NMHCs due to improper com-bustion of these fuels results in high OH reactivity and OFP, which can severely impact local air chemistry and quality. Therefore, in order to mitigate the emissions, the use of improved technologies (for better combustion and emission reduction, like catalytic convertors), cleaner fuels (Bharat stage V (BSV) and Bharat stage VI (BSVI); GoI, 2016) and reduced idling times of the vehicles should be encouraged. Also, depending on which type of pollution is more acute (PM or gaseous), promoting the appropriate less-polluting fuel type for more usage could help to reduce the overall am-bient pollution.
3.2 Assessment of OH reactivity, ozone formation potential (OFP) and BTEX loading from different emission sources
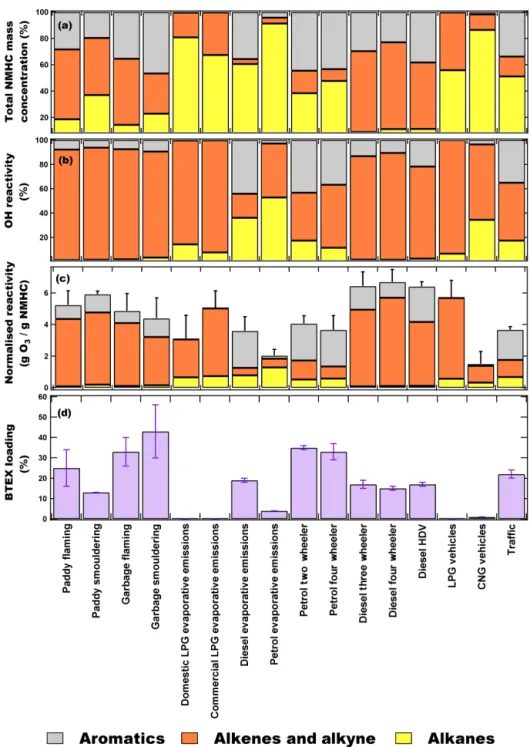
Figure 3a–d show the comparison of the percentage contri-bution of different chemical classes of NMHCs to the total mass concentrations, OH reactivity (s−1), normalised reac-tivity (gO3/gNMHC) and total BTEX loading (%) from
vari-ous emission sources. The hydroxyl radical reactivity reflects the total pollutant loading of the air mass (Sinha et al., 2012) and was calculated using Eq. (2) as follows:
Total NMHC OH reactivity = 6kOH+NMHCi[NMHCi], (2)
where kOH+NMHCi is the first-order rate coefficient for the
reaction of NMHCi with OH radicals (Atkinson et al., 1982,
2006), and [NMHCi] is the measured concentration of the
NMHC.
The ozone formation potential (OFP) is used as a met-ric to measure the contribution of NMHCs to the total O3
formation potential in urban environments (Carter, 1994). Normalised reactivity R (gO3/gNMHCs emitted) is
gener-ally used to indicate OFP for NMHCs from emission sources using their source profiles and maximum incremental reac-tivity (MIR) values, using Eq. (3) as follows (Harley et al., 2000; Zhang et al., 2013):
R = 6iωi × (MIRi) , (3)
where ωi are the weight percentage of NMHCi present in
the emission source, and MIRiare the maximum incremental
reactivity coefficients (Carter, 1994, 2009).
In order to ascertain any statistical difference between the average OFPs of the emission sources, we carried out Tukey’s pairwise honestly significant difference test (which accounts for sample size), and the summary of the test results is provided in Table S5. Based on the statistical test, it could be concluded with more than 95 % confidence that CNG vehicular emissions and the fuel evaporative emissions had different OFPs compared to other emission sources. The averaged OFP for the emission sources was diesel vehicle exhaust (6.5 ± 0.6 gO3/gNMHC),
smouldering paddy stubble fire (5.9 ± 0.2 gO3/gNMHC),
LPG vehicle exhaust (5.7 ± 1.1 gO3/gNMHC),
flam-ing paddy stubble fire (5.2 ± 0.9 gO3/gNMHC), flaming
garbage fire (4.9 ± 1.1 gO3/gNMHC), smouldering garbage
fire (4.4 ± 1.3 gO3/gNMHC), LPG evaporative
emis-sions (4.5 ± 1.6 gO3/gNMHC), petrol vehicle exhaust
(3.9 ± 0.7 gO3/gNMHC), diesel evaporative emissions
(3.6 ± 0.9 gO3/gNMHC), petrol evaporative emissions
(2.0 ± 0.4 gO3/gNMHC) and CNG vehicle exhaust
(1.5 ± 0.8 gO3/gNMHC). Although, alkenes were not
the largest emissions by mass, they were still the largest contributor to the OH reactivity (67 %–93 %) and OFP (70 %–83 %) in the fire and LPG evaporative emissions. In the paddy stubble and garbage fire emissions, alkenes and aromatics had the largest contribution to the total OH reactivity (∼ 90 % and 6 %–9 %, respectively) and OFP (70 %–82 % and 16 %–27 %, respectively). Alkanes have comparatively poor reactivity towards OH radical, and there-fore, despite contributing 15 %–37 % to the total NMHC mass concentration, their contribution to the OH reactivity was very low (< 3 %).
In paddy stubble fires under flaming conditions, propene (33 %), and under smouldering conditions, isoprene (46 %), were the largest contributors to the total OH reactivity (de-tails in Figure S5 and S6). These two NMHCs were also the largest contributors (∼ 40-50 % in total) to the OFP from paddy stubble fires. In garbage fires under both flaming and smouldering conditions, propene was the largest contributor to the OH reactivity (46 % and 42 %, respectively) and OFP (37 % and 30 %, respectively).
LPG evaporative and vehicular exhaust emissions com-prised of 68 %–81 % and 56 % alkanes, respectively; how-ever, > 90 % of total OH reactivity was contributed by the alkenes. Butenes were the largest contributors to total OH re-activity from domestic LPG evaporative, commercial LPG evaporative and LPG vehicular exhaust emissions (90 %, 79 % and 72 %, respectively) and OFP (71 %, 83 % and 59 %, respectively). A total of 81 % of NMHC emissions from CNG vehicular exhaust were C2–C3alkanes, but the
max-imum contribution to the total OH reactivity and OFP was from ethene (47 % and 62 %, respectively).
In diesel evaporative emissions there was approximately equal contribution to the total OH reactivity from alkanes (36 %) and aromatics (44 %). This is because of the presence of larger fractions of heavier C5–C8branched alkanes, which
are generally more reactive towards OH radicals compared to the light C2–C4 alkanes. While the rate coefficient
val-ues of C2–C4alkanes vary between (0.25–2.12) × 10−12cm3
molecule−1s−1at 298 K, the rate coefficient values of C5–C8
alkanes are between (3.6-8.9) × 10−12cm3 molecule−1s−1 at 298 K. The largest contributors to the total OH reactiv-ity were the trans-2-butene (10 %) and 1,2,4-trimethylbenzne (9 %), while 1,2,4-trimethylbenzene (13 %) and o-xylene (12 %) dominated the OFP from diesel evaporative sions. OH reactivity from diesel vehicular exhaust emis-sions, however, were dominated by alkenes (> 75 %), and
Figure 3. Comparison of the contribution of chemical compositions in groups (aromatics, alkene and alkyne and alkanes) to (a) NMHC mass concentrations, (b) OH reactivity (s−1) and (c) normalised reactivity (gO3/gNMHC). (d) Benzene, toluene, ethylbenzene and xylenes (BTEX) loading (%) from various emission sources. Error bars represent the standard error of average ozone formation potential (OFP) and BTEX fraction.
propene (32 %–39 %) and ethene (23 %–31 %) were the largest contributors in all the diesel vehicle categories. Both of these NMHCs also contributed > 50 % to the total OFP calculated from diesel vehicular exhaust. In petrol evapo-rative emissions, the largest contribution to the OH reac-tivity was i-pentane (∼ 30 %), pentene (22 %) and butene (20 %) isomers. However, in petrol vehicular exhaust both aromatics and alkenes became the dominant contributors
(∼ 40 %–50 % each) to OH reactivity and the major contrib-utors were propene (14 %–23 %), m/p-xylene (11 %–13 %), styrene (8 %–11 %), ethene (6 %–13 %) and toluene (7 %). For OFP from petrol vehicular exhausts, the largest con-tributing NMHCs were m/p-xylene (24 %–26 %) > toluene (14 %–16 %) > propene (5 %–9 %) > ethene (6 %–9 %).
The total OH reactivity from traffic emissions was domi-nated by alkenes (48 %) and aromatics (35 %). The NMHCs
contributing the largest fractions to the total OH reac-tivity were styrene (9 %) > trans-2-butene (9 %) > isoprene (7 %) > 1-hexene (6 %) ∼ m/p-xylene (6 %) ∼ propene (6 %) and to OFP were m/p-xylene (14 %) > toluene (12 %) > 1,2,4-trimethylbenzene (7 %) ∼ ethene (7 %) > i-pentane (6 %). High contributions to OH reactivity from styrene, isoprene and 1-hexene are noteworthy. Even though these compounds were not the most abundant in the traffic samples by mass concentration, they are, how-ever, very reactive with hydroxyl radicals in ambient air (isoprene – kOH=10.0 × 10⁻¹¹cm3 molecule−1s−1;
styrene – kOH=5.8 × 10⁻¹¹cm3molecule−1s−1; 1-hexene
– kOH=3.7 × 10⁻¹¹cm3molecule−1s−1at 298 K; Atkinson
et al., 1989; Atkinson, 1997). Isoprene, styrene and 1-hexene have been reported previously in various traffic and tunnel experiments across the world (Mugica et al., 1998; Borbon et al., 2001; Barletta et al., 2002; Ho et al., 2009; Zhang et al., 2018). Our traffic samples have comparable mixing ratios of isoprene observed from roadside ambient air mea-surements in Karachi (1.2 ± 0.9 ppb; Barletta et al., 2002), 43 Chinese cities (0.86 ± 0.83 ppb; Barletta et al., 2005) and Longchuan tunnel, Hefei (0.47 ± 0.20 ppb; Deng et al., 2018), but higher than Chapultepec Avenue tunnel, Mex-ico City (0.17 ± 0.02 ppb; Mugica et al., 1998), and the Fu Gui Mountain tunnel (0.14 ± 0.36 ppb; Zhang et al., 2018). In the Hong Kong tunnel experiment (Ho et al., 2009) and Taipei tunnel experiment (Hwa et al., 2002), isoprene was, however, undetectable. This variability in isoprene emissions from traffic/vehicular exhaust has been previously attributed to variable fuel types, vehicular engines and maintenance, driving patterns and sampling strategies.
The mixing ratios of styrene and 1-hexene measured in our traffic samples were higher than the Fu Gui Mountain tun-nel (styrene – 0.08 ± 0.00 ppb; 1-hexene – 0.07 ± 0.00 ppb) but comparable to 1-hexene reported from Taiwan tunnels (Cross Harbour tunnel (0.99 ± 0.20 ppb), Chung-Bor tunnel (3.29 ± 2.36 ppb) and Chung-Cheng tunnel (2.49 ± 1.27 ppb; Chen et al., 2003). Though high mixing ratios of styrene are remarkable, it has been previously reported that styrene is one of the major VOCs emitted from diesel light-duty vehi-cles (LDVs), especially in cold transient mode (Tsai et al., 2012). Amongst our traffic samples, maximum mixing ra-tios of isoprene (1.11 ± 0.06 ppb), styrene (2.31 ± 0.16 ppb) and 1-hexene (2.38 ± 0.14 ppb) were observed in Transport Chowk (30.717◦N, 76.812◦E) which is one of the busiest traffic junction in Chandigarh during rush hours and wit-nesses a large vehicular fleet of diesel-run commercial LDVs. In order to assess the health risks associated with these sources, we compared the fraction of BTEX compounds in each of the emission sources. Benzene is classified as a hu-man carcinogen (IARC, 2012), the potential health risk as-sessments of which have already been elucidated in NW-IGP during the periods influenced by intense paddy stub-ble fires (Chandra and Sinha, 2016). Other benzenoids like toluene and xylenes have also been associated with adverse
effects on human health (ATSDR, 2000, 2007) and are clas-sified as group “D” carcinogens by the US Environmental Protection Agency (EPA). Using the BTEX fraction, which is a well-known metric (Słomi´nska et al., 2014), is use-ful for comparing the mass fractional BTEX content of the emission sources. The statistical differences in the average BTEX fraction between the different emission sources were ascertained by Tukey’s pairwise honestly significant differ-ence test, and the summary for this information is pro-vided in Table S6. Based on the statistical test, it could be concluded with more than 95 % confidence that diesel and petrol evaporative emissions, diesel vehicles and smoulder-ing paddy fires had different average BTEX fractions com-pared to other emission sources. Out of 28 possible pair-wise comparisons, 14 pairs show statistically significant dif-ferences with ≥ 2σ confidence, three are only significant at 1σ level and the rest were not significant. The fraction of BTEX in the different emission sources was petrol vehi-cle exhaust (27 ± 5 %), smouldering garbage fire (26 ± 1 %), flaming garbage fire (24 ± 8 %), flaming paddy stubble fire (22 ± 5 %), diesel vehicle exhaust (19 ± 2 %), diesel evapo-rative emissions (17 ± 2 %), smouldering paddy stubble fire (13 ± 1 %) and petrol evaporative emissions (3 ± 1 %). LPG and CNG emission sources had < 1 % of benzene and, there-fore, were identified as least harmful sources, while petrol vehicular exhaust, garbage fires and paddy stubble fires were the most toxic emissions which could severely impact human health considering their BTEX emission potential.
3.3 Molar emission ratios of NMHCs in different emission sources
Inter-NMHC molar ratios (ppb/ppb) are very useful tools that can not only be used to distinguish between different emis-sion sources but also constrain the identity of the sources affecting ambient mixing ratios in a complex environment (Barletta et al., 2005, 2017). This is because, for the NMHC species with similar chemical lifetimes, the molar ratios re-main preserved during chemical oxidation and ambient di-lution (Parrish et al., 1998; Jobson et al., 1999). Further-more, NMHC molar ratios that remain similar across sources can also be employed to assess the photochemical age of air masses.
Table 3 lists the commonly used inter-NMHC molar emis-sion ratios for the emisemis-sion sources studied in this work. The toluene / benzene (T / B) ratio is a widely used ratio in identifying vehicular emission sources (Barletta et al., 2002, 2005). The T / B measured for traffic in this study was 3.54 ± 0.21 which is comparable to previous studies from busy traffic junctions in Karachi (2.2 ± 2.9; Barletta et al., 2002), Hong Kong (3.0 ± 0.4; Huang et al. 2015), Okhla, New Delhi (2.3 ± 1.7; Hoque et al. 2008), Antwerp, Bel-gium (3.5 ± 0.2; Buczynska et al. 2009), and Nanjing, China (2.6 ± 0.9; Wang et al. 2008). For the idling vehicular ex-hausts of different fuel types, this ratio varied between 0.38
T able 3. Characteristic inter -NMHC molar ratios (ppb/ppb) for the whole air samples collected from paddy stubble fires, g arbage fires , ev aporati v e fuel emissions (petrol, diesel and LPG), and traf fic and v ehicular exhaust from dif ferent fuel types (petrol, diesel, LPG and CNG). Emission ratio P addy P addy Garbage Gar bage Ev aporati v e emissions T raf fic V ehicular exhaust emissions (ppb/ppb) stubble stubble b urning b urning b urning b urning (F) (S) (F) (S) Petrol Diesel LPG Petrol Dies el LPG CNG T oluene / Benzene 0.38 1.40 0.26 0.59 3.13 2.88 3.41 3.54 3.68 0.38 0.59 10.90 (0.11) (0.10) (0.07) (0.16) (0.34) (0.38) (0.55) (0.21) (0.58) (0.02) (0.17) (2.98) i-Butane / n -Butane 0.41 0.26 0.24 0.22 0.34 0.35 0.79 0.48 0.50 0.38 0.73 0.77 (0.13) (0.00) (0.10) (0.04) (0.02) (0.02) (0.13) (0.03) (0.12) (0.02) (0.08) (0.11) i-Pentane / n -Pentane 1.46 0.56 0.06 0.12 4.13 1.84 12.13 2.83 3.27 1.42 14.99 3.45 (0.71) (0.02) (0.02) (0.04) (0.08) (0.13) (2.56) (0.17) (0.19) (0.10) (2.69) (0.32) Propane / n -Butane 8.05 4.30 2.81 2.99 0.04 0.21 1.61 0.58 0.64 3.72 0.89 8.93 (3.17) (0.04) (0.28) (0.28) (0.01) (0.02) (0.47) (0.05) (0.11) (0.35) (0.18) (3.01) Propene / Ethene 0.55 1.52 0.79 1.06 3.38 0.27 14.74 0.38 0.64 0.40 7.22 0.06 (0.14) (0.02) (0.15) (0.23) (3.38) (0.11) (11.78) (0.10) (0.06) (0.02) (3.64) (0.02) trans-2-Butene / cis-2-Butene 1.28 1.33 1.32 1.42 2.51 1.89 1.82 1.80 1.90 1.35 1.93 1.71 (0.03) (0.02) (0.03) (0.04) (0.39) (0.03) (0.09) (0.07) (0.60) (0.02) (0.17) (0.16) trans-2-Pentene / cis-2-Pentene 1.53 1.83 1.74 1.54 2.83 2.91 1.70 2.04 4.56 1.65 1.51 0.99 (0.05) (0.05) (0.02) (0.14) (0.28) (0.63) (0.43) (0.07) (2.54) (0.05) (0.08) (0.31) Styrene / 1,3,5-TMB 1.77 1.45 3.29 2.29 7.42 1.48 1.68 3.73 4.19 1.48 2.67 2.10 (0.32) (0.04) (1.13) (1.10) (0.83) (0.19) (0.45) (0.76) (0.31) (0.27) (0.37) (0.18) 1,2,3-TMB / 1,2,4-TMB 6.70 8.36 0.68 1.39 2.17 0.33 0.74 1.78 8.37 1.21 3.49 3.29 (3.35) (1.37) (0.35) (0.49) (1.46) (0.02) (0.53) (0.55) (0.89) (0.64) (1.62) (2.05) Note: TMB – trimeth ylbenzene; F – flaming; S – smouldering.
and 10.9 and was 3.68 ± 0.58 for petrol vehicles, which is consistent with the previous works of Guo et al. (2011; 2.0– 3.8). For the diesel vehicles, the T / B ratio in our study was 0.37 ± 0.20, which is similar to the average T / B ratio (0.37) from diesel vehicles in Australia (Anyon et al., 2003), Ger-many (0.56; Siegl et al., 1999) and Tokyo (0.3; Yamamoto et al., 2012). Furthermore, T / B ratios can also be useful for distinguishing the paddy stubble fire emissions in the flaming (0.38 ± 0.11) and smouldering stages (1.40 ± 0.10).
The i-butane / n-butane ratio (B / B) is another example of a widely used NMHC ratio for distinguishing between dif-ferent fossil-fuel-related emission sources. However, in our study, we found that this ratio is not useful in a complex emission environment influenced by varied emission sources. This is because the ratio exhibits similar values (0.20–0.30) for paddy stubble fires, garbage fires, petrol evaporative, diesel evaporative and petrol vehicle exhaust and diesel ve-hicle exhaust emissions. Therefore, caution should be taken while using this ratio in complex emission environments where biomass burning, fossil fuel combustion and biogenic emission sources simultaneously occur on a significant scale and strength to contribute to the chemical composition of ambient air. i-pentane / n-pentane can, instead, be used as a more reliable ratio for distinguishing biomass burning emis-sions (0.06–1.46) from the petrol dominated traffic and fossil fuel emissions (2.83–4.13).
4 Conclusions
Comprehensive chemical speciation source profiles of 49 NMHCs (22 alkanes, 16 aromatics, 10 alkenes and one alkyne) were obtained for several major emission sources, namely paddy stubble burning, garbage burning, idling ve-hicular exhaust and evaporative fuel emissions. Many of these compounds, like the higher C6–C8 alkanes, C9–C10
aromatics and alkenes, have been quantified for the first time for these emission sources in the South Asian region, which is important for ascertaining the region-to-region variability of such common urban and agricultural emission sources. The work highlights the importance of identifying the lo-cal emission source profiles, as some NMHC emissions were found to be very different to the studies reported from North America, Europe and East Asia. Some of the major findings which provide new insights are as follows:
i. Propane was found to be one of the abundant NMHC compounds in paddy stubble fire emissions. This is in contrast to the existing literature which considers it as a tracer for fugitive LPG emissions. In a complex emission environment influenced by several sources like paddy fires, the use of propane as an LPG tracer there-fore calls for caution.
ii. Propene emissions in smouldering fires were found to be more than ethene by ∼ 1.6 times, which is in contrast
to the existing crop residue burning inventories which have ethene as the more abundant compound.
iii. Isoprene was identified as a reliable tracer for distin-guishing between the paddy fires and garbage fires at night.
iv. Compositional differences in the evaporative emissions from the two types of LPG (commercial and domestic) used widely in South Asia were also identified. While propane was the most dominant NMHC in the domestic LPG vapours, the commercial LPG vapours were dom-inated by butanes.
v. Toluene / benzene ratios were identified as being good tracers to distinguish the paddy stubble fire emis-sions in flaming (0.38 ± 0.11) and smouldering stages (1.40 ± 0.10), garbage burning emissions (0.26–0.59) and traffic emissions (3.54 ± 0.21).
vi. The i-butane / n-butane ratio was found to be simi-lar (0.20–0.30) for many sources, and therefore, cau-tion must be taken while using it in complex emis-sion environments. Instead, the i-pentane / n-pentane ratio turned out to be a better tracer for distinguish-ing biomass burndistinguish-ing emissions (0.06–1.46) from petrol-dominated traffic and fossil fuel emissions (2.83–4.13). These source profiles can be used for accurate and reliable emission calculations, source apportionment studies and to assess the choice of fuels from the point of view of air qual-ity impacts, both as primary emission sources and also their potential to form secondary air pollutants like ozone and par-ticulate matter. Ambient traffic emissions were found to be dominated by the petrol exhaust emissions due to the typ-ically higher fraction of petrol-fuelled vehicles among the on-road intracity vehicular fleet in India. The potential tox-icity and health impacts of the emission sources were as-sessed by using the BTEX fraction as a metric, and petrol exhaust, paddy stubble fires and garbage fires were ranked higher in toxicity than other emissions, based on this met-ric. Based on our limited measurements of ambient ben-zene in the traffic thoroughfares, the mass concentration was 6.1 ± 1.3 µg m−3, which is higher than the 5 µg m−3annual exposure limit set in the National Ambient Air Quality Stan-dards (NAAQS) of India (NAAQS, 2009). Future studies should quantify the annual ambient exposure of such toxic compounds from the sources which have a high BTEX con-tent to assess compliance with the annual ambient air qual-ity standards as has previously been done for paddy residue smoke (Chandra and Sinha, 2016). The diesel and petrol ve-hicular exhaust emissions, paddy stubble fire and garbage fire emissions were identified as being the most polluting emis-sion sources in terms of OH reactivity and ozone formation potentials. Although LPG and CNG vehicular exhaust emis-sions were cleaner, they were comprised of large fractions of alkenes due to the improper combustion of fuels. Thus, they
can impact local air quality and atmospheric chemistry, and therefore, the use of improved VOC scrubbing technologies, cleaner fuels and reduced idling times of the vehicles should be promoted.
The results and insights obtained from this study will aid in the identification of factor profiles in source apportionment models, such as positive matrix factorisation, yielding more accurate quantitative data for the mitigation of ambient air pollution.
Data availability. Data are available from the corresponding author upon request.
Supplement. The supplement related to this article is available on-line at: https://doi.org/10.5194/acp-20-12133-2020-supplement.
Author contributions. VS and AK conceived and designed the study. AK carried out the sample collection, field work and per-formed TD-GC-FID measurements with the help of MS and HH and the advice of BB concerning the analytical system. AK carried out the preliminary analysis and wrote the first draft. VS revised the paper and carried out the advanced analyses and interpretation of the data and supervised all experimental aspects of the work. VG par-ticipated in the discussion of the analytical system and commented on the paper.
Competing interests. The authors declare that they have no conflict of interest.
Acknowledgements. We acknowledge the IISER Mohali Atmo-spheric Chemistry Facility for the data and the Ministry of Human Resource Development (MHRD), India, for funding the facility. Ashish Kumar, Haseeb Hakkim and Muhammed Shabin acknowl-edge MHRD and IISER Mohali for the doctoral (SRF and JRF) fel-lowships. We acknowledge EGU for the waiver of the APC through the EGU 2019 OSPP award to Ashish Kumar. We also thank Baer-bel Sinha (Department of Earth and Environmental Sciences, Indian Institute of Science Education and Research, Mohali) and the two anonymous reviewers for their helpful suggestions and insightful comments which helped to improve the paper. We also acknowl-edge the help and support of the members of IISER Mohali At-mospheric Chemistry facility, namely Harshita Pawar, Pallavi, Ab-hishek Mishra, AbAb-hishek Verma, Bharti Sohpaul and Tess George for their technical assistance during field sampling.
Financial support. This research has been supported by the Na-tional Mission on Strategic knowledge for Climate Change (NMSKCC) MRDP Program of the Department of Sci-ence and Technology, India vide grant (SPLICE; grant no: DST/CCP/MRDP/100/2017(G)).
Review statement. This paper was edited by Eliza Harris and re-viewed by two anonymous referees.
References
ACTRiS: WP4-NA4: The ACTRIS measurement guidelines for submission of VOC data, available at: https://actris.nilu.no/ Content/?pageid=68159644c2c04d648ce41536297f5b93 (last access: 19 December 2019), 2014.
Akagi, S. K., Yokelson, R. J., Wiedinmyer, C., Alvarado, M. J., Reid, J. S., Karl, T., Crounse, J. D., and Wennberg, P. O.: Emis-sion factors for open and domestic biomass burning for use in atmospheric models, Atmos. Chem. Phys., 11, 4039–4072, https://doi.org/10.5194/acp-11-4039-2011, 2011.
Andreae, M. O.: Emission of trace gases and aerosols from biomass burning – an updated assessment, Atmos. Chem. Phys., 19, 8523–8546, https://doi.org/10.5194/acp-19-8523-2019, 2019. Anyon, P., Pattison, B.-A., and Trompp, W.: Toxic emissions from
diesel vehicles in Australia, Technical Report No. 1, Parsons Australia Pty Ltd, Environment Australia, 2003, available at: https://p2infohouse.org/ref/37/36467.pdf, last access: 4 Septem-ber 2020.
Apel, E., Emmons, L., Karl, T., Flocke, F., Hills, A., Madronich, S., Lee-Taylor, J., Fried, A., Weibring, P., and Walega, J.: Chemical evolution of volatile organic compounds in the outflow of the Mexico City Metropolitan area, Atmos. Chem. Phys., 10, 2353– 2375, https://doi.org/10.5194/acp-10-2353-2010, 2010. Atkinson, R.: Gas-phase tropospheric chemistry of volatile organic
compounds: 1. Alkanes and alkenes, J. Phys. Chem. Ref. Data, 26, 215–290, 1997.
Atkinson, R.: Atmospheric chemistry of VOCs and NOx, At-mos. Environ., 34, 2063–2101, https://doi.org/10.1016/S1352-2310(99)00460-4, 2000.
Atkinson, R., Aschmann, S. M., Winer, A. M., and Pitts Jr, J. N.: Rate Constants for the Reaction of OH Radicals with a Series of Alkanes and Alkenes at 299 ± 2 K, Int. J. Chem. Kinet., 14, 507–516, https://doi.org/10.1002/kin.550140508, 1982. Atkinson, R., Baulch, D., and Cox, R.: J. Phys. Chem. Ref. Data,
Monograph, 1, 1–246, 1989.
Atkinson, R., Baulch, D., Cox, R., Crowley, J., Hampson, R., Hynes, R., Jenkin, M., Rossi, M., Troe, J., and Subcommittee, I.: Evaluated kinetic and photochemical data for atmospheric chem-istry: Volume II – gas phase reactions of organic species, Atmos. Chem. Phys., 6, 3625–4055, https://doi.org/10.5194/acp-6-3625-2006, 2006.
ATSDR (The Agency for Toxic Substances and Disease Reg-istry): U.S. Department of Health and Human Services. Toxi-cological Profile For Toluene, available at: http://www.atsdr.cdc. gov/toxprofiles/tp.asp?id=161&tid=29 (last access: 4 September 2020), 2000.
ATSDR (The Agency for Toxic Substances and Disease Reg-istry): U.S. Department of Health and Human Services. Toxi-cological Profile For Xylene, available at: http://www.atsdr.cdc. gov/toxprofiles/tp.asp?id=296&tid=53 (last access: 4 September 2020), 2007.
Badarinath, K., Chand, T., and Prasad, V. K.: Agriculture crop residue burning in the Indo-Gangetic Plains – A study using IRS-P6 AWiFS satellite data, Current Sci., 91, 1085–1089, 2006.


![[PDF] Formation Word perfectionnement | Télécharger PDF](data:image/gif;base64,R0lGODlhAQABAIAAAP///wAAACH5BAEAAAAALAAAAAABAAEAAAICRAEAOw==)