HAL Id: hal-02277048
https://hal.archives-ouvertes.fr/hal-02277048
Submitted on 3 Sep 2019
HAL is a multi-disciplinary open access
archive for the deposit and dissemination of
sci-entific research documents, whether they are
pub-lished or not. The documents may come from
teaching and research institutions in France or
abroad, or from public or private research centers.
L’archive ouverte pluridisciplinaire HAL, est
destinée au dépôt et à la diffusion de documents
scientifiques de niveau recherche, publiés ou non,
émanant des établissements d’enseignement et de
recherche français ou étrangers, des laboratoires
publics ou privés.
A genome-wide association study identifies genetic loci
associated with specific lobar brain volumes
Sven van der Lee, Maria Knol, Ganesh Chauhan, Claudia Satizabal, Albert
Vernon Smith, Edith Hofer, Joshua Bis, Derrek Hibar, Saima Hilal, Erik van
den Akker, et al.
To cite this version:
Sven van der Lee, Maria Knol, Ganesh Chauhan, Claudia Satizabal, Albert Vernon Smith, et al..
A genome-wide association study identifies genetic loci associated with specific lobar brain volumes.
Communications Biology, Nature Publishing Group, 2019, 2, pp.285. �10.1038/s42003-019-0537-9�.
�hal-02277048�
A genome-wide association study identi
fies genetic
loci associated with speci
fic lobar brain volumes
Sven J. van der Lee
et al.
#Brain lobar volumes are heritable but genetic studies are limited. We performed genome-wide association studies of frontal, occipital, parietal and temporal lobe volumes in 16,016
individuals, and replicated our findings in 8,789 individuals. We identified six genetic loci
associated with specific lobar volumes independent of intracranial volume. Two loci, asso-ciated with occipital (6q22.32) and temporal lobe volume (12q14.3), were previously reported
to associate with intracranial and hippocampal volume, respectively. We identified four loci
previously unknown to affect brain volumes: 3q24 for parietal lobe volume, and 1q22, 4p16.3 and 14q23.1 for occipital lobe volume. The associated variants were located in regions
enriched for histone modifications (DAAM1 and THBS3), or close to genes causing Mendelian
brain-related diseases (ZIC4 and FGFRL1). No genetic overlap between lobar volumes and
neurological or psychiatric diseases was observed. Ourfindings reveal part of the complex
genetics underlying brain development and suggest a role for regulatory regions in deter-mining brain volumes.
https://doi.org/10.1038/s42003-019-0537-9 OPEN
Correspondence and requests for materials should be addressed to H.H.H.A. (email:h.adams@erasmusmc.nl) or to C.D. (email:cdecarli@ucdavis.edu).#A
full list of authors and their affiliations appears at the end of the paper.
123456789
F
our lobes of the human brain are distinguished and several diseases can partially be attributed to lobe-specific structural changes. Functions of the frontal brain lobe include rea-soning, movement, social behavior, planning, parts of speech, andproblem solving1; functions attributed to the parietal lobe include
recognition and perception of stimuli2; functions attributed to the
temporal lobe include memory and speech3; and lastly, visual
input is mainly processed by the occipital lobe. Brain diseases with lobe-specific abnormalities include Alzheimer’s disease (in
particular early onset), frontotemporal lobar degeneration4,
temporal lobe epilepsy5, primary progressive aphasia, and cortical
basilar ganglionic degeneration.
Environmental factors, such as smoking and hypertension,
affect lobar brain volumes6, but previous studies have shown that
genetic differences across individuals also contribute to variability
in volumetric brain measures7,8. The estimated heritability of
brain lobar volumes is high, ranging from 26% to 84% for the frontal lobe, from 32% to 74% for the occipital lobe, from 30% to 86% for the parietal lobe, and from 55% to 88% for the temporal
lobe9–15. In addition, genetic analyses in families suggest that
the lobes are determined by independent genetic factors15.
The observation that brain lobes are highly and differentially heritable makes them compelling targets to unravel the genetic architecture of the brain. Recent large genome-wide association studies (GWAS) have efficiently identified associations between
genetic determinants and volumetric brain measures16,17.
How-ever, to date no genetic variants influencing brain lobar volumes have been identified. GWAS of the four lobar volumes of the brain can contribute to our understanding of brain lobe devel-opment and may provide a biological link between brain lobar volumes and brain-related traits and diseases.
To identify genetic variants of influence on lobar brain volumes, we performed GWAS of four brain lobar volumes in
16,016 individuals and replicated our findings in a sample of
8,789 individuals. We identified six loci significantly associated with specific brain lobar volumes independent of intracranial volume. With this study, we shed light on common genetic var-iants determining human brain volume and allow for a deepened understanding of the genetic architecture of the brain lobes. Results
In total, 16,016 individuals from 19 population-based or family-based cohort study and one case–control study were included in the current study. Additional information regarding the popula-tion characteristics, genotyping, and imaging methods are
pro-vided in the“Methods” section and in Supplementary Data 1–4.
Heritability of lobar brain volumes. Using a family-based
approach, we found an age- and sex-adjusted heritability (h2) for
occipital lobe of 50% (95% confidence interval (CI) 38–62%), for frontal lobe of 52% (95% CI 40–64%), for temporal lobe of 59% (95% CI 49–69%), and for parietal lobe of 59% (95% CI 49–69%)
(all: p≤ 1.9 × 10⁻¹⁹) (Supplementary Data 5). In comparison, the
age- and sex-adjusted heritability estimate for total brain volume
was 34% (95% CI 22–46%, p = 8.8 × 10⁻¹¹).
Novel genetic associations with brain lobar volumes. Our
multi-ethnic meta-analysis (n= 16,016 individuals of which
15,269 were of European ancestry) identified significant
associa-tions between genotypes and brain lobar volumes in five
inde-pendent loci, even though we adjusted for intracranial volume
(Figs.1and2, Table1). The quantile–quantile plots did not show
high genomic inflation (λGC≤ 1.05) (Supplementary Fig. 1). Of
thesefive loci, variants in one locus associated with temporal lobe
volume, in one with parietal lobe volume, and in three with
occipital lobe volume. The variant rs146354218 (12q14.3, pmulti-ethnic= 6.4 × 10⁻¹⁰) associated with temporal lobe volume
and rs2279829 (3q24, pmulti-ethnic= 4.4 × 10⁻¹⁰) associated with
parietal lobe volume. Three loci associated with occipital
lobe volume: index variants rs147148763 (small indel
GTTGT→G, 14q23.1, pmulti-ethnic= 2.9 × 10⁻⁹), rs74921869
(4p16.3, pmulti-ethnic= 6.2 × 10⁻⁹), and rs1337736 (6q22.32, p
multi-ethnic= 4.0 × 10⁻⁸). In the European ancestry-only meta-analysis,
we found a significant association with occipital lobe volume in
one additional independent locus (1q22, rs12411216, pEuropean
ancestry-only= 3.9 × 10⁻⁸). In the multi-ethnic meta-analysis, this
association was below the genome-wide significance threshold (pmulti-ethnic= 1.3 × 10⁻⁷). There was no significant heterogeneity
observed for any of the six significant loci (Supplementary Figs. 2–7). The sensitivity meta-analysis including only the stu-dies using the k-Nearest-Neighbor (kNN) algorithm for mea-suring lobar volumes showed similar results compared to the studies using other methods (Supplementary Figs. 2–7). The index variants of these total six loci were common (minor allele frequency ranging from 0.13 to 0.46) and associations with
volume variations were between 0.48 and 0.95 cm3 per copy of
the variant allele, explaining up to 0.27% of lobar volume variance
per allele (Table1). No variants were significantly associated with
frontal lobe volume. All variants showing significant associations with brain lobar volumes are shown in Supplementary Data 6. Study-specific effects of all six significant loci are shown in Supplementary Figs. 2–7.
Notably, two genome-wide significant variants identified here, rs146354218 and rs2279827, were exclusively associated with the temporal lobe and parietal lobe, respectively (Supplementary Data 7). In contrast, rs147148763 and rs12411216 were not only significantly associated with occipital lobe volume but also appeared to be associated to some extent with parietal lobe
volume (p= 2.5 × 10⁻⁶; variance explained= 0.15% and p =
2.4 × 10⁻⁵; variance explained= 0.11%, respectively). The other
two variants also showed nominally significant associations with other lobar volumes.
Replication. Five out of the six index variants were available in
the imputation reference panel of our replication sample (n=
8,789). Unfortunately, the haplotype reference consortium (HRC) reference panel does not contain insertions and deletions. Therefore, for replication we selected rs76341705, a variant that
showed a comparable signal in the meta-analysis (prs147148763=
2.9 × 10⁻⁹, vs. prs76341705= 4.8 × 10⁻⁹), and in high linkage
dis-equilibrium (LD) with the index variant (R2= 0.99). We were
able to replicate all these six variants at a nominal significance
level (p values ranging from 3.0 × 10⁻² to 8.0 × 10⁻⁷) with the
same direction of effect as the discovery sample (Table 1,
Sup-plementary Fig. 8).
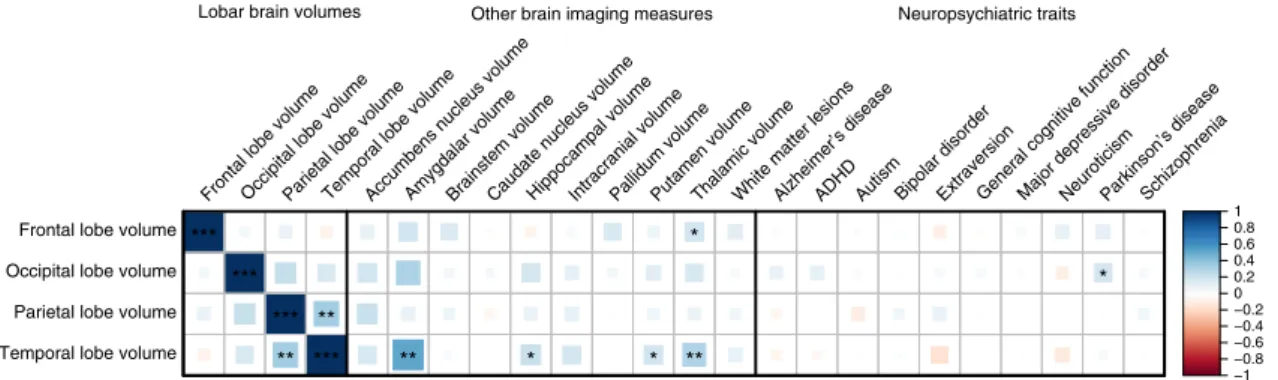
Variance explained in lobar volumes by common variants. Based on the LD score regression single-nucleotide polymorph-ism (SNP)-based heritability analyses, common variants across the whole genome explained as much as 20.3% (95% CI 13.2–27.4%) of the variance in occipital lobe volume, 19.6% (95% CI 12.3–26.9%) of frontal lobe volume, 17.5% (95% CI 10.7–24.3%) of temporal lobe volume, and 17.9% (95% CI 11.7–24.1%) of parietal lobe volume (Supplementary Data 8). Common genetic variants account for 30–41% of the total her-itability of brain lobar volumes (Supplementary Data 8). Genetic overlap with other brain volumes and related diseases. Although no top variant was significantly associated with the
volume of multiple lobes, nominally significant correlation (rg)
10 8 6 4 2 1 2 3 4 5 6 7 8 Chr –Log 10 ( P ) MIR92B/THBS3 ZIC4 FGFRL1 CENPW/RSPO3 DAAM1 MSRB3 9 10 11 12 13 14 15 16 17 18 19 20 21 22
Fig. 1 Common genetic variants associated with frontal, parietal, temporal and occipital lobe volume.‘Manhattan’ plot displaying the association p value for each tested single-nucleotide polymorphism (SNP) (displayed as–log10of thep value). Genome-wide significance threshold is shown with a line at p = 5 ×
10−8(solid black line) and also the suggestive threshold atp = 1 × 10⁻⁵(dashed line). Dots represent SNPs, results of the four lobes are shown in a single figure, and the nearby gene is labeled. Above the suggestive threshold SNPs are colored by the associated lobe: yellow = temporal lobe, green = occipital lobe, red= parietal lobe, blue = frontal lobe
rs2279829 rs146354218 rs12411216 rs1337736 rs74921869 rs147148763 8 6 4 2 0 0 10 20 30 40 50 60 70 80 90 100 Genes Genes SNPs cons100way Genes SNPs cons100way Genes SNPs cons100way 146906 147106 147306 147095 147159 Chromosome 3 position (kb)
Chromosome 6 position (kb) Chromosome 4 position (kb) Chromosome 14 position (kb) 147223 126645 813 1013 1213 59431 59631 59831 59586 59696 59807 994 1007 1020 126845 127045 126845 126930 127015 65706 65774
Chromosome 12 position (kb) Chromosome 1 position (kb) 65842 65598 65798 65998 154964 155164 155364 155095 155146 155197 8 10 6 4 2 0 0 1 2 3 4 5 6 7 8 Genes Genes Obser v ed (–log10 P ) 8 6 4 2 0 Genes Genes SNPs cons100way Obser v ed (–log10 P ) Obser v ed (–log10 P ) Genes SNPs cons100way 8 10 6 4 2 0 Genes Obser v ed (–log10 P ) Obser v ed (–log10 P ) Genes SNPs cons100way 0 1 2 3 4 5 6 7 8 Genes Obser v ed (–log10 P ) Recombination r ate (cM/Mb) 0 10 20 30 40 50 60 70 80 90 100 Recombination r ate (cM/Mb) 0 10 20 30 40 50 60 70 80 90 100 Recombination r a te (cM/Mb) 0 10 20 30 40 50 60 70 80 90 100 Recombination r a te (cM/Mb) 0 10 20 30 40 50 60 70 80 90 100 Recombination r ate (cM/Mb) 0 10 20 30 40 50 60 70 80 90 100 Recombination r ate (cM/Mb)
Fig. 2 Regional view of the genome-wide significant loci. For each panel, zoomed in Manhattan plots (±kb from top single-nucleotide polymorphism (SNP)) are shown with gene models below (GENCODE version 19). Plots are zoomed in to highlight the genomic region that contains the index SNP and SNPs in linkage disequilibrium with the index SNP (R2> 0.8). Each plot was made using the LocusTrack software (http://gump.qimr.edu.au/general/gabrieC/
was observed between genetic components of the parietal and
temporal lobe (rg= 0.35, p = 1.5 × 10⁻³), although this did not
withstand correction for multiple testing (Fig. 3, Supplementary
Data 9). Some suggestive correlation was observed between temporal and frontal lobe volume with genetic determinants of subcortical volumes; however, none survived multiple testing adjustments. When studying brain diseases, only occipital lobe volume showed a suggestive genetic correlation with Parkinson’s
disease (rg= 0.18, p = 0.03). No significant genetic correlation
was observed with any of the other tested neurological or psy-chiatric traits.
Discussion
In our genome-wide association study of in up to 16,016 indi-viduals, we identified 6 independent loci where variants had significant associations with brain lobar volumes, independent of
intracranial volume. We were able to replicate thesefindings in a
sample of 8,789 individuals. Four out of the six identified loci have not been linked to brain volume measures before; the other two loci are located in regions previously associated with brain volume measures (12q14.3 with hippocampal volume and 6q22.32 with intracranial volume). These new loci provide intriguing new insights into the genetics underlying brain lobar volumes.
We estimated that, after adjusting for intracranial volume, 17.5–20.3% of the variance in lobar volumes could be explained by common genetic variation. This forms 30–40% of the total heritability we estimated, suggesting a major contribution of common genetic variation in brain development. More genetic variants associated with brain volume may be discovered by increasing the sample sizes of genetic studies. An interesting
observation is that we were able to replicate our findings using
only gray matter volumes of each lobe, while the discovery stu-died the sum of gray and white matter. This difference might explain that not all loci replicated as strong as others and that differential effects might exist on gray and white matter volume effects of the genetic variants. Future studies will have to elucidate the biological mechanisms of the discovered associations.
Interestingly, the majority of the identified loci contained variants associated with occipital lobe volume, whereas the other brain lobes have more often been linked to disease outcomes. Yet, the heritability estimates for the occipital lobe do not exceed the heritability estimates of the other brain lobes. One possible
explanation for thisfinding is the smaller volume of the occipital
lobe compared to the other lobes, making it a more specific region —also in terms of the genetic architecture. It may also be explained by a less polygenic nature of the occipital lobe com-pared to the other lobes, allowing one to identify stronger asso-ciations for a single genetic variant.
Regarding the identified genome-wide significant loci, two identified loci have been previously associated with brain volume measurements. The locus 12q14.3 associated with temporal lobe volume in our study and was previously associated with
hippo-campal volume17. Our index variant rs146354218 (p= 6.4 × 10⁻¹⁰)
is an intronic variant in the MSRB3 gene and lies 39 kilobases (kb) from the previously published rs61921502 variant associated
with hippocampal volume18; however, the LD (R2= 0.1, D’ = 1,
p < 0.0001)19 is low. This previously published variant also
showed some evidence of association with total temporal lobe
volume (effect= 0.57 cm3, p= 6.5 × 10⁻⁴). Thus the 12q14.3
locus not only influences hippocampal volume but also seems to have a more generalized effect on the temporal lobe volume as would be expected by the genetic correlation between temporal lobe volume and hippocampal volume. The signal (rs1337736,
p= 4.0 × 10⁻⁸) at 6q22.32 near to the gene CENPW (Centromere
Table 1 Genetic variants at six loci signi fi cantly associated with lobar brain volumes Lobe Annotation (n earby) Gene Rs-ID Chr Position A1 A2 European ance stry meta-an alysis Mult i-ethnic met a-analysis Replicati on sample (n = 8,789) Frq Effect SE p Frq Effect SE pN R 2(%) Frq Effec t S E p Parietal UTR3 ZIC4 rs227982 9 3 147106319 T C 0.21 − 0.92 0.16 5.3 × 10 − 9 0.21 − 0.95 0.15 4.4 × 10 − 10 16,015 0.24 0.22 − 0.63 0.18 6.0 × 10 − 4 Temporal Intronic MSRB3 rs1463 54218 12 65793942 A G 0.37 0.69 0.11 1.2 × 10 − 9 0.37 0.69 0.11 6.4 × 10 − 10 15,78 9 0.24 0.37 0.54 0.14 6.4 × 10 − 5 Occipital Intergenic DAAM1 (dist = 24302) rs147 148763 a 14 596 31075 G GTTGT 0.13 − 0.83 0.14 6.6 × 10 − 9 0.13 − 0.85 0.14 2.9 × 10 − 9 15,220 0.23 0.12 − 0.80 0.12 3.1 × 10 − 11 Occipital Intronic FGFRL1 rs749218 69 4 1013382 A G 0.2 − 0.84 0.14 5.9 × 10 − 9 0.2 − 0.82 0.14 6.2 × 10 − 9 12,424 0.27 0.19 − 0.22 0.10 3.0 × 10 − 2 Occipital Intergenic CENPW (dist = 175626 ) rs13377 36 6 126845380 A G 0.23 − 0.64 0.12 8.1 × 10 − 8 0.23 − 0.64 0.12 4.0 × 10 − 8 16,016 0.19 0.23 − 0.46 0.09 8.0 × 10 − 7 Occipital Upstream MIR92B/T HBS3 rs124 11216 1 15516448 0 A C 0.46 − 0.52 0.10 3.9 × 10 − 8 0.46 − 0.49 0.09 1.4 × 10 − 7 16,016 0.17 0.45 − 0.19 0.08 1.6 × 10 − 2 The allele frequency (frq) and effect size are given for A1. Effect sizes are given in unit s o f c m 3per effect allele. Results are provided for the discovery sample s and the meta-ana lysis of all European ancestry and the multi-ethnic meta-analysi s. The variance explained gives the percentage variance explained of a SNP 16 A1 effect allele, A2 reference allele, Chr chromos ome, Fr q effect allele freque ncy, N number of individua ls with genetic variant, pp value, Rs-ID reference SNP cluster ID, SE standard erro r aIn the repli cation sample , anoth er signi fi cant variant in high LD (R 2= 0.99) with this variant was used (rs76341705, p value = 4.8 × 10 − 9) Abbre viations: effec t allele (A1), refere nce allele (A2), chrom osome (Chr), effect allele freque ncy (Frq), numbe r o f individuals with geneti c var iant (N), p-value (P), reference SNP cluste r ID (R s-ID ), standard error (SE)
Protein W) is associated with occipital volume. This signal overlapped previously associated signals with intracranial
volume16,17and is further implicated in bone mineral density20,
height21, waist-hip ratio22, and infant length23. The index variant
associated with intracranial volume (rs11759026) and our top
variant are in linkage equilibrium (R2= 0.07, D’ = 1, p =
0.0002)19. We also found suggestive associations between
rs11759026 and both frontal (−1.0 cm3, p= 6.3 × 10⁻⁵) and
occipital lobar volume (−0.31 cm3, p= 6.6 × 10⁻³). Each locus
was located in regions that are under epigenetic regulation in brain tissue (Supplementary Data 6) or close to genes or genomic loci associated with Mendelian brain-related diseases. The variant rs2279829 (3q24) is located in the 3’-untranslated region (UTR) of the Zic Family Member 4 (ZIC4) gene and close to the related ZIC1 gene. This variant localizes within enhancer sites in pre-dominantly neurological cell types, among which the brain germinal matrix (Supplementary Data 6) and both ZIC4 and ZIC1 are expressed throughout the brain (Supplementary Fig. 9). Heterozygous deletions of ZIC1 and ZIC4 cause Dandy–Walker
malformation24. Children with this malformation have no vermis,
the part connecting the two cerebellar hemispheres24.
Gain-of-function mutations in ZIC1 lead to coronal craniosynostosis and
learning disability25. Variant rs147148763 was located 24 kb from
the disheveled-associated activator of morphogenesis 1
(DAAM1). There is evidence for the most significant variants to localize within enhancer sites, as well as DNA-hypersensitivity sites in brain tissues. Also, genome-wide significant SNPs in the locus are expression quantitative trait loci (eQTLs) of DAAM1 in blood (Supplementary Data 6). Daam1 is a formin protein that
has been linked to actin dynamics26, is regulated by RhoA27, and
is expressed in the shafts of dendrites28. Expression patterns in
brain development of animals further suggest a role in neuronal
cell differentiation and movement29. Variant rs4647940 is located
in the 3’-UTR of fibroblast growth factor receptor (FGFRL1) and is in LD with a missense variant in Alpha-L-iduronidase (IDUA)
(rs3755955, R2= 0.87) that was previously associated with bone
mineral density (p= 5.0 × 10⁻¹⁵). Deletion of the 4p16.3 locus
causes Wolf–Hirschhorn syndrome, a neurodevelopmental dis-order characterized by mental retardation, craniofacial mal-formation, and defects in skeletal and heart development. Variant rs12411216 is located in an intron of MIR92B and THBS3, but the signal peak in this locus covers >20 genes. Promotor histone marks overlap the variant and it is an eQTL for multiple genes, both in a multitude of different tissues among which brain tissues
(Supplementary Data 6). In summary, these findings link genes
that cause Mendelian syndromes affecting cranial skeletal
malformations, brain malformations, and intelligence with brain lobe volume in healthy individuals. One other interesting variant
in tight LD with our index variant (rs4072037, R2= 0.94) is a
missense SNP in the MUC1 gene that decreased levels of blood
magnesium concentrations30. It is not clear how decreased
magnesium levels are involved in decreased occipital brain volume, but it is an interesting avenue to explore as magnesium is
known to be important for neural transmissions31 and
magne-sium infusions have anti-convulsive effects and is still used to
prevent convulsions in pre-eclampsia32.
Using genetic correlation analysis, we did not find a strong
significant genetic correlation between most of the brain lobes, which suggests that the genetic basis of the brain lobes is largely
independent15. We also did not find significant genetic overlap
between lobar brain volumes and neurological and psychiatric disease outcomes. The most significant genetic correlation with brain lobar volume and diseases we observed was between
occi-pital lobe volume and Parkinson’s disease (rg= 0.18, p = 0.03).
However, this finding was not significant after multiple testing
correction, leading us to report this finding with caution. The
absence of significant genetic correlations between other brain lobes and clinical diseases could be due to true absence of a genetic overlap. However, other explanations can be put forward. First, it could also mean that our lobar volume GWAS and those for other diseases were still too underpowered to show significant genetic correlations. Second, the anatomical boundaries for the different lobes can be quite arbitrary and do not necessarily have to coincide with underlying gene function or biological processes leading to neurological or psychiatric disorders.
There are several limitations to our study. First, we have accepted differences in analytical methods of the magnetic reso-nance imaging (MRI) scans to allow for the largest sample size to be studied. This might have resulted in different effects over the studies. However, we did not observe significant heterogeneity after correcting for multiple testing for the six loci. In addition, a sensitivity analysis showed similar effects of the genome-wide significant variants for the studies using the kNN algorithm in
comparison to the other studies. False negative findings due to
differences in analytical methods of the MRI scans cannot be excluded. Second, a limitation of our study is that a different reference panel for imputation was used for the discovery and replication sample. This is due to the historic limited availability of the HRC reference panel at the initiation of this study. As the
variants were well imputed (R2> 0.5) in all studies, this is not
expected to have influenced the results, although it is possible that additional variants may be discovered if the larger HRC reference
−1 −0.8 −0.6 −0.4 −0.2 0 0.2 0.4 0.6 0.8 1
Frontal lobe volumeOccipital lobe volumeParietal lobe volumeTemporal lobe volumeAccumbens nucleus volumeAmygdalar volumeBrainstem volumeCaudate nucleus volumeHippocampal volumeIntracranial volumePallidum volumePutamen volumeThalamic volumeWhite matter lesionsAlzheimer’s diseaseADHD AutismBipolar disorderExtraversionGeneral cognitive functionMajor depressive disorderNeuroticismParkinson’s diseaseSchizophrenia
Frontal lobe volume Occipital lobe volume Parietal lobe volume Temporal lobe volume
*** *** *** ** ** *** ** * * * ** *
Lobar brain volumes Other brain imaging measures Neuropsychiatric traits
Fig. 3 Genetic correlation between lobar brain volumes and other brain imaging measures and neuropsychiatric traits. Heatmap showing the genetic correlations estimates (rg) as calculated by linkage disequilibrium score regression. Larger blocks and darker colors present stronger correlations, with blue
and red indicating positive and negative correlations, respectively. The strength of the significance levels are indicated by asterisks: *p < 0.05; **p < 1.3 × 10⁻² (0.05/4), adjusted for the lobe count; ***p < 5.8 × 10⁻⁴(0.05/86), adjusted for the number of correlations tested
panel would be used in future studies. Last, for the UK Biobank only gray matter parcellations were available to us. Despite this
limitation, we were able to replicate ourfindings. This suggests
that the identified variants have an effect on gray as well as white matter volumes.
In summary, brain lobar volumes are differentially heritable traits, which can in large part be explained by common genetic variation. We identified six loci where genotypes are associated with specific brain lobes, four of which have not been implicated in brain morphology before. These loci are compelling targets for functional research to identify the biology behind their genetic signals.
Methods
Study population. The study sample consisted of dementia- and stroke-free individuals with quantitative brain MRI and genome-wide genotypes from 19 population- and family-based cohort studies participating in the Cohorts of Heart and Aging Research in Genomic Epidemiology consortium and the case–control Alzheimer’s Disease Neuroimaging Initiative study. In total, 16,016 participants were included, 15,269 participants of European ancestry, 405 African Americans, 211 Chinese, and 131 Malay. We attempted to replicate ourfindings in 8,789 European ancestry individuals from the UK Biobank, an ongoing prospective population-based cohort study located in the United Kingdom. Descriptive sta-tistics of all populations are provided in Supplementary Data 1. DNA from whole blood was extracted and genome-wide genotyping was performed using a range of commercially available genotyping arrays. Genotype imputations were performed in each discovery cohort using 1000 Genomes version 133as reference and using
the Haplotype Reference Consortium (HRC) version 1.1 in the replication cohort (Supplementary Data 2).
MRI methods. Three-dimensional T1-weighted brain MRI data were acquired by each cohort (Supplementary Data 1). Cohorts in the discovery sample segmented the T1-weighted images into supra-tentorial gray matter, white matter, and cere-brospinalfluid. The methods of image segmentation varied across study cohorts (Supplementary Methods). However, the majority used a previously described kNN algorithm, which was trained on six manually labeled atlases34, or in-house
image-processing pipelines. In each study, MRI scans were performed and processed with automated protocols, without reference to clinical or genetic information. We studied the total volume (sum of white and gray matter and the left and right hemisphere) of the frontal, parietal, temporal, and occipital brain lobes, adjusted for intracranial volume. Descriptive information of the lobar volumes across the different studies is provided in Supplementary Data 3. Differences in average brain lobar volumes were accepted as differences in MRI acquisition, processing, seg-mentation, and demographics, which exist over cohorts. As a replication, we used the released volume measurements of 8,789 UK Biobank participants, extracted using the FreeSurfer software version 6.0, which obtains lobar volumes by adding up regions of interest volumes35,36. As only FreeSurfer gray matter volumes were
available for this study sample, the replication sample volumes were smaller than the volumes in the discovery sample (Supplementary Data 3).
Estimation of heritability. The heritability of lobar brain volumes was estimated using family structure in the Framingham Heart Study (n= 2080), which con-stitutes a community-based cohort of non-demented individuals without evidence of significant brain injury (e.g., stroke or multiple sclerosis). In total, 619 extended families with a family size of 3.6 ± 6.6 individuals were included in the analyses. These families consisted of the following pairs of relatives: 316 parent–offspring, 1135 sibling, 340 avuncular, 1772first cousin, and 826 second cousin pairs. We calculated additive genetic heritability without shared environmental effects (C) using a variance-components analysis under an AE model in SOLAR37, adjusted
for age, age2, and sex.
GWAS of lobar volumes. Associations of imputed genotype dosages with lobar volumes were examined using linear regression analyses under an additive model. Associations were adjusted for age, age2, sex, thefirst four principal components to account for possible confounding due to population stratification, and study-specific covariates. Linear mixed models with estimated kinships were used for association analyses in cohorts with related samples. Details on the analysis methods used in each cohort are provided in Supplementary Data 1 and 2. Post-GWAS quality control (QC) was conducted using EasyQC38andfiltering. Genetic
variants with a low imputation quality (R2< 0.5), a minor allele count <10, and allelic or locational mismatching of SNPs with the reference panel were removed prior to the meta-analyses. The number of variants afterfiltering and the genomic inflation per study are provided in Supplementary Data 4. After QC, summary statistics were adjusted by the genomic control method in each of the participating cohorts39. We then performed two inverse-variance weightedfixed-effect
meta-analyses in METAL39. First, we meta-analyzed all participants of European
ancestry, then performed a multi-ethnic meta-analysis including African Amer-icans (n= 405), Chinese (n = 211), and Malay (n = 131). After meta-analyses, genetic variants with a total sample size of <5000 were excluded. We performed conditional analysis on the index variants to determine whether there were mul-tiple independent genome-wide significant variants in a locus using the Genome-Wide Complex Trait Analysis (GCTA) software (--cojo, --p-cojo)40,41. Genotypes
in the Rotterdam-study (all 6291 individuals of the baseline cohort who were genotyped) were used as reference for this analysis. For loci with a genome-wide significant association (p < 5 × 10⁻⁸), we tested for heterogeneity using the I2 sta-tistic39. In a sensitivity meta-analysis, we tested whether the studies using the kNN
algorithm had similar effects of the genome-wide significant variants for the studies using the kNN-algorithm in comparison to the other studies. We also searched for candidate genes in the loci using publically available databases for differential expression of the SNPs (eQTL database in GTEx)42and HaploReg, an online tool
that summarizes the ENCODE database for epigenetic markings and proteins binding to DNA43.
Variance explained by common variants and genetic correlations. The variance explained by all SNPs, or SNP-based heritability, was calculated from summary statistics using LD score regression44. The percentage of variance explained by all
SNPs was determined based on meta-analysis results using the LD Hub45. We used
the same LD score regression44to quantify the amount of genetic correlation
between the four brain lobes and other brain-related traits and diseases, using summary statistics for meta-analyses of genetic studies of subcortical structures16,
intracranial volume17, white matter hyperintensities46, general cognitive ability47,
neuroticism48, schizophrenia49, attention-deficit/hyperactivity disorder50, autism51,
major depressive disorder52, bipolar disorder¸49Parkinson’s disease53, and
Alz-heimer’s disease54.
Ethical compliance. All participants, or their parents or guardians in the case of minors, provided written informed consent for study participation, the use of brain MRI data, and the use of their DNA for genetic research. Approval for the indi-vidual studies was obtained by the relevant local ethical committees and institu-tional review boards.
Statistics and reproducibility. Software used for the data analysis of this study: EasyQC (www.genepi-regensburg.de/easyqc), FreeSurfer (https://surfer.nmr.mgh. harvard.edu/), GCTA (http://cnsgenomics.com/software/gcta/), GenABEL (http:// www.genabel.org), GTeX (https://gtexportal.org/home/), HaploReg (https://www. encodeproject.org/software/haploreg/), HASE (https://github.com/roshchupkin/ hase), LD-hub (http://ldsc.broadinstitute.org/ldhub/), LD score regression (https:// github.com/bulik/ldsc), mach2qtl (https://www.nitrc.org/projects/mach2qtl/), METAL (http://csg.sph.umich.edu/abecasis/metal/), Perl (https://www.perl.org/), PLINK (https://www.cog-genomics.org/plink2), R (https://www.r-project.org/), SNPTEST (https://mathgen.stats.ox.ac.uk/genetics_software/snptest/snptest.html), and SOLAR (http://www.sfbr.org).
Reporting summary. Further information on research design is available in the Nature Research Reporting Summary linked to this article.
Data availability
The genome-wide summary statistics that support thefindings of this study will be made available via the NHGRI-EBI GWAS Catalog website (https://www.ebi.ac.uk/gwas/ downloads/summarystatistics) upon publication. Quantitative brain MRI and genotype data are available from the corresponding authors H.H.H.A. and C.D.C. upon reasonable request.
Code availability
No previously unreported custom computer code or mathematical algorithm was used to generate results central to the conclusions. The code is available upon request from the corresponding authors H.H.H.A. and C.D.C.
Received: 4 March 2019 Accepted: 14 May 2019
References
1. Miller, E. K. & Cohen, J. D. An integrative theory of prefrontal cortex function. Annu. Rev. Neurosci. 24, 167–202 (2001).
2. Culham, J. C. & Valyear, K. F. Human parietal cortex in action. Curr. Opin. Neurobiol. 16, 205–212 (2006).
3. Levy, D. A., Bayley, P. J. & Squire, L. R. The anatomy of semantic knowledge: Medial vs. lateral temporal lobe. Proc. Natl Acad. Sci. USA 101, 6710–6715 (2004).
4. Mendez, M. F., Selwood, A., Mastri, A. R. & Frey, W. H. 2nd Pick’s disease versus Alzheimer’s disease: a comparison of clinical characteristics. Neurology 43, 289–292 (1993).
5. de Lanerolle, N. C. et al. A retrospective analysis of hippocampal pathology in human temporal lobe epilepsy: evidence for distinctive patient subcategories. Epilepsia 44, 677–687 (2003).
6. Srinivasa, R. N. et al. Cardiovascular risk factors associated with smaller brain volumes in regions identified as early predictors of cognitive decline. Radiology 278, 198–204 (2016).
7. Hulshoff Pol, H. E. et al. Genetic contributions to human brain morphology and intelligence. J. Neurosci. 26, 10235–10242 (2006).
8. Wen, W. et al. Distinct genetic influences on cortical and subcortical brain structures. Sci. Rep. 6, 32760 (2016).
9. Batouli, S. A. et al. Heritability of brain volumes in older adults: the Older Australian Twins Study. Neurobiol. Aging 35, 937 e5–18 (2014).
10. Baare, W. F. et al. Quantitative genetic modeling of variation in human brain morphology. Cereb. Cortex 11, 816–824 (2001).
11. Geschwind, D. H., Miller, B. L., DeCarli, C. & Carmelli, D. Heritability of lobar brain volumes in twins supports genetic models of cerebral laterality and handedness. Proc. Natl Acad. Sci. USA 99, 3176–3181 (2002).
12. Gilmore, J. H. et al. Genetic and environmental contributions to neonatal brain structure: A twin study. Hum. Brain Mapp. 31, 1174–1182 (2010). 13. Yoon, U., Fahim, C., Perusse, D. & Evans, A. C. Lateralized genetic and
environmental influences on human brain morphology of 8-year-old twins. Neuroimage 53, 1117–1125 (2010).
14. Wallace, G. L. et al. A pediatric twin study of brain morphometry. J. Child Psychol. Psychiatry 47, 987–993 (2006).
15. DeStefano, A. L. et al. Bivariate heritability of total and regional brain volumes: the Framingham Study. Alzheimer Dis. Assoc. Disord. 23, 218–223 (2009).
16. Hibar, D. P. et al. Common genetic variants influence human subcortical brain structures. Nature 520, 224–229 (2015).
17. Adams, H. H. et al. Novel genetic loci underlying human intracranial volume identified through genome-wide association. Nat. Neurosci. 19,1569–1582 (2016).
18. Hibar, D. P. et al. Novel genetic loci associated with hippocampal volume. Nat. Commun. 8, 13624 (2017).
19. Machiela, M. J. & Chanock, S. J. LDlink: a web-based application for exploring population-specific haplotype structure and linking correlated alleles of possible functional variants. Bioinformatics 31, 3555–3557 (2015). 20. Estrada, K. et al. Genome-wide meta-analysis identifies 56 bone mineral
density loci and reveals 14 loci associated with risk of fracture. Nat. Genet. 44, 491 (2012).
21. Lango Allen, H. et al. Hundreds of variants clustered in genomic loci and biological pathways affect human height. Nature 467, 832–838 (2010). 22. Heid, I. M. et al. Meta-analysis identifies 13 new loci associated with waist-hip
ratio and reveals sexual dimorphism in the genetic basis of fat distribution. Nat. Genet. 43, 1164 (2011).
23. van der Valk, R. J. P. et al. A novel common variant in DCST2 is associated with length in early life and height in adulthood. Hum. Mol. Genet. 24, 1155–1168 (2015).
24. Grinberg, I. et al. Heterozygous deletion of the linked genes ZIC1 and ZIC4 is involved in Dandy-Walker malformation. Nat. Genet. 36, 1053–1055 (2004).
25. Twigg, S. R. et al. Gain-of-function mutations in ZIC1 are associated with coronal craniosynostosis and learning disability. Am. J. Hum. Genet. 97, 378–388 (2015).
26. Habas, R., Kato, Y. & He, X. Wnt/Frizzled activation of Rho regulates vertebrate gastrulation and requires a novel formin homology protein Daam1. Cell 107, 843–854 (2001).
27. Matusek, T. et al. The Drosophila formin DAAM regulates the tracheal cuticle pattern through organizing the actin cytoskeleton. Development 133, 957–966 (2006).
28. Salomon, S. N., Haber, M., Murai, K. K. & Dunn, R. J. Localization of the Diaphanous-related formin Daam1 to neuronal dendrites. Neurosci. Lett. 447, 62–67 (2008).
29. Kida, Y., Shiraishi, T. & Ogura, T. Identification of chick and mouse Daam1 and Daam2 genes and their expression patterns in the central nervous system. Dev. Brain Res. 153, 143–150 (2004).
30. Meyer, T. E. et al. Genome-wide association studies of serum magnesium, potassium, and sodium concentrations identify six Loci influencing serum magnesium levels. PLoS Genet. 6, e1001045 (2010).
31. Borges, L. F. & Gucer, G. Effect of magnesium on epileptic foci. Epilepsia 19, 81–91 (1978).
32. Pritchard, J. A. & Pritchard, S. A. Standardized treatment of 154 consecutive cases of eclampsia. Am. J. Obstet. Gynecol. 123, 543–552 (1975).
33. Genomes Project, C. et al. A global reference for human genetic variation. Nature 526, 68–74 (2015).
34. Vrooman, H. A. et al. Multi-spectral brain tissue segmentation using automatically trained k-Nearest-Neighbor classification. Neuroimage 37, 71–81 (2007).
35. Desikan, R. S. et al. An automated labeling system for subdividing the human cerebral cortex on MRI scans into gyral based regions of interest. Neuroimage 31, 968–980 (2006).
36. Fischl, B. et al. Automatically parcellating the human cerebral cortex. Cereb. Cortex 14, 11–22 (2004).
37. Almasy, L. & Blangero, J. Multipoint quantitative-trait linkage analysis in general pedigrees. Am. J. Hum. Genet. 62, 1198–1211 (1998).
38. Winkler, T. W. et al. Quality control and conduct of genome-wide association meta-analyses. Nat. Protoc. 9, 1192–1212 (2014).
39. Willer, C. J., Li, Y. & Abecasis, G. R. METAL: fast and efficient meta-analysis of genomewide association scans. Bioinformatics 26, 2190–2191 (2010). 40. Yang, J., Lee, S. H., Goddard, M. E. & Visscher, P. M. GCTA: a tool for
genome-wide complex trait analysis. Am. J. Hum. Genet. 88, 76–82 (2011). 41. Yang, J. et al. Conditional and joint multiple-SNP analysis of GWAS summary
statistics identifies additional variants influencing complex traits. Nat. Genet. 44, 369–375 (2012). S1-3.
42. Consortium, G. T. et al. Human genomics. The Genotype-Tissue Expression (GTEx) pilot analysis: multitissue gene regulation in humans. Science 348, 648–660 (2015).
43. Ward, L. D. & Kellis, M. HaploReg: a resource for exploring chromatin states, conservation, and regulatory motif alterations within sets of genetically linked variants. Nucleic Acids Res. 40(Database issue), D930–D934 (2012). 44. Bulik-Sullivan, B. et al. An atlas of genetic correlations across human diseases
and traits. Nat. Genet. 47, 1236–1241 (2015).
45. Zheng, J. et al. LD Hub: a centralized database and web interface to perform LD score regression that maximizes the potential of summary level GWAS data for SNP heritability and genetic correlation analysis. Bioinformatics 33, 272–279 (2017).
46. Verhaaren, B. F. et al. Multiethnic genome-wide association study of cerebral white matter hyperintensities on MRI. Circ. Cardiovasc. Genet. 8, 398–409 (2015).
47. Davies, G. et al. Genetic contributions to variation in general cognitive function: a meta-analysis of genome-wide association studies in the CHARGE consortium (N=53 949). Mol. Psychiatry 20, 183–192 (2015).
48. Turley, P. et al. Multi-trait analysis of genome-wide association summary statistics using MTAG. Nat. Genet. 50, 229–237 (2018).
49. Bipolar Disorder and Schizophrenia Working Group of the Psychiatric Genomics Consortium. Genomic dissection of bipolar disorder and schizophrenia, including 28 subphenotypes. Cell 173, 1705.e16–1715.e16 (2018).
50. Demontis, D. et al. Discovery of thefirst genome-wide significant risk loci for attention deficit/hyperactivity disorder. Nat. Genet. 51, 63–75 (2019). 51. Grove, J. et al. Identification of common genetic risk variants for autism
spectrum disorder. Nat. Genet. 51, 431–444 (2019).
52. Wray, N. R. et al. Genome-wide association analyses identify 44 risk variants and refine the genetic architecture of major depression. Nat. Genet. 50, 668–681 (2018).
53. Chang, D. et al. A meta-analysis of genome-wide association studies identifies 17 new Parkinson’s disease risk loci. Nat. Genet. 49, 1511–1516 (2017). 54. Lambert, J. C. et al. Meta-analysis of 74,046 individuals identifies 11 new
susceptibility loci for Alzheimer’s disease. Nat. Genet. 45, 1452–1458 (2013).
Acknowledgements
Data used in preparing this article were obtained from the Alzheimer’s Disease Neu-roimaging Initiative (ADNI) database (adni.loni.usc.edu). As such, many investigators within the ADNI contributed to the design and implementation of ADNI and/or pro-vided data but did not participate in analysis or writing of this report. A complete listing of ADNI investigators can be found at:http://adni.loni.usc.edu/wp-content/uploads/ how_to_apply/ADNI_Acknowledgement_List.pdf. Full acknowledgements are provided in the Supplementary Information.
Author contributions
(Co)wrote draft: S.J.v.d.L., M.J.K., N.A., H.H.H.A., C.D. Meta-analysis: S.J.v.d.L. Ana-lyzed data: G.C., C.S., A.V.S., E.H., J.C.B., D.P.H., S.H., E.B.v.d.A., M. Bernard, L.R.Y., F.C., J.W.C., Y.S., S.L., L.Y., G.V.R., N.J., Q.Y., R.A.M., S.B., C.Y.C., P.M., W.Z., P.A.N., B.M.P., Z.P., P.M.T. Critical revision of manuscript: G.C., C.S., A.V.S., E.H., J.C.B., D.P.H., E.B.v.A., M. Bernard, L.R.Y., N.A., J.W.C., Y.S., O.L.L., S.L., J.v.d.G., L.Y., T.P., G.V.R., P.A., N.J., Q.Y., R.A.M., S.B., B.M., C.Y.C., P.M., W.J.N., M. Beekman, W.Z., P.A.N., M.W.V., H.S., Z.P., D.M.B., P.L.D.J., P.M.T., C.M.v.D., R.S., W.T.L., M.A.I., S.S. Contributed to sample collection: J.C.B., S.H., K.A., T.B.H., O.L.L., J.v.d.G., T.P., K.D.T., B.M., C.Y.C., K.R., D.v.H., T.Y.W., W.J.N., A.S.B., M. Beekman, P.A.N., C.C., L.L., B.M.P., M.K.I., M.W.V., H.S., Z.P., D.M.B., P.L.D.J., C.M.v.D., D.A.B., P.E.S., R.S., W.T.L., M.A.I., S.S., S.D., V.G. Secured funding: K.A., T.B.H., O.L.L., P.A., K.D.T., B.M.,
K.R., D.v.H., T.Y.W., W.J.N., A.S.B., C.C., L.L., B.M.P., M.K.I., H.S., D.M.B., P.L.d.J., C.M.v.D., D.A.B., P.E.S., R.S., W.T.L., M.A.I., S.S., S.D., V.G. Study supervision: H.H.H.A., C.D.
Additional information
Supplementary informationaccompanies this paper at https://doi.org/10.1038/s42003-019-0537-9.
Competing interests:The authors declare no competing interests.
Reprints and permissioninformation is available online athttp://npg.nature.com/ reprintsandpermissions/
Publisher’s note: Springer Nature remains neutral with regard to jurisdictional claims in published maps and institutional affiliations.
Open Access This article is licensed under a Creative Commons Attribution 4.0 International License, which permits use, sharing, adaptation, distribution and reproduction in any medium or format, as long as you give appropriate credit to the original author(s) and the source, provide a link to the Creative Commons license, and indicate if changes were made. The images or other third party material in this article are included in the article’s Creative Commons license, unless indicated otherwise in a credit line to the material. If material is not included in the article’s Creative Commons license and your intended use is not permitted by statutory regulation or exceeds the permitted use, you will need to obtain permission directly from the copyright holder. To view a copy of this license, visithttp://creativecommons.org/ licenses/by/4.0/.
© The Author(s) 2019
Sven J. van der Lee
1, Maria J. Knol
1, Ganesh Chauhan
2,3, Claudia L. Satizabal
4,5,
Albert Vernon Smith
6,7, Edith Hofer
8,9, Joshua C. Bis
10, Derrek P. Hibar
11, Saima Hilal
1,12,13,14,
Erik B. van den Akker
15,16,17, Konstantinos Arfanakis
18,19, Manon Bernard
20, Lisa R. Yanek
21, Najaf Amin
1,
Fabrice Crivello
22, Josh W. Cheung
11, Tamara B. Harris
23, Yasaman Saba
24, Oscar L. Lopez
25, Shuo Li
26,
Jeroen van der Grond
27, Lei Yu
19, Tomas Paus
28,29, Gennady V. Roshchupkin
1,14,30, Philippe Amouyel
31,
Neda Jahanshad
11, Kent D. Taylor
32, Qiong Yang
26, Rasika A. Mathias
21, Stefan Boehringer
17,
Bernard Mazoyer
22, Ken Rice
33, Ching Yu Cheng
34, Pauline Maillard
35, Diana van Heemst
36,
Tien Yin Wong
34, Wiro J. Niessen
30,37, Alexa S. Beiser
5,26, Marian Beekman
15, Wanting Zhao
34,
Paul A. Nyquist
38, Christopher Chen
12,13, Lenore J. Launer
23, Bruce M. Psaty
10,39,40,41, M. Kamran Ikram
1,42,
Meike W. Vernooij
1,14, Helena Schmidt
24, Zdenka Pausova
20,43, Diane M. Becker
21, Philip L. De Jager
44,45,
Paul M. Thompson
11, Cornelia M. van Duijn
1, David A. Bennett
19, P. Eline Slagboom
15, Reinhold Schmidt
8,
W.T. Longstreth
39,46, M. Arfan Ikram
1, Sudha Seshadri
4,5, Stéphanie Debette
2,47, Vilmundur Gudnason
6,7,
Hieab H.H. Adams
1,14,48& Charles DeCarli
491Department of Epidemiology, Erasmus MC University Medical Center, Rotterdam 3015CN, the Netherlands.2University of Bordeaux, Bordeaux Population Health Research Center, INSERM UMR 1219, 33000 Bordeaux, France.3Centre for Brain Research, Indian Institute of Science, Bangalore 560012, India.4The Glenn Biggs Institute for Alzheimer’s and Neurodegenerative Diseases, UT Health San Antonio, San Antonio, TX 78229, USA. 5Boston University School of Medicine and the Framingham Heart Study, Boston, MA 02118, USA.6Icelandic Heart Association, 201 Kopavogur, Iceland.7Faculty of Medicine, University of Iceland, 101 Reykjavik, Iceland.8Clinical Division of Neurogeriatrics, Department of Neurology, Medical University of Graz, Graz 8036, Austria.9Institute for Medical Informatics, Statistics and Documentation, Medical University of Graz, Graz 8036, Austria.10Cardiovascular Health Research Unit, Department of Medicine, University of Washington, Seattle, WA 98101, USA.11Imaging Genetics Center, Mark and Mary Stevens Neuroimaging & Informatics Institute, Keck School of Medicine of the University of Southern California, Los Angeles, CA 90292, USA.12Department of Pharmacology, National University of Singapore, Singapore 117600, Singapore.13Memory, Aging and Cognition Center, National University Health System, Singapore 119228, Singapore.14Department of Radiology and Nuclear Medicine, Erasmus MC University Medical Center, Rotterdam 3015CN, the Netherlands.15Department of Biomedical Data Sciences, Section of Molecular Epidemiology, Leiden University Medical Center, Leiden 2333ZA, the Netherlands.16Pattern Recognition & Bioinformatics, Delft University of Technology, Delft 2628XE, the Netherlands.17Department of Biomedical Data Sciences, Statistical Genetics, Leiden University Medical Center, Leiden 2333ZA, the Netherlands.18Department of Biomedical Engineering, Illinois Institute of Technology, Chicago, IL 60616, USA.19Rush Alzheimer’s Disease Center, Rush University Medical Center, Chicago, IL 60612, USA.20The Hospital for Sick Children, University of Toronto, Toronto M5G 1X8 ON, Canada. 21GeneSTAR Research Program, Department of Medicine, Johns Hopkins School of Medicine, Baltimore, MD 21205, USA.22Neurofunctional Imaging Group - Neurodegenerative Diseases Institute, UMR 5293, Team 5 - CEA - CNRS - Bordeaux University, Bordeaux 33076, France. 23Laboratory of Epidemiology and Population Sciences, National Institute on Aging, Intramural Research Program, National Institutes of Health, Bethesda, MD 20892, USA.24Research Unit-Genetic Epidemiology, Gottfried Schatz Research Centre for Cell Signaling, Metabolism and Aging, Molecular Biology and Biochemistry, Medical University of Graz, 8010 Graz, Austria.25Department of Neurology, University of Pittsburgh, Pittsburgh, PA 15260, USA.26Department of Biostatistics, School of Public Health, Boston University, Boston, MA 02118, USA.27Department of Radiology, Leiden University Medical Center, Leiden 2333ZA, the Netherlands.28Bloorview Research Institute, Holland Bloorview Kids
Rehabilitation Hospital, Toronto M4G 1R8, Canada.29Departments of Psychology and Psychiatry, University of Toronto, Toronto M5S 1A1, Canada. 30Department of Medical Informatics, Erasmus MC University Medical Center, Rotterdam 3015CN, the Netherlands.31Univ. Lille, Inserm, Centre Hosp. Univ Lille, Institut Pasteur de Lille, LabEx DISTALZ-UMR1167 - RID-AGE - Risk factors and molecular determinants of aging-related, 59000 Lille, France.32Institute for Translational Genomics and Population Sciences, Department of Pediatrics at LABioMed-Harbor-UCLA Medical Center, Torrance, CA 90502, USA.33Department of Biostatistics, University of Washington, Seattle, WA 98195, USA.34Singapore Eye Research Institute, Singapore National Eye Center, Singapore 169857, Singapore.35Imaging of Dementia and Aging (IDeA) Laboratory, University of California-Davis,
Davis, CA 95817, USA.36Department of Gerontology and Geriatrics, Leiden University Medical Center, Leiden 2333ZA, the Netherlands.37Faculty of Applied Sciences, Delft University of Technology, Delft 2629HZ, the Netherlands.38Department of Neurology, Johns Hopkins School of Medicine, Baltimore, MD 21205, USA.39Department of Epidemiology, University of Washington, Seattle, WA 98195, USA.40Department of Health Services, University of Washington, Seattle, WA 98195, USA.41Kaiser Permanente Washington Health Research Institute, Seattle, WA 98101, USA. 42Department of Neurology, Erasmus MC University Medical Center, Rotterdam 3015CN, the Netherlands.43Departments of Physiology and Nutritional Sciences, The Hospital for Sick Children, University of Toronto, Toronto M5G 1X8, Canada.44Center for Translational and Computational Neuroimmunology, Columbia University Medical Center, New York, NY 10032, USA.45Program in Medical and Population Genetics, Broad Institute, Cambridge, MA 02142, USA.46Department of Neurology, University of Washington, Seattle, WA 98195, USA. 47Department of Neurology, University Hospital of Bordeaux, Bordeaux 33000, France.48Department of Clinical Genetics, Erasmus MC University Medical Center, Rotterdam, The Netherlands.49Department of Neurology and Center for Neuroscience, University of California at Davis, Davis, CA 95817, USA