HAL Id: hal-03101063
https://hal.archives-ouvertes.fr/hal-03101063
Submitted on 6 Jan 2021
HAL is a multi-disciplinary open access
archive for the deposit and dissemination of
sci-entific research documents, whether they are
pub-lished or not. The documents may come from
teaching and research institutions in France or
abroad, or from public or private research centers.
L’archive ouverte pluridisciplinaire HAL, est
destinée au dépôt et à la diffusion de documents
scientifiques de niveau recherche, publiés ou non,
émanant des établissements d’enseignement et de
recherche français ou étrangers, des laboratoires
publics ou privés.
Au–Pd core–shell nanoparticle film for optical detection
of hydrogen gas
Nacer Boubiche, Cynthia Cibaka-Ndaya, Arnaud Brioude, Nicolas Javahiraly
To cite this version:
Nacer Boubiche, Cynthia Cibaka-Ndaya, Arnaud Brioude, Nicolas Javahiraly. Au–Pd core–shell
nanoparticle film for optical detection of hydrogen gas. AIP Advances, American Institute of
Physics-AIP Publishing LLC, 2020, 10, �10.1063/5.0023461�. �hal-03101063�
Cite as: AIP Advances 10, 105225 (2020); https://doi.org/10.1063/5.0023461
Submitted: 30 July 2020 . Accepted: 05 October 2020 . Published Online: 21 October 2020
Nacer Boubiche , Cynthia Cibaka-Ndaya, Arnaud Brioude, and Nicolas Javahiraly COLLECTIONS
Paper published as part of the special topic on Chemical Physics, Energy, Fluids and Plasmas, Materials Science
AIP Advances
ARTICLE scitation.org/journal/advAu–Pd core–shell nanoparticle film for optical
detection of hydrogen gas
Cite as: AIP Advances 10, 105225 (2020);doi: 10.1063/5.0023461
Submitted: 30 July 2020 • Accepted: 5 October 2020 • Published Online: 21 October 2020
Nacer Boubiche,1,a) Cynthia Cibaka-Ndaya,1,2Arnaud Brioude,2and Nicolas Javahiraly1 AFFILIATIONS
1Université de Strasbourg, Laboratoire ICube UMR 7357, 23 Rue du Loess, 67037 Strasbourg, France
2Université Claude Bernard Lyon1, Laboratoire des Multimatériaux et Interfaces, UMR 5615 CNRS-Univ. Lyon 1,
F-69622 Villeurbanne CEDEX, France
a)Author to whom correspondence should be addressed:[email protected]
ABSTRACT
Hydrogen use, as a clean and almost infinite energy source, has an economic impact in many industries. The problem is that this gas cannot be used like any gas because of its explosiveness at 4% in the air, hence the need to know its concentration any time for security reasons. The permanent detection of hydrogen leaks is essential to monitor and to control the hydrogen concentration to prevent any possible risk. In our current research, we have developed hydrogen ultrasensitive sensors by depositing a thin film of Au–Pd core–shell nanoparticles (NPs) on a transparent glass substrate in order to detect hydrogen in its gaseous form. The colloidal Au–Pd core–shell NPs were synthesized according to a multi-reduction step method. The structural characterizations, the nature, and the density of Au–Pd core–shell NPs have been characterized by scanning electron microscopy and transmission electron microscopy. The morphology, size, and structure of Au–Pd core–shell NPs can be controlled under synthesis conditions. The size of the core–shell studied in this work is 13 nm for gold NP diameter and 0 nm–2.3 nm for palladium thicknesses. The physical properties of NPs, such as the optical absorbance response under hydrogen, strongly depend on the nature of the shell and the ratio between the core and the shell. At different hydrogen concentrations ranging from 1% to 4%, the optical response changes in the position of the surface plasmon resonance peak on the absorbance spectrum after the first loading/unloading hydrogen cycle. © 2020 Author(s). All article content, except where otherwise noted, is licensed under a Creative Commons Attribution (CC BY) license (http://creativecommons.org/licenses/by/4.0/). https://doi.org/10.1063/5.0023461
I. INTRODUCTION
Hydrogen is the most abundant element in nature. The over-whelming majority of this element is chemically linked in H2O
liquid form as well as in gaseous hydrocarbons. It is colorless, odorless, and tasteless and also undetectable by human senses and extremely flammable.1,2 Due to its flammable behavior, it
is essential to find the means to detect hydrogen precisely and rapidly to avoid any risk of explosion.3 The main purpose of
this work is to develop sensors for hydrogen detection at room temperature and at atmospheric pressure, which are sensitive to the detection at low hydrogen concentrations and at the same time very reactive to limit the risks of inflammation and explo-sion, since the energy required for the explosion is very low (0.017 mJ).2,3
At present, there are multiple technologies existing to detect hydrogen. Hydrogen detection often results from the effects gener-ated by the interaction of hydrogen with a sensing material used. These effects can be catalytic-based, thermal conductivity-based,
electrical and electrochemical-based, mechanical-based, optical-based, and acoustic-based.3,4 The technique used in this work is
based on the exploitation of optical absorption response of Au–Pd core–shell nanoparticles (NPs). Palladium is used because of its high affinity and its great capacity of hydrogen absorption. The Pd hydride formation process plays a crucial role in the response behav-ior of these sensors. The response speed of the sensors is determined not only by adsorption and desorption and by the diffusion of the hydrogen atoms in the Pd films but also by the phase transition reaction [α → β] of the Pd hydride formation at the high hydrogen level.1,3,5,6The absorption of hydrogen by palladium is exothermic
and at steady state follows the following reversible equation:7,8
Pd +x
2H2⇆PdHx. (1) This phenomenon begins with a displacement of the molecules of H2gas toward the surface of Pd where they interact with the atoms
of Pd under the van der Waals forces. The potential energy of the
AIP Advances 10, 105225 (2020); doi: 10.1063/5.0023461 10, 105225-1
radius inducing the adsorption of H2gas on the surface of the metal.9
The adsorbed gas molecules are then dissociated into H atoms and diffuse into the palladium structure.7–9
At different hydrogen concentrations in the range from 1% to 4%, the optical properties of these nanoparticles are evaluated as a function of different hydrogen concentrations. By doing optical absorption analysis, we have found that the surface plasmon reso-nance (SPR) peak on the samples changes the optical behavior: the resonance peak is shifted to the lowest wavelengths after the first loading/unloading hydrogen cycle.
II. METHODS
A. Preparation of Au NPs and Au–Pd core–shell NPs 1. Synthesis of Au NPs
An adapted route10of the known Frens method11was followed
to synthesize gold nanoparticles. In a typical synthesis, 100 ml of a 1 mM HAuCl4solution was heated (130○C) and stirred in a 250 ml
two-necked round bottom flask equipped with a condenser until boiling. Then, 10 ml of a freshly prepared 38.4 mM citrate solu-tion pre-heated at 60○C was added quickly. The gold precursor is
reduced by citrate ions that also serve as surface agents to prevent from aggregation of particles. Testifying the successful reduction of gold ions and formation of nanoparticles, the solution turned ruby red. For 30 min, the solution was heated and stirred and then cooled down to room temperature. The sample was stored at 4○C before
use.
2. Preparation of Au–Pd NPs
The protocol followed to obtain core–shell Au–Pd NPs was adapted from a procedure reported by Liu and Chang.12In a 25 ml
vial at room temperature were sequentially introduced 7.5 ml of deionized water, 1 ml of the previously prepared Au NPs, and varied volumes of a 1 mM H2PdCl4solution. The amount of the palladium
precursor solution was varied (0.5 ml, 0.8 ml, 1.2 ml, and 1.6 ml) to modify the thickness of the Pd shell of the Au–Pd NPs. The result-ing mix was stirred, and 0.75 ml of a 0.01M ascorbic acid solution was added dropwise using a syringe pump at 5 ml/h to reduce palla-dium ions. Then, the solution was stirred for additional 30 min. The color of the final solution varied from dark red to brownish pink with the increase in the used H2PdCl4 solution volumes,
demonstrat-ing the modification of the sample optical properties through the adjustment of this synthesis parameter. Tetrachloroauric(III) acid trihydrate (HAuCl4⋅3H2O, 99.9%), sodium citrate dihydrate (99%),
ascorbic acid (≥99%), and palladium chloride (PdCl2, 99.999%) were
purchased from Carlroth and were all used as received. Deion-ized water (18.2 MΩ cm−1) was used as a solvent throughout the experiments.
3. Sample deposit for investigation of the optical H2
sensing properties
For hydrogen detection, the synthesized Au–Pd NPs were deposited on a glass substrate dropwise. Under air and at room temperature, the solvent was evaporated after each drop. Depend-ing on the number of drops, different densities (amount of NPs per surface unit) of the deposited NPs could be obtained, as demon-strated by scanning electron microscopy (SEM) analysis in Sec.II B.
nesses were selected, and for each of them, two densities of particles, namely, D1 (4 drops) and D2 (7 drops), were deposited onto glass substrates.
B. Synthesis results and characterizations 1. Structural characterization
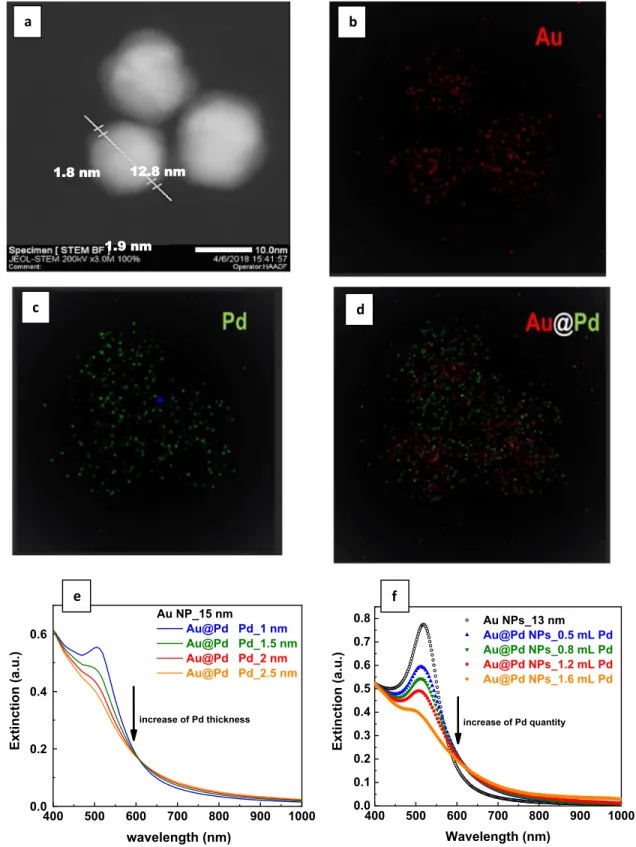
The structural characterizations of the particles were performed using a transmission electron microscope (TEM) (JEOL 2100F) operated at 200 kV and equipped with a camera (Gatan Ultrascan 1000). The images obtained from this analysis technique are pre-sented in Figs. 1(a)–1(d). The prepared gold nanoparticles were mostly spherical with faceted sides and had a mean diameter size of 13.1 ± 1.0 nm, calculated from TEM imaging of 161 NPs. They were coated with Pd, resulting in a core–shell structure of particles with a gold core and a palladium shell. This is clearly observed in the scan-ning transmission electron microscopy high-angle annular dark field (STEM-HAADF) image ofFig. 1(a). Owing to the contrast variation, it is possible to distinguish the brighter Au cores and darker pal-ladium shells. Moreover, the energy-dispersive x-ray spectroscopy (EDS) mapping of the selected zone imaged inFig. 1(a)also con-firms the core–shell structure, as shown inFigs. 1(b)–1(d). Indeed, while the Pd signal inFig. 1(c)seems to cover the entire location of the particles, inFig. 1(b), the gold signal of each particle is well sep-arated from the others. This is due to the presence of the Pd shell on the gold core. It establishes a gap space between the gold nanoparti-cles, and therefore, these later appear well separated. Moreover, the superposition of Au and Pd signals inFig. 1(d)indicates that the gold species are mostly located in the inner parts of the NPs when the Pd signal is also found in the outer part of the particles, confirming the core–shell structure.
Due to the resolution limit of the TEM apparatus in the STEM mode, the shells of Au–Pd NPs synthesized with varied volumes of the Pd precursor smaller than 1.2 ml were difficult to image. Assum-ing a total reduction of the ionic Pd species on the gold cores, the aforementioned volumes were calculated in order to lead to mean thicknesses of about ∼1 nm, ∼1.5 nm, ∼2 nm, and ∼2.5 nm corre-sponding to 0.5 ml, 0.8 ml, 1.2 ml, and 1.6 ml, respectively. For the synthesis with 1.2 ml, TEM images confirmed the expected Pd shell thickness around 2 nm. Based on the result obtained for the syn-thesis involving 1.2 ml of the Pd precursor, and considering what was obtained by the groups of Salamati13 and Park,14it is
reason-able to expect a linear dependence between the amount of precursor and the final Pd shell thickness. Indeed, Sheykhifardet al.13 and
Kimet al.14also reported the variation in the Pd shell
thickness-from 0.9 nm to 6.2 nm and thickness-from 0.7 nm to 7 nm, respectively, with a step of about 1 nm by simply varying the amount of the Pd pre-cursor during the NP synthesis. To further check this point, discrete dipole approximation (DDA) simulations of the samples’ extinction spectra in solution were performed and compared with the exper-imental results from the ultraviolet-visible (UV-VIS)–vis absorp-tion measurements.Figures 1(e)and1(d)present the results of this analysis. The extinction spectra from DDA simulations [Fig. 1(e)] highlight the ultra-sensitivity of these materials’ optical properties to very small modifications of the shell thickness. The experimen-tally obtained results [Fig. 1(d)] are consistent with the calculations; thus, they confirm obtaining the core–shell structure under the
AIP Advances
ARTICLE scitation.org/journal/advFIG. 1. TEM and optical characterizations of Au and Au–Pd NP solutions. (a) STEM-HAADF image of the prepared Au–Pd core–shell NPs with an Au core of ∼13 nm diameter
and a Pd shell of ∼2 nm. [(b)–(d)] EDS mapping of Au (b), Pd (c), and Au–Pd NPs (d). (e) Calculated extinction spectra of core–shell Au–Pd NPs with a 15 nm diameter gold core and Pd shell thicknesses of 1 nm–2.5 nm using the DDA method. (f) Normalized extinction spectra experimentally obtained through UV–vis absorption spectroscopy of the synthesized NPs with various Pd precursor volumes.
AIP Advances 10, 105225 (2020); doi: 10.1063/5.0023461 10, 105225-3
FIG. 2. SEM images and the corresponding size distribution histograms of [(a) and (b)] Au 13 nm–Pd 1.5 nm (D1) and [(c) and (d)] Au 13 nm–Pd 2 nm (D 2), and (e) energy
AIP Advances
ARTICLE scitation.org/journal/advsynthesis conditions of each sample. Subsequently, it can be con-cluded that increasing the palladium amount during the core–shell Au–Pd NP preparation increased the Pd shell thickness.
2. Characterization of the deposited NPs through SEM The samples prepared for investigating the optical H2sensing
properties of the synthesized particles were obtained by deposition of particles on the glass substrate following the procedure reported above.
The topography of the samples has been investigated by SEM as a function of different densities of core–shell nanoparticles. SEM images were obtained on a Zeiss GeminiSEM 500 working at 3 keV with the secondary electron emission with limiting vertical resolu-tions from 1 nm to 20 nm and total yield detection modes to contrast the topographic from the chemical information (Fig. 2). The SEM images are analyzed by software “ImageJ,” which allows us to deter-mine the average size of core–shell nanoparticles and the density in the form of a histogram by the binarization and thresholding of SEM images.
We can observe on large-scale SEM images different sizes of rather spherical form nanoparticles with a brilliant contrast dis-tributed on to the glass slide surface in a rather inhomogeneous way. However, it is possible to find agglomerates of nanoparticles and even in the form of dendrites that appear to be larger sizes. On the images recorded on a smaller scale, the size distribution of the nanoparticles is distributed quite homogeneous [Fig. 2(a)]. Samples 02 and 03 have a symmetrical particle size distribution, around a maximum of 14.5 nm as can be seen in Fig. 2(b), with particle densities around 2780 particles/μm2. Samples 04 and 05 [Fig. 2(c)] have a particle size distribution rather around a maxi-mum of around 15.2 nm [Fig. 2(d)], with particle densities around 2180 particles/μm2. These SEM images are completed by chemi-cal analysis by energy dispersive x-ray (EDX) spectroscopy, which attests the presence of Au and Pd on the surface of our samples [Fig. 2(e)].
By comparing the SEM images of the four-drop and seven-drop samples, we note that the samples with seven seven-drops (D2) contain numerous nanoparticle clusters collected on the edges of the drop; however, with the samples with four drops (D1), a more regular distribution in the center of the drop is noted.
The characteristics of the prepared samples are summarized in
Table I.
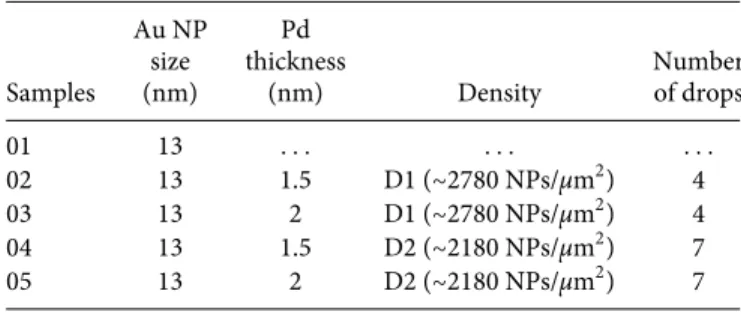
TABLE I.Characteristics of the samples used for the investigation of H2sensing properties.
Au NP Pd
size thickness Number Samples (nm) (nm) Density of drops
01 13 . . . .
02 13 1.5 D1 (∼2780 NPs/μm2) 4 03 13 2 D1 (∼2780 NPs/μm2) 4 04 13 1.5 D2 (∼2180 NPs/μm2) 7 05 13 2 D2 (∼2180 NPs/μm2) 7
FIG. 3. Experimental setup used to measure the absorbance of a sample in a
controlled atmosphere of H2.
III. EXPERIMENTAL CONFIGURATION OF HYDROGEN DETECTION
To characterize the hydrogen response of our system, we used the experimental device presented inFig. 3. We have used the white light of tungsten halogen light sources (model: HL-2000) for mea-surements from 360 nm to 900 nm with a nominal bulb power of 20 W. This white light is projected onto our sample, which is in a vacuum room under N2/H2where the percentage of
hydro-gen is controlled by mass flow control. The optical fiber of 0.5 mm diameter is fixed on an opto-mechanical system, which allows us not only to move the light in three directions (X, Y, Z) but also to have a light spot of 0.3 mm projected on our samples using a focusing lens of 100. Passing through the sample, the light is sub-sequently gathered by a second collection lens that projects this light onto an optical fiber that brings the signal back to the opti-cal spectrometer HR4000CG-UV-NIR (Ocean View) and provides an optical resolution as good as 0.025 nm (FWHM), controlled by a computer.
IV. RESULTS AND DISCUSSION A. Hydrogen response test
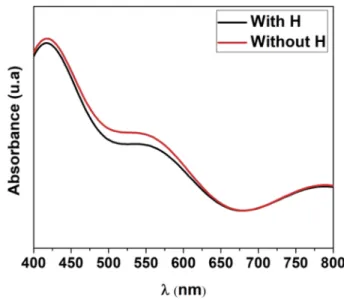
The absorbance spectrum of the Au and Au–Pd core–shell nanoparticles under vacuum (10−2 mbar) and room tempera-ture is measured in the wavelength range from 400 nm to 800 nm [Fig. 4(a)]. The absorbance spectrum of sample 01 with Au nanoparticles shows an obvious SPR band with a maximum peak at 557 nm, and a second band at 715 nm corresponds to particle aggregations, and it is less impacted by core–shell composition. As the size and density of the shell increase, the absorbance spectrum profile changes: the absorbance grows and the SPR band has an enlarged width. A blue shift of the SPR peak is detected from 557 nm to 543.3 nm and 525 nm on two samples (02 and 03) that corre-spond to the thickness of the Pd layer of 1.5 nm and 2 nm, respec-tively. The last two samples (04 and 05) have a wider band shoulder (SPR).
The absorbance spectra of these films at different concen-trations of hydrogen (1%, 2%, 3%, and 4%) at ambient tem-perature and pressure are presented in Table II. After the first absorption/desorption cycle of hydrogen at 1%–2%, the absorbance response of sample 02 [Fig. 4(b)] shows a shift of the SPR peak by 0.8 nm with an increase in absorbance. The slight change is
AIP Advances 10, 105225 (2020); doi: 10.1063/5.0023461 10, 105225-5
FIG. 4. Absorbance spectra of (a) Au NP (13 nm) and core–shell Au (13 nm)–Pd (1.5 nm, 2 nm) and [(b)–(e)] Au–Pd core–shell nanoparticles at different hydrogen
AIP Advances
ARTICLE scitation.org/journal/advTABLE II.Au–Pd core–shell NP properties (samples 01–03) under hydrogen. Au NP Pd NP SPR peak SPR peak
size size position shift Δλ at 4% Samples (nm) (nm) without H2 of H2(nm)
01 13 . . . 557 . . .
02 13 1.5 543.5 17.6
03 13 2 525 18.8
also observed in the absorbance spectrum at 3%: the absorbance increases compared to the first spectrum at 1%, and at 4%, the SPR peak has a shift of 17.6 nm (543.3 nm–525.7 nm) compared to the first spectrum (without H). Sample 03 shows a decrease in absorbance as can be seen inFig. 4(c), and at 4% hydrogen concen-tration, a red shift of 18.8 nm is clearly observed (525 nm–543.8 nm). The sensitivity S is defined as the ratio between the variation of the parameter characterizing the plasmon resonance, which is the wave-length shift Δλ, and the quantity to be measured, which can be the refractive index in refractive units index (RIU) or, in our case, the variation in the hydrogen percentage [S = Δλ (nm)/ΔH (%)]. The sensitivity of our two samples will then be equal to 5.85 nm and 6.19 nm/% hydrogen, respectively.
The spectral absorptions of the other samples (04 and 05) [Figs. 4(d)and4(e)] show that the Au–Pd NPs composed of 1.5 nm and 2 nm of Pd reach their maximum sensitivity at the hydrogen concentration of 1%; this can be explained by the formation of clus-ters and the tendency of aggregation of nanoparticles on the edges of the drop.
From this result, we can conclude that the absorbance of these core–shell NPs depends not only on hydrogenation and dehydro-genation but also on the thickness of the Pd layer. The optical response under hydrogen strongly depends on the ratio between the core and the shell.
When the aggregation of core–shell particles becomes impor-tant (for example, in the case of sample with seven droplets), the effect of hydrogenation on the SPR optical response is hidden, the coupling between particles due to their aggregation. This study shows very well that the optical sensors require a precise compo-sition of the core–shell system and a good control of the particles’ deposition on the optical device.
For the simulation study, we design an FDTD (Finite Differ-ential Time Domain) model based on our experimental parameters. The FDTD calculations are based on the resolution of the Maxwell equations in the time domain. The model leads to more informa-tion (field exaltainforma-tions, transmission, and so on) necessary to study the wave propagation in different materials for different nanostruc-tured systems.15The results are then compared with the
experimen-tal results obtained by the optical spectrum analyzer measurements. The calculations are performed using FDTD Lumerical software and were focused on the light absorption properties of the system.
Figure 5shows the absorption spectra obtained by the FDTD calculations when the sample is under hydrogenation or not.
Figure 5depicts the model for the Au–Pd core–shell system used for the FDTD calculations. This model has been built according to the TEM and SEM observations. The FDTD model is built as follows: an average 13 nm gold NP diameter surrounded by a palladium shell
FIG. 5. FDTD normalized absorption spectra of a spherical Au–Pd core–shell NP
(Au NP diameter is 13 nm and Pd shell is 1.5 nm) with and without hydrogenation.
(thickness goes from 0 nm to 2 nm) is illuminated by a plane wave that propagates along the z-axis. In order to perform all the FDTD simulations, the real and imaginary parts of the dielectric constants of Au and Pd were obtained using Eqs.(2)and(3)with the values of refractive index n and extinction coefficient k measured by Johnson and Christy,
ε1=n2−k2, (2)
ϵ2=2nk. (3)
To simulate the environment without hydrogen, the FDTD simulation was run based on the material’s dielectric constants, and to simulate the H2environment at 4%, we calculated the palladium
dielectric constants upon 4% hydrogenation based on the litera-ture,16we injected these new PdH dielectric constants into the
sim-ulation, and the calculations were run.Figure 5shows the results we obtained.
The curve shows a main absorption edge that starts around 500 nm and reaches a maximum of absorption around 527.1 nm when there is no hydrogenation and 539.3 nm at 4% H2, which
cor-responds to a shift of the SPR peak of 12.2 nm, in good accordance with the experimental results obtained inFig. 5.
The peak is large compared to the absorption shoulder observed in the experimental results, but this is due to the fact that, in the FDTD model, the Au NPs (and the Pd Shell) are perfectly uni-form and spherical and have exactly the same size, whereas the col-loidal solution contains a distribution of Au–Pd NPs with different sizes and core sizes.
V. CONCLUSION
In summary, the hydrogen response of the Au–Pd core–shell NPs films has been determined by studying the variation of the optical absorbance spectra based on the variation in the intensity and shift of the SPR peak at room temperature and atmospheric
AIP Advances 10, 105225 (2020); doi: 10.1063/5.0023461 10, 105225-7
thesized by a growth method reported by Frens.11 Transmission
electron microscopy (TEM) shows not only homogeneous Au NPs with an average size of 13.1 ± 1.0 nm but also the presence of Pd around Au NPs. The increase in the amount of palladium during the synthesis increased the thickness of the Pd shell. The experi-mental results at different hydrogen concentrations ranging between 1%, 2%, 3%, and 4% on the Au–Pd films composed of Au NPs of 13 nm and 1.5 nm of Pd (sample 02) show that the absorbance spectrum presents a shift of the SPR peak of 17.6 nm at 4% of hydro-gen (in accordance with the FDTD simulations) with an increase in absorbance, and a shift of the SPR peak of 18.8 nm at 4% for sample 03. The Au–Pd samples (04 and 05) composed of seven drops reach its maximum sensitivity to the hydrogen concentration at 1%.
SUPPLEMENTARY MATERIAL
See thesupplementary materialfor the complete absorbance spectra.
ACKNOWLEDGMENTS
The authors would like to thank: S. Roques and J. Bar-tringer at ICube/MaCEPV, Strasbourg. J. Faerber (SEM Images) at IPCMS, Strasbourg, is acknowledged for his contributions. Nicolas Javahiraly and Arnaud Brioude acknowledge support of the ANR (Nhyledect Project) from the Agence Nationale de la Recherche (ANR).
DATA AVAILABILITY
The data that support the findings of this study are available within the article and itssupplementary material.
REFERENCES
1H. Song, Z. Luo, M. Liu, G. Zhang, W. Peng, B. Wang, and Y. Zhu, “Centrifugal
deposited Au-Pd core-shell nanoparticle film for room-temperature optical detec-tion of hydrogen gas,”Sensors18(5), 1448 (2018).
nanoparticles-based hydrogen sensors for leak detection,”Sensors19(20), 4478 (2019).
3
T. Hübert, L. Boon-Brett, G. Black, and U. Banach, “Hydrogen sensors: A review,”Sens. Actuators, B157, 329–352 (2011).
4N. Javahiraly, “Review on hydrogen leak detection: Comparison between fiber
optic sensors based on different designs with palladium,”Opt. Eng.54(3), 030901 (2015).
5Z. Zhao, M. A. Carpenter, H. Xia, and D. Welch, “All-optical hydrogen
sen-sor based on a high alloy content palladium thin film,”Sens. Actuators, B113, 532–538 (2006).
6B. D. Adams and A. Chen, “The role of palladium in a hydrogen economy,”
Mater. Today14, 282–289 (2011).
7
M. Segard, “Vieillissement du tritiure de palladium: Caractérisation mécanique, état de l’hélium et modélisation,” Ph.D. thesis, Ecole Nationale Supérieure des Mines de Saint-Etienne, Sciences et Génie des Matériaux, Saint-Étienne, France, 2010.
8T. Kabutomori and K. Ohnishi, “Energy carriers and conversion systems,”
inMetal Hydrides, edited by T. Ohta and T. N. Veziroglu, (Encyclopedia of Life Support Systems, Paris, France, 2008), Vol. 1. [(Accessed on 15 Ocoto-ber 2019)]. Available online: https://www.eolss.net/ebooklib/ebookcontents/E3-13-ThemeContents.pdf.
9
M. Dornheim,Thermodynamics of Metal Hydrides: Tailoring Reaction Enthalpies of Hydrogen Storage Materials (IntechOpen, 2011).
10B. C. Trigo, V. D. García, E. G. Gutierrez, I. Sanhueza, P. Coelho, S. E. Godoy,
S. Torres, and P. Oyarzún, “Slight pH fluctuations in the gold nanoparticle synthe-sis process influence the performance of the citrate reduction method,”Sensors18, 2246 (2018).
11
G. Frens, “Controlled nucleation for regulation of particle size in monodisperse gold suspensions,”Nat. Phys. Sci.241, 20–22 (1973).
12F.-K. Liu and Y.-C. Chang, “Using size-exclusion chromatography to
evalu-ate changes in the sizes of Au and Au/Pd core/shell nanoparticles under thermal treatment,”Chromatographia74, 767–775 (2011).
13Z. Sheykhifard, M. Ranjbar, H. Farrokhpour, and H. Salamati, “Direct
fabrica-tion of Au/Pd(II) colloidal core-shell nanoparticles by pulsed laser ablafabrica-tion of gold in PdCl2solution,”J. Phys. Chem. C119, 9534–9542 (2015).
14D. Y. Kim, K. W. Choi, X.-L. Zhong, Z.-Y. Li, S. H. Im, and O. O. Park,
“Au@Pd core–shell nanocubes with finely-controlled sizes,”CrystEngComm15, 3385–3391 (2013).
15K. Yee, “Numerical solution of initial boundary value problems involving
Maxwell’s equations in isotropic media,”IEEE Trans. Antennas Propag.14(3), 302–307 (1966).
16C. Perrotton, M. Slaman, N. Javahiraly, H. Schreuders, B. Dam, and P. Meyrueis,
“Wavelength response of a surface plasmon resonance palladium-coated optical fiber sensor for hydrogen detection,”Opt. Eng.50(1), 014403-1–014403-8 (2011).
![FIG. 2. SEM images and the corresponding size distribution histograms of [(a) and (b)] Au 13 nm–Pd 1.5 nm (D1) and [(c) and (d)] Au 13 nm–Pd 2 nm (D 2), and (e) energy dispersive x-ray (EDX) spectra.](https://thumb-eu.123doks.com/thumbv2/123doknet/14700648.564685/6.891.112.785.108.995/fig-images-corresponding-distribution-histograms-energy-dispersive-spectra.webp)
![FIG. 4. Absorbance spectra of (a) Au NP (13 nm) and core–shell Au (13 nm)–Pd (1.5 nm, 2 nm) and [(b)–(e)] Au–Pd core–shell nanoparticles at different hydrogen concentrations (1%, 2%, 3%, and 4%).](https://thumb-eu.123doks.com/thumbv2/123doknet/14700648.564685/8.891.123.768.117.1001/absorbance-spectra-shell-shell-nanoparticles-different-hydrogen-concentrations.webp)