HAL Id: tel-01164974
https://tel.archives-ouvertes.fr/tel-01164974
Submitted on 18 Jun 2015HAL is a multi-disciplinary open access archive for the deposit and dissemination of sci-entific research documents, whether they are pub-lished or not. The documents may come from teaching and research institutions in France or abroad, or from public or private research centers.
L’archive ouverte pluridisciplinaire HAL, est destinée au dépôt et à la diffusion de documents scientifiques de niveau recherche, publiés ou non, émanant des établissements d’enseignement et de recherche français ou étrangers, des laboratoires publics ou privés.
processes, implications for climate change
Anais Barella Ortiz
To cite this version:
Anais Barella Ortiz. Analysis and modelling of soil moisture and evaporation processes, implications for climate change. Earth Sciences. Université Pierre et Marie Curie - Paris VI, 2014. English. �NNT : 2014PA066115�. �tel-01164974�
École Doctorale Sciences de l'Environnement d'Ile-de-France
Thèse de doctorat
Présentée par
Anaïs Barella Ortiz
Analysis and modelling of soil moisture and evaporation
processes, implications for climate change
Préparée au Laboratoire de Météorologique Dynamique de Paris
Soutenue le 12 mai 2014
Devant un jury composé de :
Présidente: MME. ANDRÉE TUZET INRA Rapporteurs: MME. ISABELLE BRAUD IRSTEA
M. JEAN-PIERRE WIGNERON INRA Examinateurs: MME. MARÍA PILES UPC
M. GIANPAOLO BALSAMO ECMWF Codirecteur de thèse: M. FILIPE AIRES ESTELLUS Directeur de thèse: M. JAN POLCHER LMD/IPSL
Vamos a embarcar, amigos, para el viaje de la gota del agua.
Es una gota, apenas, como el ojo de un pájaro. Para nosotros no es sino un punto,
una semilla de luz, una semilla de agua,
la mitad de lágrimas de una sonrisa, pero le cabe el cielo
y sería el naufragio de una hormiga. Vamos a seguir, amigos,
la órbita de la gota de agua: De la cresta de una ola
salta, con el vapor de la mañana; sube a la costa de una nube
insular en el cielo, blanca, como una playa; viaja hacia el Occidente,
llueve en el pico de una montaña, abrillanta las hojas,
esmalta los retoños, rueda en una quebrada,
se sazona en el jugo de las frutas caídas, brinca en las cataratas,
desemboca en el río, va corriendo hacia el Este, corta en dos la sabana,
hace piruetas en los remolinos y en los anchos remansos se dilata como la pupila de un gato,
sigue hacia el Este en la marea baja, llega al mar, a la cresta de su ola
y hemos llegado, amigos... Volveremos mañana. Andrés Eloy Blanco (Venezuelan poet 1896-1955)
I am proud of having worked at the LMD with such great colleagues, who I am happy to call friends. Thank you for your hospitality and your friendship during these years.
First of all, I would like to thank my supervisors, Jan POLCHER and Filipe AIRES who gave me the opportunity to do this PhD with such an interesting subject. Thank you for your academical guidance, confidence and support throughout these years. I have learnt a lot from both of you. I am particularly grateful for the assistance given by Agnès DUCHARNE and Andrée TUZET, for their guidance and suggestions as members of my “Comité de Thèse”, as well as Katia LAVAL for her support and scientific discussions. Their advice has been of great help. I wish to acknowledge the help provided by Patricia DE ROSNAY too.
My gratitude for the people from the IC3 in Barcelona for their welcome and their companionship.
Many thanks to Isabelle BRAUD, Jean-Pierre WIGNERON, María PILES, Gianpaolo BALSAMO, and Andrée TUZET for accepting reading my work and being part of the jury of my PhD.
Un grand merci aux gens du LMD à Jussieu. À Laurence TOUCHON et Martine MAHEROU par leur aide concernant les procédures administratifs. À mes collègues de bureau pendant ces années: Jie ZHANG, Nicolas ROCHETIN, Florent BRIENT, Tanguy BERTRAND, Fuxing WANG, Jerónimo ESCRIBANO, et spécialement à Romain PILON et Madeleine-Sophie DEROCHE. Merci beaucoup pour les petit dej's, les leçons de français et tous les bons moments qu'on a passé ensemble. Je veux remercier aussi à Nathalie BERTRAND et Boubacar IBRAHIM pour leur aide pendant le déroulement de ma thèse. Muchas gracias a Alberto CASADO y Solange FERMEPIN por compartir tantos lindos ratos hispano-argentinos juntos. Merci à tous par votre aide et votre amitié.
Moltes gràcies a la meua família i amics. No ho hauria aconseguit sense la vostra ajuda i suport. Gràcies a Amparo i Xavier pels coneixements sobre etimologia i biologia. En especial vull agrair als meus pares el vostre amor, dedicació, esforç, tendresa, ensenyaments,
i més. A Dani per compartir-la. Sou tota una inspiració i aquesta tesi és per vosaltres.
This thesis deals with the study of evaporation and soil moisture, two main parameters of the hydrological cycle, and thus the climate system.
First, potential evaporation (ETP) is analysed. It is an important input to hydrological and agronomic models, key to describe the interactions between the surface and the atmosphere, and the basis of most of the estimations of actual evaporation. Physically-based and empirical methods to estimate ETP are evaluated, at a global scale, under current climate conditions and in a changing climate. The former methods correspond to those implemented in land surface models (LSM) and the Food and Agriculture Organization (FAO) reference evapotranspiration equation. The assumptions made in FAO's method underestimate ETP if compared to LSM methods. They also result in a lower sensitivity of ETP to climate change. In addition, empirical equations are not able to reproduce the impact of climate change on ETP if compared to that from LSM methods.
Soil moisture is the second aim of this thesis. It is treated through the analysis of brightness temperatures (TB). These are a measure of the radiation emitted by the surface, and thus an optimum parameter to use in remote sensing techniques for soil moisture retrieval. Measured TB from the Soil Moisture and Ocean Salinity (SMOS) mission are compared, over the Iberian Peninsula, to two sets of TB modelled estimates from two LSM. There is a good agreement in the temporal evolution between them. However, discrepancies are found regarding the spatial structures, which become more evident during fall and winter and are mainly explained by differences in the annual cycle of measured and modelled TB.
Cette thèse étudie l’évaporation et l'humidité du sol, deux paramètres clefs du cycle hydrologique et du système climatique.
L’évaporation potentielle (ETP) est un paramètre clef pour les modèles hydrologiques et agronomiques qui décrit les interactions entre la surface et l'atmosphère. Il constitue la base des estimations de l'évaporation réelle. Nous avons évalué, à l'échelle globale et pour le climat actuel ainsi que pour les changements attendus, des estimations de l'ETP basées sur des principes physiques ainsi que des approches empiriques. La méthode d'estimation du flux potentiel conseillée par la Food and Agriculture Organization (FAO) montre une sous évaluation par rapport au schéma de surface, ce qui a pu être relié à certaines hypothèses faites. Ceci implique aussi une sensibilité plus faible au changement climatique de la formulation proposée par la FAO. Nous avons aussi constaté que les méthodes empiriques ne représentent pas correctement l'impact du changement climatique sur l'ETP.
L'humidité du sol est analysée du point de vue de la température de brillance en Bande-L (TB). Cette mesure du rayonnement émis par la surface dans une bande spectrale sensible à l'eau dans les premiers centimètres du sol, constitue une des pistes pour l'estimation de l'humidité de surface depuis l'espace. Des mesures de TB ont été comparées, au dessus de la Péninsule Ibérique, à des données simulées par deux schémas de surface. Un bon accord a été trouvé entre les observations et les simulations sur l'évolution temporelle des signaux. Par contre, les structures spatiales peuvent être très différentes au cours de l’automne et l'hiver à cause de cycles annuels très contrastés.
Contents
1 Introduction 3 1.1 General background...4 1.2 Motivation...8 1.3 General methodology...10 1.4 Document structure...122 Presentation of the study framework 15 2.1 The hydrological cycle...16
2.2 The climate change...22
2.3 The Evaporation Concept...27
2.4 Soil Moisture...50
2.5 Land Surface Models...55
2.6 Remote Sensing: SMOS...65
3 Methodology 73 3.1 Introduction...74
3.2 Simulations performed with ORCHIDEE ...75
3.3 Potential Evaporation's sensitivity to climate change...76
3.4 Brightness Temperatures comparison between SMOS's observations and a radiative transfer model output...86
4 Potential evaporation sensitivity to climate change 95 4.1 Introduction...96
4.2 Potential evaporation estimation through an unstressed surface-energy balance and its sensitivity to climate change...97
4.3 Further analysis performed...128
4.4 Partial conclusion...137
5 Comparison of measured and modelled brightness temperatures 139 5.1 Introduction...140
5.2 Soil moisture comparison...141
5.3 Brightness temperature comparison...144
5.4 Partial conclusion and discussion...170
6 Synthesis and perspectives 175 6.1 Synthesis...176
6.2 Perspectives...179
7 Appendices 183 7.1 List of acronyms...184
7.2 List of constants and variables...189
1 Introduction
Contents
1 Introduction...3 1.1 General background...4 1.2 Motivation...8 1.3 General methodology...10 1.4 Document structure...12Indo-European languages are identified as those sharing a mutual origin from the nomadic tribes that extended from India to Western Europe: Hittite, Greek, Tocharian, Armenian, Indian, Iranian, Italic, Celtic, Germanic and Slavonic. To sum it up, most of the European and Asian languages. These did not coincide in time or space, however, common features between them can be identified. Linguists have gathered them together and developed the Indo-European language through reconstruction techniques. Nowadays, we can observe its traces in the current languages.
Various ancient roots to form the word for what we refer to as WATER can be found in Indo-European languages. According to the reconstruction performed by the linguists, WATER in Indo-European was called *wód-r. The adjective *wed (humid) is derived from this root. The current etymons have evolved from this root. Chantraine (1968) explains that these languages used two different kinds of roots for elements like water or fire, an inanimate gender (neutral) or an animate one (feminine). For instance, Greek preferred the first one
hýdor, which has evolved to the prefix hydro-, extensively used in current languages.
Opposite to it, Latin used essentially the feminine form aqua, from which derive the following: “eau” (French), “acqua” (Italian) or “agua” (Spanish). Different Indo-European languages have evolved differently. Among other examples, Germanic ones provide the words “Wasser” (German) and “water” (English), Celtic provides “uisce” (Irish), Slavonic provides “voda” (Russian), etc.
1.1 General background
Water is the main subject of this thesis. Katia and Guy Laval provide in their book “Incertitudes sur le climat” (2013) two key reasons to take water into account regarding the climate. One of them goes back to the past and the other one goes forward to the future.
Let us start by the first of them and go backwards to the past, around 3.5 billion years ago when the origin of life is dated. There is a large number of studies about this matter, being one of the most accepted theories that of the RNA (ribonucleic acid), as explained by Atkins
et al. (2001). Although it has not been determined yet, it has however, been proven that water
was necessary for life to develop and continues to be necessary for it to exist nowadays.
If we travel now to the future to reveal the second key reason, we will find the effect of climate change on water. It is known that water will be (and is currently) impacted by a changing climate. It has to be stressed that these effects can limit the development of some nations, influencing on the geopolitical stability. The authors of the book argue that it is key to identify these effects and their evolution, as well as to define the optimum way to adapt to them. Like that, development will not be limited.
In this thesis, we will deal with water related to climate. We will, however, provide some facts about water linked to very different aspects to remark its relevance and why it is necessary to study it. The objective is to provide the reader with a general background of its importance concerning the current situation, as well as the future one, from different points of view (demographic, sanitation, urbanization, etc.).
The United Nations Environment Programme (UNEP) provides the following statistical facts:
• The total volume of water on Earth is ~ 1.4 109 km3.
• The total volume of freshwater on Earth is ~ 3% of the total volume of water.
In the United Nations World Water Development Report (WWDR) from 2012, it is said that the world's population is growing around 80 million people per year. This results in a considerable increase in water demand which is estimated in 64 billion m3 a year regarding
freshwater. According to the Food and Agriculture Organization (FAO), more than 40% of the world's population suffers from water scarcity problems. This percentage is expected to grow to 66% by 2025. Therefore a correct management of water resources is essential.
It is known that the environment is affected by how humans deal with water resources. For example, the WWDR warns about the fact that, in developing countries, up to 90% of their waste-water flows into rivers, lakes and oceans without having been treated previously. The UN World Water Assessment Programme (WWAP) warns about the current
phenomenon where industries are being relocated in countries with emerging markets, normally developing ones with lower production costs. Some of these industries are very polluting, for example leather or chemical ones. According to this programme, 2 million tons of human waste are thrown into water courses. Separated from the effects this has on food and drinking, among others, it may alter the properties of water masses, affect the hydrological cycle and consequently, the climate system.
The environment and the effect that water pollution has on it is not the only aspect impacted by water management, since it is key in economical and social matters, like agriculture, urbanization or sanitation, for example.
The amount of water estimated to cover the basic daily needs per person is from 20 to 50 litres according to the United Nations. This implies cooking, drinking and cleaning. However, water demand goes further than this estimation. While the daily intake of drinking water is from 2 to 4 litres per person, from 2000 to 5000 litres per person are needed to produce the daily food (FAO). If climate change effect is considered, agriculture may be affected. For example, in Asia it is estimated to be reduced by 20% in the next 15 years due to the reduction predicted of snow and ice from the Himalayas (FAO). The WWDR from 2012 has projected that over the period of 2050, the global population will have grown from 2 to 3 billion people. That means that water necessities will have to be covered for this population, and only in food demand, an increase of 70% is estimated.
Hygiene is also a fundamental need. Nowadays, there are 2.5 billion people living without basic sanitation (WWDR), and the population exposed to water scarcity problems is growing. An example are slums, which according to the UN Human Settlements Programme (HABITAT) will grow by 27 million people per year. The UN inter-agency coordination mechanism for freshwater and sanitation related matters, warns that if little attention is paid to it, cases of cholera and diarrhoeal diseases are likely to increase. For example, the World Health Organization (WHO) report from 2010 explains that during the last decade the cholera cases experimented an increase of 130%.
Water is key in the study and understanding of climate change. An example of the evidence of a changing climate provided by the Intergovernmental Panel on Climate Change (IPCC) is the change in global surface temperature. Four Representative Concentration Pathways (RCPs) covering the radiative forcing values range of the year 2100 (from 2.6 to 8.5 Wm-2) where developed to represent different climates (van Vuuren et al., 2011). Global
surface temperature at the end of the 21st century is likely to increase more than 1.5ºC in all of
them except the lowest one (RCP2.6) if it is compared to the change experimented from 1850 to 1900. What is more, for the higher RCPs (RCP6.0 and RCP8.5), temperature is likely to increase more than 2ºC.
Climate change will impact water resources in several ways. For example, the changes in temperature as well as in precipitation may result in an increase of both the frequency and severity of extreme events like floods and droughts. According to the WWDR, the number of people that may suffer from the effects of floods may increase to 2 billion. Water availability and quality may also be affected by temperature and precipitation variations, as well as altering and deteriorating properties from certain ecosystems. These effects will have an impact on the economical and social matters already discussed, leading to a worse situation by reducing development and increasing poverty. For instance, the UN entity for gender equality and the empowerment of women in its “Gender Dimension of the Millennium Development Goals Report” from 2013, draws the attention to the fact that if the access to water is reduced, more time has to be employed in collecting it. This task is normally carried out by girls and women, and currently most of the children around the World that do not attend school are girls. Therefore, in order to avoid these and other problems that may be caused by climate change, its effect must also be taken into account regarding water resources.
Summing up, the importance of water in many different aspects is well-known and has been stated. It has been observed, however, that nowadays water resources are not being managed in a proper and optimum way, as there are scarcity, hygiene and pollution issues related to it. Furthermore, the increase predicted in population is likely to worsen them. In addition, the effect of a changing climate will have a negative impact on these as well as on
the climate itself. Consequently, it must be taken into account regarding water policies and resource management.
1.2 Motivation
Accurate climate predictions and weather forecasts are essential to develop suitable policies and protocols for water resources management. To perform these, numerical models are used. An Earth System Model (ESM) aim is to describe the climate, representing physical processes which occur in the oceans, cryosphere, atmosphere and land surfaces. Therefore, ESMs may be coupled to different schemes referred to these matters. For example, Land Surface Models (LSMs), that deal with surface processes regarding the surface water and energy balances. These models have evolved in the last decades, improving their surface characterization, coupling a carbon module to them or including processes to ameliorate the hydrological cycle representation (like irrigation or a rooting system). However, there are still issues to improve.
The full understanding of the water reservoirs and processes involved in the hydrological cycle in the first place, and improving their modelling in the second place, are key issues to obtain better climate predictions and weather forecasts. The latter (modelling improvement) is the main objective of this thesis.
In the next chapter, the hydrological cycle will be explained. However, we would like to provide the reader with some brief information about it. Three main water reservoirs can be identified (oceans, atmosphere and land). Water is transferred from one to the other through different processes, out of which precipitation and evaporation are some of the most known ones. In this thesis, we have focused on a key reservoir and process related to land surfaces: soil moisture and evaporation, respectively. They are interesting to study since both of them are key in coupling land and atmosphere, as well as for their impact on human activity (like agriculture), among other reasons. The work carried out is divided into two main studies corresponding to each one of them. It should be noted, however, that they are directly related, since the soil water content will determine if evaporation over land surfaces will be carried
out at a potential rate, and thus controlled by atmospheric conditions, or if it will be limited by the soil moisture itself (Milly, 1992). In addition, soil moisture memory in models has been found to be affected by evaporation, specially in dry regimes (Seneviratne et al., 2006).
The objectives defined to study and improve the modelling of evaporation and soil moisture are detailed below:
Evaporation
Evaporation is the process by which water is transferred from the surface to the atmosphere, as water vapour, through turbulence. In this thesis, we have dealt with it from the point of view of the atmospheric water demand: potential evaporation (ETP). The latter is a
key variable to study since it is the basis of many actual evaporation estimations and it describes the interface between the surface and the atmosphere. We will analyse the approaches used to estimate it, as well as the simplified equations derived from them (physical and empirical), making emphasis on the assumptions made in their derivation. This can be translated in the following objectives:
• Implement a new method to estimate ETP through an unstressed surface-energy
balance in a LSM.
• Analyse the impact of the assumptions made in ETP's estimation by means of physical
based methods.
As we said in the previous section, it is important to study the hydrological cycle over the current climate, but also considering a changing one. In addition, the parameters ETP
depends on are affected by climate change. Therefore, changes in these will have an effect on ETP. So we will also:
• Analyse the impact of changes in atmospheric parameters due to a changing climate on the sensitivity of ETP, estimated using different methods and approaches.
Soil moisture
Soil moisture can be defined as the water held in the spaces that exist between soil particles. In this thesis, we have studied it from a remote sensing point of view. This means that we have worked with brightness temperatures (TB), which is a measure of the radiation emitted by the Earth at a given wavelength. These temperatures are the main component in retrieval algorithms to estimate geophysical variables through remote sensing techniques. One of these variables is soil moisture. The analysis we will perform using brightness temperatures aims to:
• Compare measured and modelled brightness temperatures in order to characterize their temporal and spatial consistency.
This comparison can provide useful information to better understand the temporal and spatial variability of soil moisture in order to improve its modelling.
1.3 General methodology
The work here exposed intends to analyse different aspects of evaporation and soil moisture in the context of modelling. These aspects include their estimation, sensitivity to climate change, temporal evolution and spatial structures. The ORCHIDEE (ORganising Carbon and Hydrology In Dynamic EcosystEms) land surface model (de Rosnay and Polcher,
1998); (Krinner et al., 2005), from the Institut Pierre–Simon Laplace (IPSL), has been used.
Two main studies have been defined. The first one concerning potential evaporation and the second one concerning brightness temperatures. In Section 3, the methodology followed will be explained in more detail. The basic steps are, however, provided in the next paragraphs:
Potential evaporation
• Implement a new method to estimate ETP in ORCHIDEE through an Unstressed
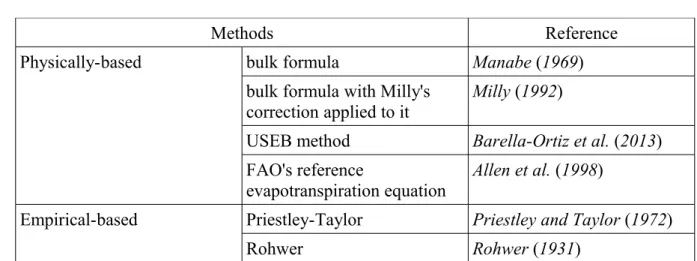
have named it the USEB method. Annual mean estimates from this method will be compared with those from other physically-based methods. These are the bulk formula with Milly's correction for soil moisture stress effect (current methodology used in ORCHIDEE) and FAO's methodology for reference evapotranspiration (Allen et al.
1998), considering a saturated soil. Separated from the comparison, we will analyse
the impact of the assumptions made by FAO's methodology by replacing parameters which are approximated in it by the equivalent ones computed in ORCHIDEE. The Water and Global Change (WATCH) forcing data (Weedon et al., 2011) has been used in this analysis, which has been carried out for the period from 1990 to 2000.
• Analyse the sensitivity of ETP, and the parameters it depends on, to climate change.
Concerning ETP, the analysis will be carried out for different methods developed to
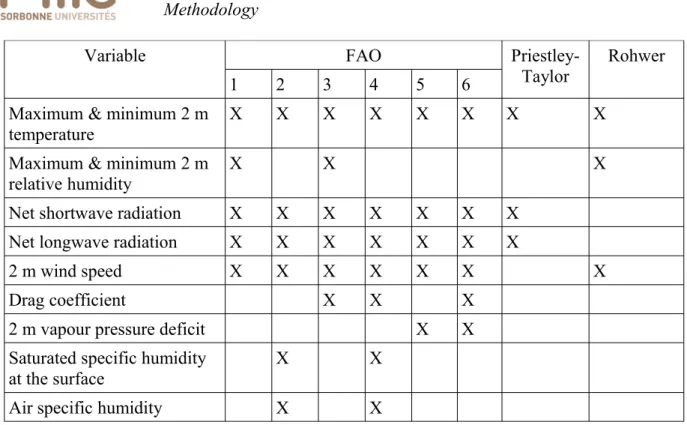
estimate it. We will consider both physically and empirical-based methods using the diffusive and surface-energy balance approaches. The parameters whose sensitivity will be analysed are: the net radiation, aerodynamic resistance, vapour pressure deficit and humidity gradient. To do so, the IPSL model for the A2 scenario of climate change from 2000 to 2100 has been used. The trends provided by the different estimations of ETP and those from the parameters cited above will be computed and
analysed. We aim to identify the key parameters and processes regarding the estimation of ETP, but also their sensitivities and how these impact that of ETP
estimated using different methodologies.
Brightness temperature
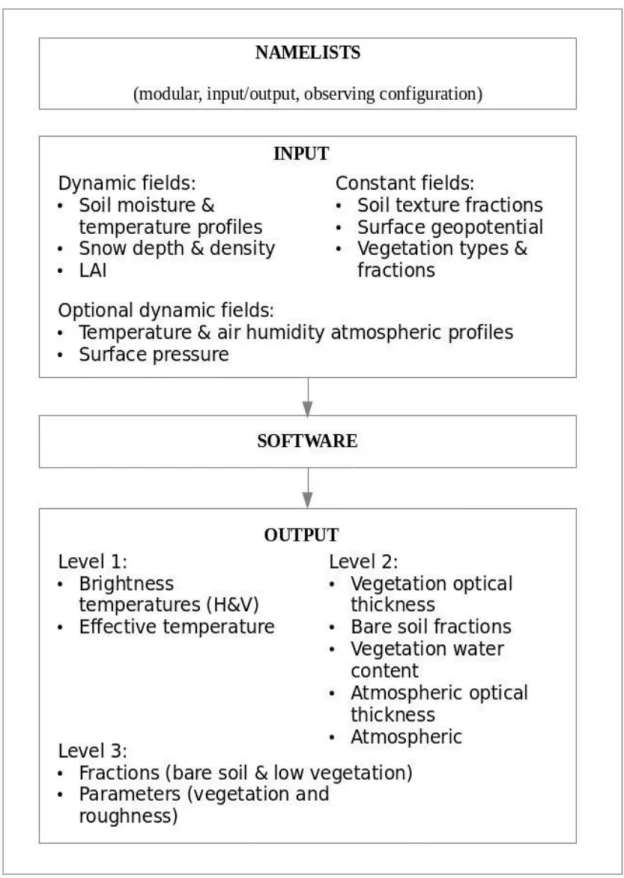
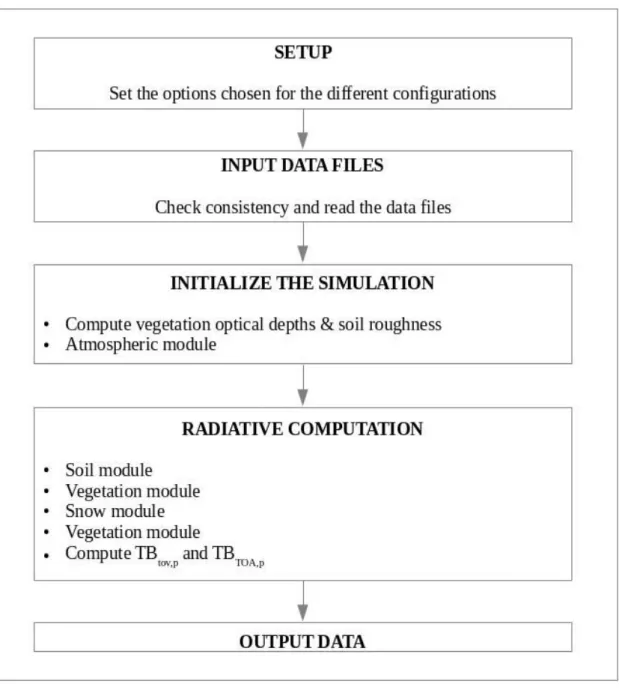
• Estimate TBs using surface state variables simulated by ORCHIDEE. To do so, a radiative transfer code will be used. This is the Community Microwave Emission Model (CMEM), detailed in (
Drusch et al., 2009) and developed at the European
Centre for Medium-Range Weather Forecasts (ECMWF). Modifications will be made in ORCHIDEE's code to provide the CMEM with the required input parameters.
• Compare measured and modelled TBs. The first ones will be provided by the L1C product from the Soil Moisture and Ocean Salinity (SMOS) mission (Kerr et al.,
and ORCHIDEE's output. In addition, a second set of modelled TBs will be used in the comparison. This one has employed the CMEM too, but the input parameters are surface state variables simulated by the Hydrology-Tiled ECMWF Scheme for Surface Exchanges over Land (HTESSEL), detailed in Balsamo et al., (2009). To perform the comparison, a sampling and filtering processes will be carried out regarding modelled TBs. Next, different analysis will be performed in order to analyse the consistency between measured and modelled TBs on both their temporal evolution and spatial structures. To do so, we will decompose the signal into a slow varying component and a fast one. In this study, special attention will be paid to the spatial structures from TBs by carrying out an EOF analysis. This will allow for the identification of large scale patterns which synthesize their inconsistencies.
1.4 Document structure
This thesis is organised in six chapters:
• Chapter 1: Introduction (this chapter)
The subject of the thesis is presented. A general introduction on water has been given, together with the motivation, the main objectives, and the methodology to achieve them.
• Chapter 2: Presentation of the study framework
A general view of the hydrological cycle and climate change, as well as the relation between both of them will be given. The concepts of evaporation in the first place, and soil moisture, in the second one will be discussed. We will expose different types of evaporation, paying special attention to the actual and the potential one. Different methods to estimate these two fluxes and soil moisture will be provided. Since one of these methods is to use land surface models, the ORCHIDEE LSM is introduced and the way it approaches the estimation of these parameters is explained. Finally, a
section is dedicated to remote sensing in order to expose the SMOS mission and provide information about brightness temperature and the CMEM.
• Chapter 3: Methodology
This chapter details the methodology used to carry out the studies for the potential evaporation and the brightness temperature. Each study has been divided into a number of phases which are described in detail. The simulations performed in ORCHIDEE and the modifications made in the LSM's code are explained. Concerning the TB study, the sampling and filtering processes carried out for the modelled TBs and the parametrizations defined for the CMEM are provided. In addition, the analysis performed in both studies are also explained.
• Chapter 4: Potential evaporation sensitivity to climate change
The results obtained for the potential evaporation study are presented in this chapter. In the first place, the work regarding the implementation of the USEB method and its comparison with other estimates over the current climate, as well as the sensitivity study performed for the ETP and its parameters is shown. For this purpose, we have
included the paper published on this work (Barella-Ortiz et al., 2013). Two more analysis regarding ETP's sensitivity at a seasonal scale and the sensitivity of reference
evaporation are provided in this chapter.
• Chapter 5: Comparison of modelled brightness temperatures with SMOS
observations
This chapter deals with the results obtained for the brightness temperature study. To start with, a comparison between measured and modelled soil moisture is provided. The results obtained motivated the comparison between measured and modelled TBs, which is shown next. We will show the temporal evolution of both of them as well as the inconsistency found for the spatial structures. The comparisons done for the slow and fast varying components of the TB's signal, as well as an EOF analysis will be given and discussed.
• Chapter 6: Synthesis and perspectives
A summary of the work carried out and the results obtained in this thesis is given. In addition, perspectives for future research regarding our proposals to improve modelling land surface processes and parameters, related to the hydrological cycle, are exposed.
2 Presentation of the study framework
Contents
2 Presentation of the study framework...15
2.1 The hydrological cycle...16 2.1.1 Atmosphere...17 2.1.2 Oceans...18 2.1.3 Land surfaces...18 2.1.4 Measuring the components of the hydrological cycle...20 2.2 The climate change...22 2.3 The Evaporation Concept...27 2.3.1 Introduction...27 2.3.2 Estimation of actual and potential evaporation ...31 2.4 Soil Moisture...50 2.4.1 Introduction...50 2.4.2 Estimation of soil moisture...51 2.5 Land Surface Models...55 2.5.1 ORCHIDEE ...56 2.5.2 HTESSEL...64 2.6 Remote Sensing: SMOS...65 2.6.1 Brightness temperatures...66
In this chapter, we will present the study framework. We will start by introducing the hydrological cycle, its main water reservoirs and the most important processes that take place in it. In the second place, we will discuss the climate change effect and its impact on the hydrological cycle. We will then focus on the variables studied in this thesis: potential evaporation and soil moisture. To do so, we will revise the concept of evaporation and soil moisture and provide methodologies to estimate them. Among these, we will treat the use of land surface models, and specially the ORCHIDEE LSM, which will be presented. The SMOS soil moisture product will be presented too. Finally the CMEM model, used to compute modelled brightness temperatures, will be described.
When equations are introduced, the variables and constants appearing in them are identified below, except if these have been previously identified.
2.1 The hydrological cycle
The water cycle plays a key role in the climate and environment of the Earth. In the IPCC special report “Managing the Risks of Extreme Events and Disasters to Advance Climate Change” (2012), it is defined as follows:
“The cycle in which water evaporates from the oceans and the land surface, is carried over the Earth in atmospheric circulation as water vapour, condenses to form clouds, precipitates again as rain or snow, is intercepted by trees and vegetation, provides runoff on the land surface, infiltrates into soils, recharges groundwater, and/or discharges into streams and flows out into the oceans, and ultimately evaporates again from the oceans or land surface.”
In other words, it is the cycle describing the water processes that occur above, below and on the surface. The importance of land surface processes must be remarked, as processes like interception, runoff, infiltration and water discharging are an essential part of this cycle. It has to be noted, that both land and water surfaces are considered, as well as all the phases of water. The processes it deals with cover a wide range of time scales and space variability, and
thus should be taken into account as a whole to better understand it. Water assumes different roles in these processes, which in some cases have an opposite effect. For example, the evaporation process favours surface cooling, but water vapour in the atmosphere is a powerful greenhouse gas, which almost doubles the greenhouse warming effect from carbon dioxide (Chahine, 1992).
The diagram from Figure 2.1 represents the long-term mean hydrological cycle (Trenberth et al., 2006). It provides a general view of the water reservoirs and the processes that take place in it.
Reservoirs of different magnitudes may be identified. Oceans provide the largest one (1 335 million of km3) and the atmosphere provides the smallest one (a millionth part of that
of the oceans). The rest is stocked as snow, ice in glaciers and permafrost, water in lakes and rivers, as well as underground storage, like soil moisture and groundwater. If these were grouped into ice and liquid water, we would obtain two reservoirs of the same order of magnitude, around 26 and 15 million of km3, respectively.
2.1.1 Atmosphere
The atmospheric reservoir from Fig. 1 is an order of magnitude smaller than the fluxes. This difference results in a short residence time of water vapour in the atmosphere before condensing and precipitating. Wild (2010) estimated it in a few days and Chahine (1992) in 10 days. Such a brief lifetime implies that water vapour will have an important effect on the climate system. For instance, it will influence the formation of clouds and consequently impact the radiative balance.
Clouds absorb and scatter radiation. On the one hand, they reflect incoming solar radiation which results in a reduction of the direct solar energy received by the surface. On the other hand, they avoid that part of the energy emitted by the surface is re-emitted to space. The role of water in the properties of clouds is key to understand both behaviours. For instance, the cloud's particles, with their size, shape and phase, will affect the distribution of the incident energy it receives, as well as that emitted by the surface. In addition, the cloud's height and the albedo will determine whether the surface will suffer a warming process or a cooling one. If the first one increases, the surface temperature will also increase (Schneider,
1972). However, as the cloud's water content increases, the albedo becomes higher and thus
more solar radiation is reflected, favouring a negative feedback and cooling the surface.
2.1.2 Oceans
They provide the largest water reservoir. Taking into account such a volume of water and its high thermal inertia, oceans will favour heat storing, as well as providing the atmosphere with water vapour. Its mean residence time is of over 3000 years Chahine (1992). However, this varies depending on the depth considered, as it is reduced to weeks, even to days in the superficial layers. Oceans move horizontally and vertically. A distinction can be made between deep and surface circulation. Differences in temperature and in density among the ocean layers, and thus the processes of heat and salinity exchange, are key to describe these movements. The wind is also an important parameter regarding the generation of waves and the ocean's surface circulation.
Increases and decreases of density are driven by salinity, which is a key variable when analysing the ocean's role on the hydrological cycle. The concept and definition of salinity has changed over time. In Wright et al. (2011) an absolute, practical and reference salinity are treated. Generally speaking, it is the amount of dissolved matter in seawater and is affected by evaporation, precipitation, runoff and the melting of ice. Therefore changes in these parameters would result in changes in salinity and thus in the ocean's surface circulation, affecting the hydrological cycle. A clear example is the regulation of the thermohaline circulation. This is the process where warm water that flows towards the North has its temperature reduced and its salinity increased. As a result, the water sinks and flows back to the South. If the ice from the Northern ice-cap is considered to melt, fresh water will be provided to the ocean's salt water, reducing the salinity from the upper layers. Consequently, the pattern described by the thermohaline circulation and, by extension, the hydrological cycle would be altered. Durack et al. (2012) identify ocean salinity patterns with an enhancement of the hydrological cycle.
2.1.3 Land surfaces
The residence time of water in land surfaces is difficult to establish. Significant differences will exist between the superficial layers and the deeper ones, which can make us
think of days or thousands of years. According to Chahine (1992), the mean residence time ranges between 6 and 10000 years depending if water is considered in soil and vegetation or aquifers. Compared to the ocean's influence, the land surface influence on the hydrological cycle involves processes with a higher temporal and spatial variability. For instance, differences between daytime and night-time temperatures are higher. Even when considering only land surfaces, significant differences can be established. For example, forests will show lower amplitudes in daily temperatures than what deserts will show. Another example is water storage in the middle latitudes being related to seasonal fluctuations. In this case, water is stocked in winter and released to the atmosphere in summer.
Soil moisture and vegetation are two main aspects to consider regarding the role of land surfaces in the hydrological cycle. Both soil and surface properties have to be taken into account when analysing soil moisture. For the first group, we can remark the type of soil, its porosity, its density or its capacity to retain water, among other properties. For the second one, the albedo or the roughness which has an influence on the evaporation process, regarding the water vapour transport from the surface to the atmosphere. Vegetation is approached taking into account biological aspects too, like its physiology and morphology which are key in the transpiration process.
Processes depicting the continuous exchange of water from the surface to the atmosphere are also shown in Fig. 2.1. Analysing the flow values, we can identify two principal processes which are evaporation and precipitation. From a global point of view, evaporation exceeds precipitation over the oceans (413 km3y-1 vs. 373 km3y-1), and the
opposite occurs over land surfaces (73 km3y-1 vs. 113 km3y-1) (Trenberth et al., 2006). These
differences between them are explained by two other processes, the atmospheric water vapour transport from the ocean to the land and runoff. The excess of evaporation from the oceans is driven by the wind and contributes to rainfall over the land. Therefore, precipitation will exceed evaporation and the water will be returned to the oceans as runoff.
It has to be noted that:
• Water exchanges between the above mentioned reservoirs are normally linked to a change in the water phase (Chahine, 1992). Like evaporation from the surface to water
vapour in the atmosphere, sublimation from the poles and glaciers or condensation to form rain drops, and solidification to form ice crystals.
• Atmospheric and surface processes from the hydrological cycle deal with the combined effect of energy and hydrology. For instance, the effect that clouds have on the radiative balance. In addition, out of the important gases in the atmosphere, water vapour is the most abundant (as well having a high variability). It has a key role as a greenhouse gas (Goody and Young, 1989). Dessler et al. (2013) discuss about a stratospheric water vapour feedback, which may have significant effects in the climate system. Warmer climate will increase water vapour in the stratosphere and that will lead to a further warming caused by the fact that water vapour is a greenhouse gas. They have estimated this feedback in +0.3 Wm-2K-1. Concerning surface processes
Wild (2010) considers the surface-energy balance as a main driver of the hydrological
cycle. In his paper, he remarks the strong relation between precipitation and evaporation and how this implies that most of the precipitated water will be re-evaporated to the atmosphere. Therefore, changes in either one of these two processes will affect the intensity of the hydrological cycle. For example, a change in evaporation caused by a change in net radiation, which is key in the radiative balance.
In this study, we will focus on the surface hydrological cycle which deals with the processes directly related to the surface, like evaporation and soil moisture storage, which are linked to the two main variables we will study: i) potential evaporation and ii) brightness temperature (used to retrieve soil moisture through remote sensing techniques).
2.1.4 Measuring the components of the hydrological cycle
Among the different processes from the hydrological cycle, estimating evaporation over land surfaces offers a great difficulty. A similar issue occurs with the water content in land surfaces. Although the water storage can be obtained for open water surfaces, like lakes,
it is not a trivial problem to solve regarding soil moisture. In Section 2.3.2 and 2.3.4, a review of some of the methodologies developed to obtain them will be given.
Trenberth et al. (2006) comment that estimating the annual mean values to describe the hydrological cycle is not an easy task to perform. The reason is that there are “large uncertainties” in many of the estimations. They explain that when tracing back some references, either there is no statement of source or this is uncertain. In fact, they dedicate Section 3 of their paper to the trace-back and origin of the data showed in Fig. 2.1. Related to this matter, Peter H. Gleick says in his book “Water in Crisis” (1993) that “Good water data are hard to come by”. He referred to the fact that different techniques to collect data can be found between regions and even from one year to the other. Some examples can be found if the former reports from the US Geological Survey are compared to the latter, and how the data was treated in terms and units, as well as in the analysis made. Peter H. Gleick also offers an ethical point of view in his book, by exposing the idea that in some cases an objective way of collecting data is performed, whether in others it is done according to an ideological or political idea.
As science develops and scientific instruments and measuring techniques are improved, the risks above mentioned are likely to be reduced. However, we want to draw the reader's attention to the fact that water circulation and storage, this is the hydrological cycle, are not simple to measure or model and consequently to analyse. On the contrary, it is a complex system involving various processes of different space and time variability which are to be considered. To achieve this purpose, it is becoming more and more evident that we need to approach it with multidisciplinary teams and putting together the advantages provided by models and observations. In fact, remote sensing will be key for this purpose in two different ways. The first one is by providing estimates over a global spatial coverage in a short time period. The second one, that it can interact with models, leading to data assimilation techniques, but also to improve both the modelling and the satellite retrieval.
2.2 The climate change
As done for the previous section, we provide here the IPCC's special report definition of climate change:
“Climate change refers to a change in the state of the climate that can be identified (e.g., by using statistical tests) by changes in the mean and/or the variability of its properties, and that persists for an extended period, typically decades or longer. Climate change may be
Figure 2.1: Schematic representation of the hydrological cycle. Estimates of the main water
reservoirs, given in plain font in 103 km3, and the flow of moisture through the system, given
due to natural internal processes or external forcings, or to persistent anthropogenic changes in the composition of the atmosphere or in land use.”
In its definition, the IPCC resorts to that from the United Nations Framework Convention on Climate Change (UNFCCC), by quoting its definition of climate change as “a change of climate which is attributed directly or indirectly to human activity that alters the composition of the global atmosphere and which is in addition to natural climate variability observed over comparable time periods”.
It must be noted that the climate change caused by human activities that have an effect on the atmospheric composition is distinguished from the climate variability due to natural causes. Several studies have been carried out in order to analyse the anthropogenic effect on climate change. In Pokhrel et al. (2012), it is said that the increase observed in the sea level can not only be explained by climatic factors, like the melting effects of glaciers, but that human factors are also impacting it. To show it, the following data is provided: the global sea level increased around 1.8 mmy-1 during the second half of the 20th century, out of which
around 1.1 mmy-1 are explained by climatic factors. The 0.7 mmy-1 left are due to
anthropogenic impacts, like artificial reservoirs or groundwater use. Boucher et al. (2004) shows that irrigation influences water vapour concentration and proposes it as a key mechanism of climate change.
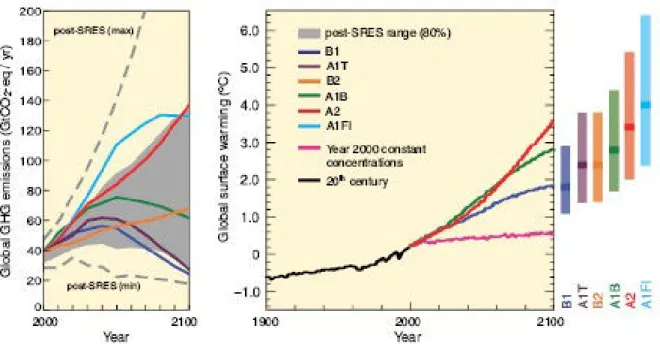
Increase in GreenHouse Gases (GHG), is one of the main drivers of climate change, and among other significant effects, increase in temperature is one of the most acquainted throughout the world. Figure 2.2 shows greenhouse gases emissions, without additional climate policies, and the projections of surface temperature of 6 different scenarios, from 2000 to 2100. This figure belongs to the “Climate Change 2007: Synthesis Report” developed by the IPCC.
The need to work with different scenarios is explained by the fact that climate change depends on many different aspects. These not only involve science, but demographic, economic and technological issues that will influence climate change effect and the magnitude of its impact. These concepts were taken into account to derive the scenarios used
in the IPCC synthesis report, and are detailed in the Special Report on Emissions Scenarios (SRES) from 2007.
The synthesis report from the IPCC (2007) offers a general view of climate change. It studies changes that have been observed in the climate system and their causes, as well as providing projections of future climate change and their possible impacts too. The report also approaches the matter of how to adapt and reduce the impact of climate change.
Figure 2.2: GHG emissions and surface temperature projections (IPCC).
Left panel: Global GHG emissions in the absence of additional climate policies: six illustrative SRES marker scenarios (coloured lines) and 80th percentile range of recent scenarios published since SRES (post-SRES) (gray shaded area). Dashed lines show the full range of post-SRES scenarios. The emissions include CO2, CH4, N2O and F-gases.
Right panel: Solid lines are multi-model global averages of surface warming (relative to 1980-1999) for the SRES scenarios A2, A1B and B1, shown as continuations of the 20th
century simulations. The pink line is for the Atmosphere-Ocean General Circulation Model (AOGCM) simulations where atmospheric concentrations are held constant at year 2000 values. The bars in the right of the figure indicate the best estimate (solid line within each bar) and the likely range assessed for the six SRES marker scenarios at 2090-2099 relative to 1980-1999.
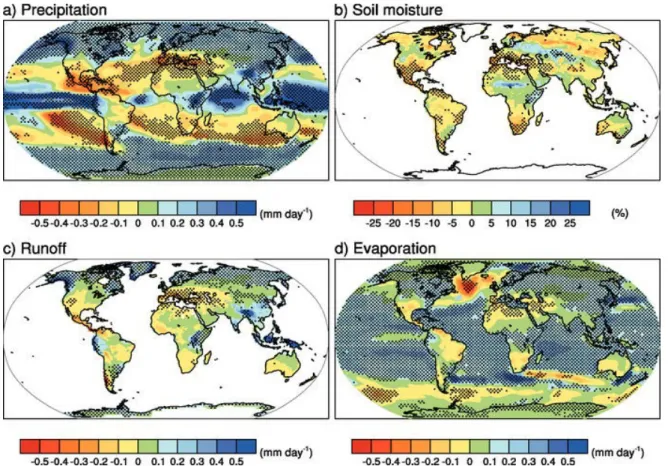
At the beginning of this chapter, the importance of water in the climate system has been established. In addition, strong correlations between temperature and precipitation have been found in many regions, showing a clear relation between these variables. Therefore, it is likely that processes from the hydrological cycle will be affected by climate change. Figure 2.3 shows multi-model mean changes in some of the hydrological cycle's main processes, computed using the SRES A1B scenario, for the period correspondent to 2080 – 2099 relative to the same decades of the 20th century.
Figure 2.3: Multi-model changes in precipitation, soil moisture, runoff and evaporation
(IPCC). Multi-model mean changes in (a) precipitation (mm day–1), (b) soil moisture content (%), (c) runoff (mm day–1) and (d) evaporation (mm day–1). To indicate consistency in the sign of change, regions are stippled where at least 80% of models agree on the sign of the mean change. Changes are annual means for the SRES A1B scenario for the period 2080 to 2099 relative to 1980 to 1999. Soil moisture and runoff changes are shown at land points with valid data from at least 10 models.
Some of the observed effects caused by climate change are related to the increase of atmospheric vapour and changes in the patterns described by precipitation, as well as its intensity and extremes (Westra et al., 2013). Others deal with surface processes, like the snow and ice melting, and its effect on the sea level, or changes in runoff and soil moisture. For the latter one, most of the existent records are not sufficiently long in time so as to perform climate change analysis. Robock et al. (2000) studied soil moisture trends for those regions with longer historical records (in Russia, Mongolia and USA) and found that most of these increased during Summer. This could be related to an increase in precipitation trends, which overcompensated those yielded by evaporation. In fact, evaporation has also shown behaviours that may be explained by climate change. Great part of the study carried out in this thesis has been dedicated to the analysis of how will atmospheric parameters affected by climate change, impact the estimation of potential evaporation. Golubev et al. (2001) analysed evaporation trends during the warm season from the second half of the 20th century in similar
regions to those used by Robock. The results showed an increase in trends which was explained by i) the increase in precipitation, favouring the soil water content and ii) a higher atmospheric demand caused by the temperature increase. However, it must be stressed that changes in CO2 concentration should also be taken into account when considering climate
change possible impacts on evaporation. The IPCC report draws the attention on two opposite effects caused by an increase of CO2 concentration. On the one hand, the stomata of leaves
will not need to open as much as it does in the current climate to carry out photosynthesis. This can result in a reduction of transpiration, or in other words, in the process regarding water evaporation from plants. On the other hand, it may favour the growth of plants, which would lead to a wider area of vegetated surface and thus, to an increase in transpiration. As it is said in the report, other aspects like the type of vegetation or changes in water content and temperature will be determining in the impact that an increase in CO2 concentration may have
on evaporation.
Studies regarding the effects of climate change beyond the 21st century show that even
if the concentrations of GHG were maintained stable for the B1 and A1B scenarios, warming would increase in 0.5ºC in 2200. The sea level would also increase from 0.3 to 0.8 m during the 22nd century. The main reason are the long time scales from the climatic processes, like
2.3 The Evaporation Concept
In the first place, the evaporation concept will be explained. We will go through different types of evaporation, like the actual, potential and reference ones. We will then focus on the estimation of actual evaporation (ET) and potential evaporation (ETP) by
discussing various methodologies to estimate them. Actual evaporation will be classified into fundamental equations, observation and estimation methods, and remote sensing methods. ET's estimation through LSMs will also be discussed, introducing the Budyko scheme. This scheme will give way to the explanation of methods to estimate ETP. These will be grouped
into physically and empirical-based methods.
It has to be noted that whenever we refer to potential evaporation, we will be dealing with estimates of it. The reason is that ETP is a conceptual flux. In addition, its estimates may
differ according to the assumptions and methods used to approach it.
2.3.1 Introduction
If a wet surface and the air surrounding it are considered, two processes can be identified describing the exchange of water molecules between them. When molecules move from the air to the surface, condensation occurs. The opposite process, molecules moving from the surface towards the air, is called vaporisation (Shuttleworth, 1992), which is related to evaporation. The difference between condensation and vaporisation is known as the evaporation rate.
In the previous sections, it has been noted that water exchanges regarding processes from the hydrological cycle imply a change of phase. The concept of evaporation encompasses processes where liquid water is transferred to the atmosphere as water vapour through turbulence. In these, energy is absorbed and the surface is cooled. Shukla and Mintz (1982) estimated the impact of this cooling effect on the surface temperature and found that from 20º South northwards, the temperature would increase about 15ºC to 20ºC if no evaporation occurred. When the process of evaporation takes place in the leaves of a plant, i.e., through leaf stomata, it is called transpiration (Dingman, 1992). In fact, a distinction can be made between the estimation of this parameter and that of others related to meteorological
processes, like precipitation for example. The reason is that plant physiology is involved in evapotranspiration, meaning that it is not only related to meteorology, but also to biology.
The term evapotranspiration appears when both evaporation and transpiration take place. In fact, evaporation and evapotranspiration are sometimes used indistinctly in the literature. We will use the latter one in those cases where the methodology adopts it, but whenever there is no clear allusion to it, we will talk about evaporation. It should be remarked that we will not deal with sublimation of snow or ice.
Various types of evaporation processes have been identified. The most relevant ones are defined below:
2.3.1.1 Actual evaporation (ET)
It is the quantity of water that is actually transferred as water vapour to the atmosphere from an evaporating surface (Wiesner, 1970). This surface can vary: ocean, rivers, lakes, soil, vegetation, etc. Actual evaporation can be decomposed into the evaporation of bare soil, the vegetation transpiration and the evaporation for rain interception.
There are five basic climatological parameters in its computation. The first two are the available radiative energy and the air temperature, which provide the energy needed to vaporise the molecules. The third one is the air humidity, which is key in the vapour pressure gradient between the surface and the atmosphere. This gradient is the driving force that removes water vapour from the surface. It has to be noted that the vapour pressure deficit is used instead of the gradient in some methodologies. The fourth one is the wind speed, which is in charge of generating the turbulence needed to transfer the saturated air to the atmosphere, replacing it by a drier one. This action allows the evaporation process to continue. Otherwise, the air above the evaporating surface would end up saturating, and the evaporation would eventually cease. Finally, there is the water availability to be evaporated. In addition to these parameters, other surface variables are also important, like the saturated specific humidity (to compute the above mentioned vapour pressure gradient), or the type of vegetation (which defines the roughness and albedo that have also an impact on evaporation).
2.3.1.2 Potential evaporation (ETP)
The literature provides different definitions for the concept of “potential evapotranspiration”. It was coined in 1948 by Thornthwaite, when he referred to it not as the actual transfer of water to the atmosphere but the one that would be “possible under ideal conditions of soil moisture and vegetation”. To do so, he put as an example that the desert's vegetation is sparse due to the fact that water availability is deficient. However, if there was more water, vegetation would take profit of it, use it and increase its presence.
He highlighted some important facts, like that it has to be determined experimentally since it can not be measured directly, and that it depends only on climate conditions, because the availability of water is assumed to be complete. He also remarked that just as actual evaporation, potential evaporation is an important climatic parameter. Among other reasons, it allows to define the moisture availability factor (β).
The concept has been redefined and modified, and various definitions can be found for it. For instance, Granger (1989) identifies five different types of potential evaporation. All of them share in common that it is the evaporation rate that would occur if the surface was saturated, but vary depending on the fact that i) the energy supply to the surface, ii) the atmospheric parameters, and / or iii) the surface temperature are held constant or not. Out of the five definitions, three of them are selected arguing that either the definition provides an easy methodology to estimate potential evaporation, or appropriate limits for evaporation from a non-stressed surface.
The above paragraph shows that there is not a unique stated ETP definition. In
addition, since the definitions differ, the estimations are not likely to be equal. It should to be noted too that, for the same definition, implementations may adopt different assumptions. Therefore, all of these reasons evidence the complexity of the analysis of this variable.
In the study carried out for this thesis, the ETP is considered to be the amount of
evaporation that would occur if enough water was available in the surface. No land surface process is considered to limit it. In other words, it is the atmospheric demand for water. Therefore, recalling the five key climatological parameters in the computation of the actual
evaporation, the availability of water to evaporate is not considered in the estimation of potential evaporation. The other four parameters remain important ETP parameters.
2.3.1.3 Reference evapotranspiration (ETo)
Allen et al. (1998) define ETo as the evapotranspiration rate from a reference surface.
The reference surface is a “hypothetical grass reference crop with an assumed crop height of 0.12 m, a fixed surface resistance of 70 sm-1 and an albedo of 0.23”. It describes it as an
extensive surface of green well-watered grass of uniform height, actively growing and which completely covers the ground. Since the surface resistance is known, the only factors ETo
depends on are climatological parameters. The four basic ETP parameters (available radiative
energy, air temperature, humidity gradient / deficit and the wind speed) remain important ETo
parameters. There is, however, an important difference between these two concepts, which is the land surface characterization. As detailed in the definition of the reference surface, there are parameters like the height, type and homogeneity of crop and albedo that are fixed.
The Food and Agriculture Organization (FAO) reference evapotranspiration equation provides a methodology that is recommended as the standard for estimating ETo. Its aim is to
study the atmosphere's evaporative demand independently of the type, development and management of the surface's crop. Further on, crop evapotranspiration may be computed by multiplying ETo by the crop coefficients. These are computed taking into account the
characteristics that differ the crop from the reference surface described above. There are two types of coefficients, single and dual (distinguishing crop transpiration and soil evaporation).
2.3.1.4 Pan evaporation (ETPpan)
ETPpan is the amount of water that evaporates from a pan. Allen et al. (1998) explain
that pan evaporation shows the integrated effect of radiation, temperature, humidity and wind on evaporation from an open-water surface. Its measure can be converted to reference evaporation by applying empirical coefficients, called pan coefficients. However, it has to be noted that precautions must be taken. For example, the energy exchange between the borders and bottom of the pan must be considered regarding the energy balance. In addition, heat storage might be significant, causing evaporation during the night, opposite to most crops which transpire during daytime. Solar radiation reflection from water in the shallow pan and
grass will differ, as well as the state of the air, regarding turbulence, temperature and humidity, above both surfaces. The pan must also be surrounded by a fence to prevent animals drinking the water. For Brutsaert and Parlange (1998), ETPpan can be considered as a
good indicator of actual evaporation, but only when there is enough supply of soil moisture. There are different types of pans. For example, if Class-A pans are to be compared with Colorado ones, it will be found that they differ in their shape (circular vs. squared), depth (25cm vs. 46cm), and material (galvanized iron vs. thick iron), among others. The setting also varies. While, A-pans are to be mounted on a wooden open frame, the Colorado ones are located in the soil. Due to these differences, the pan coefficients are pan specific. Their computation is approached in different ways: i) comparing pan evaporation with open-surface water estimates or by ii) empirically-derived relationships (Kohler et al., 1955) ; (Allen et al.,
1998).
Pan evaporation is an important parameter to take into account. Among other reasons, this method provides a large temporal record of measured data corresponding to evaporation from an open water surface. In this thesis, we will not work with this concept. However, we wanted to draw the reader's attention to the fact that there are further evaporation concepts, apart from the actual, potential and reference ones.
2.3.2 Estimation of actual and potential evaporation
The aim of this section is to provide the reader with a general background of the main methodologies that exist to measure actual evaporation. These will be divided into fundamental equations, observation and estimation methods, as well as remote sensing and LSM methods.
2.3.2.1 ET from fundamental equations
The computation of evaporation can be approached through the use of two fundamental equations: the energy and water balances. In fact, throughout this section, we will deal with methods which are based on them.
Energy balance
LET can be obtained as a residual from the energy balance:
Rn=H LET G (1) Rn = net radiation
H = sensible heat flux
L = latent heat of vaporisation ET = actual evaporation G = soil heat flux
It has to be noted that LET is the evaporation rate. This method is suitable when data is available for the rest of the variables. For example, some of the methods we will see, like the use of scillomenters, provide measurements of the H. Rn is given by the sum of the
incident downward and upward shortwave and longwave radiations. It can be obtained through the use of remote sensing techniques or LSMs. Methods to estimate G range from simple ones (like approaching it through the Rn ) to more complex ones (like the use of
specific sensors or through numerical models) using the canonical one-dimensional heat diffusion equation (Carslaw and Jaeger, 1959).
Water balance
ET can be obtained from the water balance:
P=ET Qdw dt (2)
P = precipitation Q = runoff
dw/dt = change in soil moisture storage
One of the main advantages of using this method is that the estimation can be performed at different spatial scales. There is even a methodology developed to estimate evaporation through the atmospheric water balance.