HAL Id: hal-01320725
https://hal.sorbonne-universite.fr/hal-01320725
Submitted on 24 May 2016
HAL is a multi-disciplinary open access archive for the deposit and dissemination of sci-entific research documents, whether they are pub-lished or not. The documents may come from teaching and research institutions in France or abroad, or from public or private research centers.
L’archive ouverte pluridisciplinaire HAL, est destinée au dépôt et à la diffusion de documents scientifiques de niveau recherche, publiés ou non, émanant des établissements d’enseignement et de recherche français ou étrangers, des laboratoires publics ou privés.
inequalities in depressive symptoms: results from the
national French SUMER survey
Isabelle Niedhammer, Thomas Lesuffleur, Thomas Coutrot, Jean-François
Chastang
To cite this version:
Isabelle Niedhammer, Thomas Lesuffleur, Thomas Coutrot, Jean-François Chastang. Contribution of working conditions to occupational inequalities in depressive symptoms: results from the national French SUMER survey. International Archives of Occupational and Environmental Health, Springer Verlag, 2016, �10.1007/s00420-016-1142-6�. �hal-01320725�
Contribution of working conditions to occupational inequalities in depressive symptoms: results from the national French SUMER survey
Isabelle Niedhammer1,2, Thomas Lesuffleur1,2, Thomas Coutrot3, Jean-François Chastang1,2
1
INSERM, UMR_S 1136, Pierre Louis Institute of Epidemiology and Public Health, Department of social epidemiology, F-75013, Paris, France
2
Sorbonne Universités, UPMC Univ Paris 06, UMR_S 1136, Pierre Louis Institute of Epidemiology and Public Health, Department of social epidemiology, F-75013, Paris, France
3
Ministry of Labour, DARES, Paris, France
Correspondence to:
Dr. Isabelle Niedhammer INSERM UMRS 1136 IPLESP, Team 7 (ERES)
Faculté de Médecine Pierre et Marie Curie - pôle Saint-Antoine 27 rue de Chaligny
F-75012 Paris, France
Email: isabelle.niedhammer@inserm.fr
Word count of abstract: 250 Word count of text: 4809 Number of references: 42 Number of tables: 5
Conflict of interest statement
ABSTRACT
Objectives: Social inequalities in mental health have been observed, but explanations are still
lacking. The objectives were to evaluate the contribution of a large set of psychosocial work factors and other occupational exposures to social inequalities in mental health in a national representative sample of employees.
Methods: The sample from the cross-sectional national French survey SUMER 2010
included 46,962 employees, 26,883 men and 20,079 women. Anxiety and depression symptoms were measured using the Hospital Anxiety and Depression (HAD) scale. Occupation was used as a marker of social position. Psychosocial work factors included various variables related to the classical job strain model, psychological demands, decision latitude, social support, and other understudied variables related to reward, job insecurity, job promotion, esteem, working time/hours and workplace violence. Other occupational exposures of chemical, biological, physical and biomechanical nature were also studied. Weighted age-adjusted linear regression analyses were performed.
Results: Occupational gradients were found in the exposure to most psychosocial work
factors and other occupational exposures. Occupational inequalities were observed for depressive symptoms but not for anxiety symptoms. The factors related to decision latitude (and its sub-dimensions, skill discretion and decision authority), social support and reward (and its sub-dimensions, job promotion, job insecurity and esteem) contributed to explain occupational inequalities in depressive symptoms. Decision latitude played a major role in the explanation. Workplace violence variables contributed among men only. Other exposures of physical and biomechanical nature also displayed significant contributions.
Conclusions: Comprehensive prevention policies at the workplace may help to reduce social
inequalities in mental health in the working population.
Key words: social inequalities in health; mental health; depressive symptoms; psychosocial
INTRODUCTION
Social inequalities in health have been observed in a large number of studies and showed marked differences in health between lower and higher social groups. These differences have been reported for various health outcomes, including common mental disorders (Fryers, Melzer & Jenkins, 2003; Fryers, Melzer, Jenkins & Brugha, 2005; Lorant, Deliege, Eaton, Robert, Philippot & Ansseau, 2003; Muntaner, Eaton, Miech & O'Campo, 2004). Social inequalities in mental health have been found for depression and anxiety, and for various social position indicators, such as education, income and occupation. However, the results were not always consistent and could differ between studies. In particular, it has been suggested that these inequalities could be stronger among the general population than among the working population, and for depression more than for anxiety (Murcia, Chastang & Niedhammer, 2015). Understanding social inequalities in mental health and identifying factors that may contribute to explain these inequalities may be very useful to reduce both the exposure to these factors and these inequalities.
Mental health represents a major public health concern among the general population, and is also a major occupational health issue because of its high social and economic costs among the working population (Birnbaum, Kessler, Kelley, Ben-Hamadi, Joish & Greenberg, 2010; Kessler, Akiskal, Ames, Birnbaum, Greenberg, RM et al. 2006). Among the work environment factors, psychosocial work factors have been found to play an important role on mental health (Bonde, 2008; Netterstrom, Conrad, Bech, Fink, Olsen, Rugulies et al. 2008; Nieuwenhuijsen, Bruinvels & Frings-Dresen, 2010; Siegrist, 2008; Stansfeld & Candy, 2006; Theorell, Hammarstrom, Aronsson, Traskman, Grape, Hogstedt et al. 2015), in particular the factors from the job-strain model (Karasek, Brisson, Kawakami, Houtman, Bongers & Amick, 1998), which are the most studied, and those from the effort-reward imbalance model (Siegrist, Starke, Chandola, Godin, Marmot, Niedhammer et al. 2004). Work environment through its multiple exposures may be considered as an important determinant of health, and psychosocial work exposures may be considered as the leading occupational risk factors for mental health. Studies also reported a higher prevalence of exposure to psychosocial work factors among lower social groups (Kristensen, Borg & Hannerz, 2002), suggesting that these factors may be one of the sources of social inequalities in mental health.
Few studies examined the contribution of psychosocial work factors in the explanation of social inequalities in mental disorders or mental health outcomes (Laaksonen, Martikainen, Lallukka, Lahelma, Ferrie, Rahkonen et al. 2009; Marmot, Fuhrer, Ettner, Marks, Bumpass & Ryff, 1998; Matthews, Power & Stansfeld, 2001; Power, Stansfeld, Matthews, Manor & Hope, 2002; Schutte, Chastang, Parent-Thirion, Vermeylen & Niedhammer, 2015; Sekine, Chandola, Martikainen, Marmot & Kagamimori, 2006; Stansfeld, Head, Fuhrer, Wardle & Cattell, 2003; Stansfeld, Head & Marmot, 1998; Virtanen, Koskinen, Kivimaki, Honkonen, Vahtera, Ahola et al. 2008). Studies underlined the importance of the job strain model dimensions in explaining these inequalities, in particular job control or decision latitude (Marmot et al., 1998; Schutte et al., 2015; Sekine et al., 2006; Stansfeld et al., 2003; Stansfeld et al., 1998; Virtanen et al., 2008) but also job strain as the combination of high demands and low control (Matthews et al., 2001; Power et al., 2002) and social support (Schutte et al., 2015; Sekine et al., 2006; Stansfeld et al., 2003; Stansfeld et al., 1998; Virtanen et al., 2008). Some rare studies showed that other factors may contribute such as job insecurity (Matthews et al., 2001; Power et al., 2002; Schutte et al., 2015; Virtanen et al., 2008), work-family conflicts (Laaksonen et al., 2009; Schutte et al., 2015; Sekine et al., 2006), work hours or working time (Matthews et al., 2001; Schutte et al., 2015; Sekine et al., 2006), effort-reward imbalance (Stansfeld et al., 2003) or educational prospects (Virtanen et al., 2008). Thus, the available literature provides little information on the factors that are not related to the classical job strain model. Consequently, the previous studies explored mostly the factors from the job strain model and above all each study examined a limited number of factors (between 2 and 6). One major exception may be a study exploring a very large number of factors that reported a substantial contribution of all the factors related to influence and development, but also of factors related to job demands, social relationships and leadership, working hours, job insecurity, job promotion and work-life imbalance (Schutte et al., 2015). Moreover, most of the studies from the literature assessed an overall contribution of psychosocial work factors without providing the contribution of each of them, making the identification of the most important factors impossible. Finally, the studies were not always based on national representative samples of the working populations making the generalization of the results and a complete picture of these inequalities difficult.
The objectives of the study were to explore social inequalities in two mental health outcomes (depression and anxiety symptoms) using occupation as a marker of social position and to evaluate the contribution of a large set of psychosocial work factors in these inequalities
among a national representative sample of the French working population of employees. Our study also took other occupational exposures of chemical, biological, physical and biomechanical nature into account. In a previous paper, we showed that psychosocial work factors (except factors related to working time/hours) were strongly associated with both depression and anxiety symptoms in this population sample (Niedhammer, Lesuffleur, Algava & Chastang, 2015).
MATERIALS AND METHODS
Study population
The SUMER survey is a periodical cross-sectional national survey from two departments of the French ministry of labour, conducted every seven years. Its objective is to evaluate all kinds of occupational exposures among the national working population of employees, in order to define preventive strategies and research priorities in France. The SUMER survey is based on a network of voluntary occupational physicians, in charge of compulsory medical examinations of employees, who collect the data for a random sample of their employees. Each occupational physician selected 30 employees of the population of employees seen during the period of collection using a random method (one employee of 10 or 20 for example). Occupational medicine is mandatory for all employees in France; consequently, every employee has a medical examination with an occupational physician periodically. SUMER 2010, the last survey conducted in 2010, included around 50,000 employees interviewed about their physical, biological, chemical, biomechanical, organizational and psychosocial exposures by 2,400 occupational physicians. The survey included two questionnaires: a main questionnaire and a self-administered questionnaire. The occupational physicians filled in the main questionnaire mainly about physical, biological, chemical, biomechanical and organizational exposures for each employee. Employees filled in a self-administered questionnaire in which their responses were collected about psychosocial work factors and health outcomes. Ethical approval was granted by the Commission Nationale de l'Informatique et des Libertés and Conseil National de l'Information Statistique. Several articles have already been published by our team using these survey data (Lesuffleur, Chastang, Cavet & Niedhammer, 2015; Lesuffleur, Chastang, Sandret & Niedhammer, 2014; Lesuffleur, Chastang, Sandret & Niedhammer, 2015; Niedhammer et al., 2015).
Depression and anxiety symptoms were measured using the Hospital Anxiety and Depression (HAD) scale (Zigmond & Snaith, 1983) in the self-administered questionnaire. The HAD scale is a 14-item questionnaire, assessing the presence and severity of anxiety symptoms (HAD-A subscale; 7 items, Cronbach alpha=0.75) and depression symptoms (HAD-D subscale; 7 items, Cronbach alpha=0.70) separately, each subscale being scored from 0 to 21. The two scores were used as two outcomes to explore the severity of each.
Psychosocial factors at work
Psychosocial work factors were constructed using the data collected in the self-administered questionnaire.
Job strain model dimensions were constructed using the validated French version of the questionnaire (Niedhammer, 2002; Niedhammer, Chastang, Gendrey, David & Degioanni, 2006): decision latitude (9 items, Cronbach alpha=0.78, including 6 items for skill discretion and 3 items for decision authority), psychological demands (9 items, Cronbach alpha=0.80) and social support (8 items, Cronbach alpha=0.82, including 4 items for social support from colleagues and 4 items for social support from supervisors). The scores were constructed according to the recommendations by Karasek and dichotomized at the median of the total sample. Job strain was defined by the combination of high demands and low latitude, and isostrain by the combination of job strain and low support.
Reward (11 items, Cronbach alpha=0.85, including 5 items for esteem, 2 items for job security and 4 items for job promotion) from the effort-reward imbalance model was measured using the validated French version of this questionnaire (Niedhammer, Siegrist, Landre, Goldberg & LeClerc, 2000). Reward and its sub-dimensions were dichotomized at the median of the total sample.
Five working time variables were studied: long working hours (1 item, ≥48 hours/week following the European directive on working time), night work (1 item, working between 12 and 5am ≥1 night/week), shift work (1 item, either permanent or alternating/rotating shifts), unsociable work days (1 item, working on Sunday or Saturday ≥1 day/week), and predictability of schedules (4 items: information about time schedules for the next day, week, month and the next three months).
Three factors were related to workplace violence: physical violence or sexual assault (2 items), bullying (9 items) and verbal abuse (2 items). Exposure was defined by at least one situation of workplace violence for each factor.
Demands for responsibility (4 items: a mistake in work may lead to serious consequences for product/service quality, to serious financial losses for the company, to dangerous consequences for the safety of people or yourself, and to wage/work/job sanctions for yourself) was dichotomized at the median of the total sample.
Other occupational exposures
Other occupational exposures (physical, biomechanical, biological and chemical exposures) were measured by the occupational physicians using their expert evaluation and collected in the main questionnaire.
Physical exposure was defined by at least 20h of exposure to noise, thermic constraints, radiations or controlled air/space within the previous week.
Biomechanical exposure was defined by at least 20h of exposure to manual materials handling, postural/articular constraints, vibrations or driving within the previous week.
Biological exposure was defined by at least one biological exposure within the previous week. Chemical exposure was defined by at least one chemical exposure within the previous week. The questionnaires and the evaluation of all occupational exposures were built using national and European guidelines and a full description may be found elsewhere (Niedhammer, Chastang & David, 2008).
Occupation
Occupation was coded using the French national classification of occupations (PCS by INSEE) that is close to the International Standard Classification of Occupation (ISCO), and was used as a measure of social position and included, at the first level of the classification, four categories for employees: professionals/managers used as the reference category, associate professionals/technicians, clerks/service workers, and blue collar workers. Occupation was used as a marker of social position as it characterizes adult social position, is available for all workers, and may reflect occupational exposures better than education or other markers (Galobardes, Shaw, Lawlor, Lynch & Davey, 2006a; Galobardes, Shaw, Lawlor, Lynch & Davey, 2006b). In this study, we explored the inequalities, or in other words, the differences between occupational groups, called occupational inequalities or differences.
The data were weighted to provide estimates which were nationally representative of the French working population of employees (i.e. 22 millions of employees representing 92% of the total national population of employees in France, excluding the public sector of education and some ministries). The method for the calculation of weights performed by the DARES of the French ministry of labour had different objectives: to control for the potential bias related to volunteering of occupational physicians by taking into account their characteristics in comparison with the characteristics of the national population of occupational physicians, to control for the potential bias related to the differential periodicity of medical examinations (highly exposed employees have more frequent medical examinations), to control for the potential bias related to non-response to the survey, and finally to provide final weights using a calibration on margins to take the characteristics of the national French population of employees into account. These final weights were calculated using the following calibration variables: gender, age, nationality, working time (full or part time), occupation, company size, and economic activity. All analyses were performed using weighted data.
The differences between occupations for all variables were tested using Rao-Scott Chi-Square test and Student’s t-test (Taylor Series Method for Variance Estimation) to take the weights into account.
The associations between occupation and anxiety and depression symptoms were studied using weighted linear regression analysis, anxiety/depression symptoms being the dependent variable. As there was no clear association between occupation and anxiety symptoms, only depression symptoms were studied in the subsequent analyses.
The contributions of psychosocial work factors and other occupational exposures to occupational inequalities in depression symptoms were calculated for the three occupational groups: associate professionals/technicians, clerks/service workers and blue collar workers in comparison to professionals/managers. The contribution (or explained fraction) of each factor/exposure (or each set of factors/exposures) to the explanation of occupational inequalities in depression symptoms was estimated by the change in β after inclusion of the variable(s) in the model, according to the formula: (βinitial model - βextended model)/(βinitial model)
(Lynch, Kaplan, Cohen, Tuomilehto & Salonen, 1996). Positive percentage values indicated β reductions and negative percentage values indicated β increases. Confidence intervals were calculated for each contribution using the Jackknife method to provide the significance of each contribution.
Several models were performed:
- Each psychosocial work factor or occupational exposure was added separately to models 0 (extended models 0).
- All the psychosocial work factors that displayed a significant and positive contribution for at least one gender or occupational group were added simultaneously to models 0 as independent variables in models 1 and models 2.
-Similarly, all the occupational exposures that displayed a significant and positive contribution for at least one gender or occupational group were added simultaneously to models 0 as independent variables in models 3 and models 4.
Models 1 and 3 included the main dimensions of psychosocial work factors and occupational exposures and models 2 and 4 included their sub-dimensions.
Although associations between psychosocial work factors and other occupational exposures were observed, no collinearity was detected in our models.
The results for the associations between psychosocial work factors and depression symptoms were presented in a previous paper (Niedhammer et al., 2015). All psychosocial work factors (except night work, shift work and unsociable work days, as well as long working hours, physical violence and demands for responsibility when all factors were examined simultaneously) were associated with these symptoms.
The associations between the other occupational exposures and depression symptoms were derived from the models above and presented in this study.
As a large number of significant associations and interactions with gender were found, men and women were analyzed separately, and all analyses were performed using SAS.
RESULTS
Of 53,940 employees asked to participate, 46,962 employees, 26,883 men and 20,079 women, agreed to participate in the SUMER survey. The response rate was 87%. The description of the sample among men and women may be found elsewhere (Lesuffleur et al., 2015; Lesuffleur et al., 2014; Lesuffleur et al., 2015; Niedhammer et al., 2015).
Strong occupational differences were found for most work factors (Table 1). Low decision latitude and its two sub-dimensions were significantly associated with occupation (with a higher prevalence of exposure for clerks/service workers among men and blue collar workers among women). Blue collar workers were more likely to be exposed to low social support. Job strain and isostrain were more prevalent among male clerks/service workers and female blue collar workers. No association was observed between occupation and low reward among
women but among men, clerks/services workers were more likely to be exposed to low reward (including low esteem and low job promotion). Occupational differences were also found for working time factors. Blue collar workers (and clerks/service workers for men) were more likely to be exposed to night and shift work and clerks/service workers were more likely to be exposed to unsociable work days and low predictability of schedules. Among men, clerks/service workers were more likely to be exposed to workplace violence (bullying, verbal and physical violence) but among women, verbal and physical violence were more prevalent among associate professionals/technicians. Demands for responsibility were more prevalent among male blue collar workers and female associate professionals/technicians. There were two inverse occupational gradients in psychosocial work factors: professionals/managers were more likely to be exposed to high psychological demands and long working hours for both genders.
Blue collar workers were more likely to be exposed to physical, biomechanical and chemical exposures and clerks/service workers were more likely to be exposed to biological exposures. Noise, thermic constraints, manual materials handling, postural/articular constraints and vibrations displayed strong occupational gradients.
Table 2 presents the associations of occupation with anxiety and depression symptoms (after adjustment for age – models 0). Significant associations were found between occupation and depression symptoms with strong gradients.
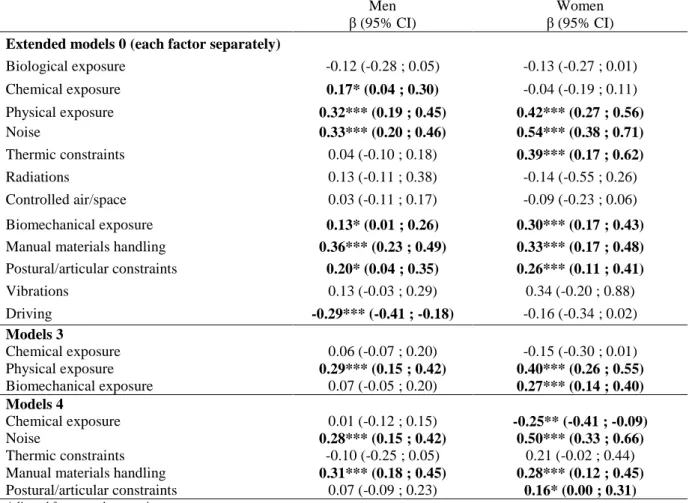
The study of the associations between the other occupational exposures and depressive symptoms showed that physical exposure, especially noise and thermic constraints (noise only in models 4), and biomechanical exposure, especially manual materials handling and postural/articular constraints, were associated with depressive symptoms (Table 3).
Tables 4 and 5 present the changes in β coefficients for each occupational group after the inclusion of work factors. First, extended models 0 included each factor separately. The inclusion of low decision latitude, and its two sub-dimensions, showed significant contributions of these factors that led to a reduction in β coefficients for the three occupational groups. The inclusion of low social support and its sub-dimensions contributed to reduce the β coefficients but not for all three groups. Job strain and isostrain contributed to reduce the β coefficients for all three groups. The inclusion of low reward, and its three sub-dimensions, led to reductions of the β coefficients especially among men. None of the working time factors contributed to reduce the association between occupation and depression symptoms except unsociable work days that contributed to reduce the β coefficient for female blue collar workers. The contribution of workplace violence factors to occupational
differences in depression symptoms differed between men and women, as these factors contributed to these differences among men only. As expected, high psychological demands and long working hours contributed negatively to the association between occupation and depression symptoms.
Models 1 included all the psychosocial work factors (main dimensions) that displayed significant positive contributions, and showed a substantial reduction of the β coefficients (more than 46% for men and more than 50% for women). Models 2 included the sub-dimensions of these factors and provided results of similar magnitude than models 1.
Among the occupational exposures, biological exposure did not contribute to reduce the association between occupation and depression symptoms and chemical exposure contributed to reduce the β coefficients among men only. Physical exposure and noise reduced the β coefficients for the three groups for men and for clerks/service workers for women. Biomechanical exposure reduced the β coefficients among blue collar workers and clerks/service workers (for women only). Manual materials handling and postural/articular constraints had significant contributions for the three occupational groups except female associated professionals/technicians.
Models 3 included the occupational exposures (main dimensions) that displayed significant contributions and models 4 included the sub-dimensions. The contributions were significant for all three groups among men (13-36%) and for blue collar workers (12-21%) and clerks/service workers (model 4 only, 19%) among women.
DISCUSSION
Main results
Low-skilled occupational groups, in particular clerks/service workers among men and blue collar workers among women, were more likely to be exposed to psychosocial work factors. Strong occupational differences were also found for the other occupational exposures. Occupational inequalities were observed for depressive symptoms but not for anxiety symptoms. The contribution of psychosocial work factors was substantial in explaining occupational inequalities in depressive symptoms. The highest contribution was found for decision latitude, particularly skill discretion. Reward, especially job promotion, and social support also contributed to explain these inequalities. Workplace violence contributed among men only. Other occupational exposures of physical and biomechanical nature were also contributing factors particularly among men.
Limitations and strengths of the study
The study used a large representative sample of the national French working population of employees, with weighted data and a good response rate, facilitating generalization of the findings. Additional analyses without taking weights into account provided similar results for the estimates but smaller confidence intervals. Our results including weights and presented here may thus be based on a conservative and cautious approach. In addition, weights are a strength of the study as the results can be extrapolated for the whole French working population of employees. Men and women were analyzed separately, which is important in occupational epidemiology (Niedhammer, Saurel-Cubizolles, Piciotti & Bonenfant, 2000). The differences observed between men and women (1) for the prevalence of exposure to work factors, (2) for the prevalence of mental symptoms, and (3) in the magnitude of occupational inequalities in exposure to work factors and in mental symptoms underlined the need and interest of performing stratified analyses on gender. Both depression and anxiety symptoms were examined, although no clear occupational inequalities were found for anxiety symptoms. Depression and anxiety symptoms were measured using the HAD scale (Zigmond & Snaith, 1983), a reliable questionnaire for the presence and severity of these symptoms. Well-established instruments were used to measure psychosocial work factors: the validated French versions of the JCQ (job strain model) and of the scale of reward (effort-reward imbalance model), facilitating comparisons with other studies. Emergent factors, understudied in the literature in this topic, such as job insecurity, workplace violence, working time/hours, and demands for responsibility were also studied. The study included other occupational exposures too, that displayed contributions to occupational inequalities in depressive symptoms. We studied the contribution of each psychosocial work factor or occupational exposure in the explanation of occupational differences in depressive symptoms. Models were also performed including all factors/exposures that displayed significant contributions. Indeed, there may be complex interrelations between work factors; some factors may be causes or consequences of other factors. Because of these interrelations, it was not possible to sum the individual contributions provided by extended models 0. Thus, models 1-4 were useful to provide the global contribution of psychosocial work factors (models 1-2) and of the other occupational exposures (models 3-4). We used sophisticated statistical analyses to include weights, and to calculate confidence intervals and the significance of the contributions, that helped to select the factors in the final models.
Several limitations deserve to be mentioned. The study had a cross-sectional design, and the conclusions about statistical associations may not be causal. A reverse causality between mental health and occupation may be possible and may be explained by a selection effect called social selection. Indeed, employees with high levels of mental symptoms might have been selected in low-skilled occupations. However, social selection has been suggested to play a small role only in explaining social inequalities in mental health (Dohrenwend, Levav, Shrout, Schwartz, Naveh, Link et al. 1992; Power et al., 2002). Occupation was the only indicator of social position available in the SUMER survey, it is thus difficult to infer that the results would be similar if another social position indicator such as education would have been used. Nevertheless, the use of occupation may have advantages for future prevention policies oriented toward the workplace. Depression and anxiety symptoms were measured using a symptom scale and not a structured diagnostic interview. Psychosocial work factors were not all measured using validated questionnaires, and some factors may have been neglected. In addition, no information was available regarding duration of exposure, something that may lead to an underestimation of the contribution of work factors in social inequalities in health (Monden, 2005).
Comparison with the literature
Occupational inequalities were found for depressive symptoms but not for anxiety symptoms in our study in the national French working population. Literature reviews and meta-analysis reported that the prevalence of common mental disorders is likely to increase with decreasing social position among the general population (Fryers et al., 2003; Fryers et al., 2005; Lorant et al., 2003; Muntaner et al., 2004). Studies suggested that the social gradient in common mental disorders may increase with the severity of the outcome (Kosidou, Dalman, Lundberg, Hallqvist, Isacsson & Magnusson, 2011) leading to potential lower social inequalities in mental health outcomes measured using symptom scales. In addition, social inequalities in depressive and anxiety disorders may be more marked among the general population than among the working population and more pronounced for depressive disorders than for anxiety disorders (Murcia et al., 2015). Our results are consequently in agreement with the literature.
Regarding the job strain model dimensions, decision latitude and its two sub-dimensions, skill discretion and decision authority, were found to have substantial contributions to occupational inequalities in depressive symptoms, confirming the results from the literature (Marmot et al., 1998; Schutte et al., 2015; Sekine et al., 2006; Stansfeld et al., 2003; Stansfeld et al., 1998;
Virtanen et al., 2008). Social support played a role in explaining these inequalities, in agreement with previous studies (Schutte et al., 2015; Sekine et al., 2006; Stansfeld et al., 2003; Stansfeld et al., 1998; Virtanen et al., 2008). Job strain and isostrain, as two combined measures, were also contributing factors, and two previous studies reported similar results for job strain (Matthews et al., 2001; Power et al., 2002). Reward had a contributing role in the explanation of occupational inequalities in depressive symptoms among men in our study. Among the dimensions of reward, job promotion played a major role for both genders, as well as low esteem and job insecurity among men. A previous study explored the contribution of effort-reward imbalance, together with the three factors from the job strain model, in social inequalities in depressive symptoms (Stansfeld et al., 2003). Some previous studies reported a contribution of job insecurity (Matthews et al., 2001; Power et al., 2002; Schutte et al., 2015; Virtanen et al., 2008) and job promotion (Schutte et al., 2015) or educational prospects (Virtanen et al., 2008). No variable related to work hours or working time was found to contribute to occupational inequalities in depressive symptoms in our study, except unsociable work days among female blue collar workers (with a very small contribution). A small number of studies explored variables related to asocial working hours (Matthews et al., 2001), shift work and work hours (Sekine et al., 2006), but only one study provided the contribution of these factors separately from other psychosocial work factors and showed the contributions of long working hours, night work, shift work, and asocial working hours (Schutte et al., 2015), which were significant among clerks/service workers. The variables of workplace violence had significant contributions to occupational inequalities in depressive symptoms among men only in our study. Workplace violence has been very rarely studied before. A previous study reported no contribution of these variables (Schutte et al., 2015). Predictability did not contribute in our study whereas it displayed significant contributions in a previous study (Schutte et al., 2015). Demands for responsibility displayed a small contribution in our study, but have never been studied before.
The overall contribution of psychosocial work factors to occupational inequalities in depressive symptoms was very substantial in our study, and was stronger than the overall contribution of the other types of occupational exposures. This result may be expected as psychosocial work factors may be more associated with mental health than the other types of occupational exposures. Nevertheless, some occupational exposures of physical and biomechanical nature were found to contribute to occupational inequalities in depressive symptoms: noise, thermic constraints, manual materials handling and postural/articular
constraints. To our knowledge, no other study has explored these types of exposures in the explanation of social inequalities in mental health in the working population before. Noise is known as an important environmental stressor, but its impact on mental health has been rarely explored in working populations. One study reported that occupational noise was associated with mental health, including depressive symptoms and suicidal ideation (Yoon, Won, Lee, Jung & Roh, 2014). In our study, we found that noise was associated with depressive symptoms and contributed to the occupational differences in this outcome.
Conclusions
Our study showed that psychosocial work factors played a major role in the explanation of occupational inequalities in depressive symptoms. Both classical and emergent factors had significant contributions to these inequalities. Among the classical factors, the job strain model dimensions of decision latitude and social support were contributing factors. Among the emergent factors, the following factors played a role in occupational inequalities in depressive symptoms: reward, job promotion, job insecurity, and various forms of workplace violence. Physical and biomechanical exposures, in particular noise, thermic constraints, manual materials handling and postural/articular constraints, were also found to be contributing factors, and may deserve more attention in the future. Comprehensive prevention policies may help to prevent psychosocial work exposures, to improve mental health at work, and consequently may also contribute to reduce social inequalities in mental health.
Acknowledgements
The authors thank the members of the DARES (French ministry of labour), all the occupational physicians and ‘médecins inspecteurs régionaux du travail’, and all the employees who participated to the SUMER survey and made this study possible.
Funding
References
Birnbaum,H.G., Kessler,R.C., Kelley,D., Ben-Hamadi,R., Joish,V.N., & Greenberg,P.E. (2010). Employer burden of mild, moderate, and severe major depressive disorder: mental health services utilization and costs, and work performance. Depress.Anxiety., 27(1), 78-89. Bonde,J.P. (2008). Psychosocial factors at work and risk of depression: a systematic review of the epidemiological evidence. Occup.Environ.Med., 65(7), 438-445.
Dohrenwend,B.P., Levav,I., Shrout,P.E., Schwartz,S., Naveh,G., Link,B.G., Skodol,A.E., & Stueve,A. (1992). Socioeconomic status and psychiatric disorders: the causation-selection issue. Science, 255(5047), 946-952.
Fryers,T., Melzer,D., & Jenkins,R. (2003). Social inequalities and the common mental disorders: a systematic review of the evidence. Soc Psychiatry Psychiatr.Epidemiol., 38(5), 229-237.
Fryers,T., Melzer,D., Jenkins,R., & Brugha,T. (2005). The distribution of the common mental disorders: social inequalities in Europe. Clin.Pract.Epidemol.Ment.Health, 1 14.
Galobardes,B., Shaw,M., Lawlor,D.A., Lynch,J.W., & Davey,S.G. (2006a). Indicators of socioeconomic position (part 1). J.Epidemiol.Community Health, 60(1), 7-12.
Galobardes,B., Shaw,M., Lawlor,D.A., Lynch,J.W., & Davey,S.G. (2006b). Indicators of socioeconomic position (part 2). J.Epidemiol.Community Health, 60(2), 95-101.
Karasek,R., Brisson,C., Kawakami,N., Houtman,I., Bongers,P., & Amick,B. (1998). The Job Content Questionnaire (JCQ): an instrument for internationally comparative assessments of psychosocial job characteristics. J.Occup.Health Psychol., 3(4), 322-355.
Kessler,R.C., Akiskal,H.S., Ames,M., Birnbaum,H., Greenberg,P., RM,A., Jin,R., Merikangas,K.R., Simon,G.E., & Wang,P.S. (2006). Prevalence and effects of mood disorders on work performance in a nationally representative sample of U.S. workers. Am.J Psychiatry,
163(9), 1561-1568.
Kosidou,K., Dalman,C., Lundberg,M., Hallqvist,J., Isacsson,G., & Magnusson,C. (2011). Socioeconomic status and risk of psychological distress and depression in the Stockholm Public Health Cohort: a population-based study. J Affect.Disord., 134(1-3), 160-167.
Kristensen,T.S., Borg,V., & Hannerz,H. (2002). Socioeconomic status and psychosocial work environment: results from a Danish national study. Scand J Public Health Suppl, 59 41-48. Laaksonen,E., Martikainen,P., Lallukka,T., Lahelma,E., Ferrie,J., Rahkonen,O., Marmot,M., & Head,J. (2009). Economic difficulties and common mental disorders among Finnish and British white-collar employees: the contribution of social and behavioural factors. J
Epidemiol.Community Health, 63(6), 439-446.
Lesuffleur,T., Chastang,J.F., Cavet,M., & Niedhammer,I. (2015). [Psychosocial work factors and self-reported health in the French national SUMER survey]. Sante Publique, 27(2), 177-186.
Lesuffleur,T., Chastang,J.F., Sandret,N., & Niedhammer,I. (2014). Psychosocial factors at work and sickness absence: Results from the French National SUMER Survey. Am.J Ind.Med,
57(6), 695-708.
Lesuffleur,T., Chastang,J.F., Sandret,N., & Niedhammer,I. (2015). Psychosocial Factors at Work and Occupational Injury: Results From the French National SUMER Survey. J Occup
Environ Med, 57(3), 262-269.
Lorant,V., Deliege,D., Eaton,W., Robert,A., Philippot,P., & Ansseau,M. (2003). Socioeconomic inequalities in depression: a meta-analysis. Am.J.Epidemiol., 157(2), 98-112. Lynch,J.W., Kaplan,G.A., Cohen,R.D., Tuomilehto,J., & Salonen,J.T. (1996). Do cardiovascular risk factors explain the relation between socioeconomic status, risk of all-cause mortality, cardiovascular mortality, and acute myocardial infarction? Am.J.Epidemiol.,
144(10), 934-942.
Marmot,M.G., Fuhrer,R., Ettner,S.L., Marks,N.F., Bumpass,L.L., & Ryff,C.D. (1998). Contribution of psychosocial factors to socioeconomic differences in health. Milbank Q.,
76(3), 403-48, 305.
Matthews,S., Power,C., & Stansfeld,S.A. (2001). Psychological distress and work and home roles: a focus on socio-economic differences in distress. Psychol.Med, 31(4), 725-736.
Monden,C.W. (2005). Current and lifetime exposure to working conditions. Do they explain educational differences in subjective health? Soc.Sci.Med., 60(11), 2465-2476.
Muntaner,C., Eaton,W.W., Miech,R., & O'Campo,P. (2004). Socioeconomic position and major mental disorders. Epidemiol.Rev., 26 53-62.
Murcia,M., Chastang,J.F., & Niedhammer,I. (2015). Educational inequalities in major depressive and generalized anxiety disorders: results from the French national SIP study.
Soc.Psychiatry Psychiatr.Epidemiol., 50(6), 919-928.
Netterstrom,B., Conrad,N., Bech,P., Fink,P., Olsen,O., Rugulies,R., & Stansfeld,S. (2008). The relation between work-related psychosocial factors and the development of depression.
Epidemiol.Rev., 30 118-132.
Niedhammer,I. (2002). Psychometric properties of the French version of the Karasek Job Content Questionnaire: a study of the scales of decision latitude, psychological demands, social support, and physical demands in the GAZEL cohort. Int Arch Occup Environ Health,
75(3), 129-144.
Niedhammer,I., Chastang,J.F., & David,S. (2008). Importance of psychosocial work factors on general health outcomes in the national French SUMER survey. Occup.Med.(Lond), 58(1), 15-24.
Niedhammer,I., Chastang,JF., Gendrey,L., David,S., & Degioanni,S. (2006). Propriétés psychométriques de la version française des échelles de la demande psychologique, de la latitude décisionnelle et du soutien social du "Job Content Questionnaire" de Karasek : résultats de l'enquête nationale SUMER. Santé Publique, 18(3), 413-427.
Niedhammer,I., Lesuffleur,T., Algava,E., & Chastang,J.F. (2015). Classic and emergent psychosocial work factors and mental health. Occup Med (Lond), 65(2), 126-134.
Niedhammer,I., Saurel-Cubizolles,M.J., Piciotti,M., & Bonenfant,S. (2000). How is sex considered in recent epidemiological publications on occupational risks? Occup Environ Med,
57(8), 521-527.
Niedhammer,I., Siegrist,J., Landre,M.F., Goldberg,M., & LeClerc,A. (2000). [Psychometric properties of the French version of the Effort-Reward Imbalance model]. Rev.Epidemiol.Sante
Publique, 48(5), 419-437.
Nieuwenhuijsen,K., Bruinvels,D., & Frings-Dresen,M. (2010). Psychosocial work environment and stress-related disorders, a systematic review. Occup Med (Lond), 60(4), 277-286.
Power,C., Stansfeld,S.A., Matthews,S., Manor,O., & Hope,S. (2002). Childhood and adulthood risk factors for socio-economic differentials in psychological distress: evidence from the 1958 British birth cohort. Soc Sci Med, 55(11), 1989-2004.
Schutte,S., Chastang,J.F., Parent-Thirion,A., Vermeylen,G., & Niedhammer,I. (2015). Psychosocial work exposures among European employees: explanations for occupational inequalities in mental health. J Public Health (Oxf), 37(3), 373-388.
Sekine,M., Chandola,T., Martikainen,P., Marmot,M., & Kagamimori,S. (2006).
Socioeconomic inequalities in physical and mental functioning of Japanese civil servants: explanations from work and family characteristics. Soc Sci.Med, 63(2), 430-445.
Siegrist,J. (2008). Chronic psychosocial stress at work and risk of depression: evidence from prospective studies. Eur.Arch.Psychiatry Clin.Neurosci., 258 Suppl 5 115-119.
Siegrist,J., Starke,D., Chandola,T., Godin,I., Marmot,M., Niedhammer,I., & Peter,R. (2004). The measurement of effort-reward imbalance at work: European comparisons. Soc.Sci.Med.,
58(8), 1483-1499.
Stansfeld,S., & Candy,B. (2006). Psychosocial work environment and mental health--a meta-analytic review. Scand.J Work Environ.Health, 32(6), 443-462.
Stansfeld,S.A., Head,J., Fuhrer,R., Wardle,J., & Cattell,V. (2003). Social inequalities in depressive symptoms and physical functioning in the Whitehall II study: exploring a common cause explanation. J.Epidemiol.Community Health, 57(5), 361-367.
Stansfeld,S.A., Head,J., & Marmot,M.G. (1998). Explaining social class differences in depression and well-being. Soc.Psychiatry Psychiatr.Epidemiol., 33(1), 1-9.
Theorell,T., Hammarstrom,A., Aronsson,G., Traskman,B.L., Grape,T., Hogstedt,C., Marteinsdottir,I., Skoog,I., & Hall,C. (2015). A systematic review including meta-analysis of work environment and depressive symptoms. BMC.Public Health, 15 738.
Virtanen,M., Koskinen,S., Kivimaki,M., Honkonen,T., Vahtera,J., Ahola,K., & Lonnqvist,J. (2008). Contribution of non-work and work-related risk factors to the association between income and mental disorders in a working population: the Health 2000 Study.
Yoon,J.H., Won,J.U., Lee,W., Jung,P.K., & Roh,J. (2014). Occupational noise annoyance linked to depressive symptoms and suicidal ideation: a result from nationwide survey of Korea. PLoS.One., 9(8), e105321.
Zigmond,A.S., & Snaith,R.P. (1983). The hospital anxiety and depression scale. Acta
Table 1. Prevalence of exposure to psychosocial work factors and other occupational exposures and mean scores for anxiety and depression symptoms according to occupational groups
Men % Professionals, managers N (%) Associate professionals, technicians N (%) Clerks, service workers N (%) Blue collar workers N (%) p- value 5082 (17.3) 6408 (22.0) 3574 (17.3) 11819 (43.4)
Low decision latitude 20.25 37.96 62.10 56.79 ***
Low skill discretion 21.92 38.10 63.62 55.74 ***
Low decision authority 41.16 54.68 70.02 68.96 ***
High psychological demands 65.55 50.53 37.74 36.66 ***
Low social support 38.62 40.66 43.44 44.20 ***
Low social support (from supervisors) 40.54 40.08 42.65 44.10 ** Low social support (from colleagues) 64.83 66.20 65.81 66.25 NS
Jobstrain 13.63 19.91 24.83 22.04 ***
Isostrain 9.08 13.20 16.51 14.55 ***
Low reward 44.91 51.39 53.37 48.81 ***
Low esteem 42.83 46.91 50.06 45.97 ***
Job insecurity 36.55 42.72 42.13 42.04 ***
Low job promotion 36.20 43.22 47.39 40.58 ***
Long working hours 25.21 8.96 5.10 4.15 ***
Night work 1.21 3.42 8.81 8.03 ***
Shift work 3.49 11.96 23.66 22.96 ***
Unsociable work days 13.48 14.72 32.11 17.77 ***
Low predictability 31.27 31.37 36.38 33.34 **
Physical violence 0.81 1.39 5.57 1.27 ***
Bullying 19.79 22.64 25.11 21.70 **
Verbal abuse 16.06 22.86 34.54 14.42 ***
Demands for responsibility 49.24 52.33 44.96 61.36 ***
Biological exposure 6.74 14.22 28.74 15.24 *** Chemical exposure 6.87 24.93 26.52 60.61 *** Physical exposure 21.11 41.65 45.42 78.28 *** Noise 14.84 31.43 29.88 65.39 *** Thermic constraints 6.12 19.74 30.19 44.51 *** Radiations 3.14 5.04 2.09 5.75 *** Controlled air/space 30.31 19.73 18.50 10.05 *** Biomechanical exposure 27.13 36.37 44.72 74.01 ***
Manual materials handling 7.97 29.08 36.67 68.62 *** Postural/articular constraints 49.61 63.12 76.99 90.34 ***
Vibrations 1.26 8.06 7.95 39.63 ***
Driving 37.61 46.18 35.64 56.74 ***
Mean (SE) Mean (SE) Mean (SE) Mean (SE)
Anxiety symptoms 7.07 (0.07) 7.11 (0.06) 6.72 (0.10) 7.04 (0.05) ** Depression symptoms 3.92 (0.06) 4.18 (0.05) 4.54 (0.08) 4.71 (0.05) ***
Women % Professionals, managers N (%) Associate professionals, technicians N (%) Clerks, service workers N (%) Blue collar workers N (%) p-value 2811 (11.53) 5666 (24.95) 9311 (52.97) 2291 (10.54)
Low decision latitude 24.64 45.99 66.89 79.33 ***
Low skill discretion 27.32 47.06 68.69 78.32 ***
Low decision authority 42.38 62.75 74.12 80.27 ***
High psychological demands 65.68 50.44 41.48 36.58 ***
Low social support 37.61 39.92 39.97 49.44 ***
Low social support (from supervisors) 38.82 41.87 39.25 46.39 *** Low social support (from colleagues) 61.57 63.65 63.37 70.64 ***
Jobstrain 16.67 24.73 28.67 30.04 ***
Isostrain 10.60 15.57 17.67 21.67 ***
Low reward 46.64 51.08 49.12 50.36 NS
Low esteem 43.20 45.21 42.88 44.76 NS
Job insecurity 39.52 41.55 40.94 42.99 NS
Low job promotion 35.92 44.58 42.51 43.46 ***
Long working hours 11.83 2.52 1.56 1.69 ***
Night work 0.65 2.09 2.32 3.50 ***
Shift work 3.12 14.74 14.82 27.63 ***
Unsociable work days 8.30 15.91 19.24 18.96 ***
Low predictability 24.38 28.52 33.60 30.37 ***
Physical violence 0.74 3.57 1.73 0.88 ***
Bullying 22.72 22.07 22.47 23.68 NS
Verbal abuse 25.74 31.03 26.24 13.26 ***
Demands for responsibility 35.09 38.13 29.16 32.29 ***
Biological exposure 12.09 30.60 34.52 25.66 *** Chemical exposure 5.63 20.08 31.31 51.97 *** Physical exposure 16.61 23.19 25.58 48.60 *** Noise 10.84 17.65 19.98 36.96 *** Thermic constraints 4.72 4.73 7.78 22.19 *** Radiations 1.39 3.21 1.15 1.34 *** Controlled air/space 28.68 21.35 15.96 14.41 *** Biomechanical exposure 27.14 32.62 42.63 51.82 ***
Manual materials handling 5.80 22.62 32.80 47.43 *** Postural/articular constraints 55.34 64.30 78.57 92.67 ***
Vibrations 0.43 0.57 1.34 7.99 ***
Driving 20.06 19.74 11.88 15.22 ***
Mean (SE) Mean (SE) Mean (SE) Mean (SE)
Anxiety symptoms 8.02 (0.10) 7.83 (0.09) 8.08 (0.06) 8.35 (0.12) ** Depression symptoms 3.85 (0.08) 3.99 (0.07) 4.27 (0.05) 4.97 (0.10) **
N: unweighted sample size %: weighted %
SE: standard error
Table 2. Associations between occupation and anxiety and depression symptoms: results from weighted linear regression analysis (models 0)
Associate professionals, technicians β (95% CI) Clerks, service workers β (95% CI)
Blue collar workers
β (95% CI) p-value Men (N = 26696) Anxiety symptoms 0.08 (-0.10 ; 0.26) -0.26* (-0.50 ; -0.03) 0.07 (-0.09 ; 0.24) * Depression symptoms 0.31*** (0.15 ; 0.48) 0.72*** (0.51 ; 0.92) 0.90*** (0.75 ; 1.05) *** Women (N = 19938) Anxiety symptoms -0.15 (-0.41 ; 0.11) 0.10 (-0.13 ; 0.33) 0.32* (0.01 ; 0.63) ** Depression symptoms 0.21* (0.01 ; 0.41) 0.51*** (0.33 ; 0.69) 1.13*** (0.88 ; 1.38) ***
Professionals/managers: reference category Adjusted for age
Bold β: significant at 5%
p-value: statistical significance for the difference between occupational groups *p<0.05, **p<0.01, ***p<0.001
Table 3. Associations between other occupational exposures and depression symptoms: results from weighted linear regression analysis
Men Women
β (95% CI) β (95% CI)
Extended models 0 (each factor separately)
Biological exposure -0.12 (-0.28 ; 0.05) -0.13 (-0.27 ; 0.01) Chemical exposure 0.17* (0.04 ; 0.30) -0.04 (-0.19 ; 0.11) Physical exposure 0.32*** (0.19 ; 0.45) 0.42*** (0.27 ; 0.56) Noise 0.33*** (0.20 ; 0.46) 0.54*** (0.38 ; 0.71) Thermic constraints 0.04 (-0.10 ; 0.18) 0.39*** (0.17 ; 0.62) Radiations 0.13 (-0.11 ; 0.38) -0.14 (-0.55 ; 0.26) Controlled air/space 0.03 (-0.11 ; 0.17) -0.09 (-0.23 ; 0.06) Biomechanical exposure 0.13* (0.01 ; 0.26) 0.30*** (0.17 ; 0.43)
Manual materials handling 0.36*** (0.23 ; 0.49) 0.33*** (0.17 ; 0.48)
Postural/articular constraints 0.20* (0.04 ; 0.35) 0.26*** (0.11 ; 0.41) Vibrations 0.13 (-0.03 ; 0.29) 0.34 (-0.20 ; 0.88) Driving -0.29*** (-0.41 ; -0.18) -0.16 (-0.34 ; 0.02) Models 3 Chemical exposure 0.06 (-0.07 ; 0.20) -0.15 (-0.30 ; 0.01) Physical exposure 0.29*** (0.15 ; 0.42) 0.40*** (0.26 ; 0.55) Biomechanical exposure 0.07 (-0.05 ; 0.20) 0.27*** (0.14 ; 0.40) Models 4 Chemical exposure 0.01 (-0.12 ; 0.15) -0.25** (-0.41 ; -0.09) Noise 0.28*** (0.15 ; 0.42) 0.50*** (0.33 ; 0.66) Thermic constraints -0.10 (-0.25 ; 0.05) 0.21 (-0.02 ; 0.44) Manual materials handling 0.31*** (0.18 ; 0.45) 0.28*** (0.12 ; 0.45)
Postural/articular constraints 0.07 (-0.09 ; 0.23) 0.16* (0.00 ; 0.31)
Adjusted for age and occupation Bold β: significant at 5% *p<0.05, **p<0.01, ***p<0.001
Table 4. β coefficient and contribution (%) of work factors to occupational inequalities in depression symptoms: results from weighted linear regression analysis among men
Men Associate professionals,
technicians
Clerks, service
workers Blue collar workers
β % β % β %
Extended models 0 (each factor separately)
Low decision latitude 0.09 70.65*** 0.20 72.65*** 0.46*** 49.56***
Low skill discretion 0.15 52.32*** 0.29** 59.53*** 0.56*** 37.79***
Low decision authority 0.17* 46.98*** 0.41*** 43.30*** 0.61*** 32.18***
High psychological demands 0.54*** -73.08** 1.12*** -56.42*** 1.34*** -48.25***
Low social support 0.25** 21.02* 0.60*** 16.16** 0.75*** 17.24***
Low social support (from supervisors) 0.31*** -0.75 0.65*** 9.30* 0.82*** 9.40**
Low social support (from colleagues) 0.27** 13.08* 0.70*** 1.84 0.86*** 5.33*
Jobstrain 0.19* 38.10*** 0.49*** 31.53*** 0.75*** 17.16***
Isostrain 0.20* 35.40** 0.54*** 25.09*** 0.75*** 16.82***
Low reward 0.16* 48.46*** 0.50*** 30.53*** 0.79*** 12.79***
Low esteem 0.21** 33.70** 0.52*** 26.97*** 0.81*** 10.61***
Job insecurity 0.19* 40.09*** 0.57*** 20.84*** 0.78*** 13.23***
Low job promotion 0.17* 45.51*** 0.49*** 31.83*** 0.80*** 11.89***
Long working hours 0.33*** -6.90 0.74*** -3.29 0.93*** -2.43 Night work 0.30*** 3.73 0.71*** 1.33 0.90*** 0.02 Shift work 0.31*** 2.29 0.69*** 4.23 0.87*** 3.70 Unsociable work days 0.32*** -1.77 0.73*** -1.22 0.91*** -0.54 Low predictability 0.30*** 2.48 0.70*** 2.07 0.89*** 1.28 Physical violence 0.30*** 5.03 0.62*** 14.00** 0.88*** 3.03**
Bullying 0.25** 18.67* 0.61*** 15.32*** 0.86*** 4.91*
Verbal abuse 0.22** 28.87*** 0.46*** 35.13*** 0.91*** -0.97 Demands for responsibility 0.30*** 3.33 0.73*** -1.75 0.86*** 4.46***
Model 1 0.01 96.82*** 0.13 82.00*** 0.49*** 45.73***
Model 2 0.00 100.5*** 0.11 85.14*** 0.48*** 46.54***
Extended models 0 (each factor separately)
Biological exposure 0.32*** -2.82 0.74*** -3.63 0.91*** -1.10 Chemical exposure 0.28*** 9.49* 0.68*** 4.44* 0.81*** 9.89* Physical exposure 0.25** 20.68** 0.64*** 10.55*** 0.72*** 19.97*** Noise 0.26** 17.17** 0.67*** 6.61*** 0.74*** 18.23*** Thermic constraints 0.31*** 1.63 0.71*** 1.26 0.89*** 1.59 Radiations 0.31*** 0.79 0.72*** -0.23 0.90*** 0.37 Controlled air/space 0.32*** -1.07 0.72*** -0.53 0.91*** -0.71 Biomechanical exposure 0.30*** 3.82 0.69*** 3.16 0.84*** 6.83*
Manual materials handling 0.24** 23.77** 0.62*** 13.97*** 0.69*** 23.83***
Postural/articular constraints 0.29*** 8.24* 0.66*** 7.31* 0.82*** 8.70*
Vibrations 0.30*** 2.62 0.71*** 1.03 0.85*** 5.47 Driving 0.34*** -8.62** 0.71*** 0.34 0.96*** -6.65***
Model 3 0.24** 24.24** 0.62*** 12.89*** 0.67*** 25.43***
Model 4 0.20* 34.74** 0.59*** 17.46** 0.58*** 36.01***
Adjusted for age. Bold β and contribution: significant at 5%. Professionals/managers: reference category
Model 1: decision latitude + social support + reward + unsociable work days + physical violence + bullying + verbal violence + demands for responsability Model 2: skill discretion + decision authority + social support from supervisor + social support from colleagues + esteem + job insecurity + job promotion + unsociable work days + physical violence + bullying + verbal violence + demands for responsability
Model 3: chemical + physical + biomechanical exposure
Table 5. β coefficient and contribution (%) of work factors to occupational inequalities in depression symptoms: results from weighted linear regression analysis among women
Women
Associate professionals,
technicians
Clerks, service
workers Blue collar workers
β % β % β %
Extended models 0 (each factor separately)
Low decision latitude -0.06 128.83* -0.05 109.01*** 0.41** 63.33***
Low skill discretion -0.01 103.44* 0.04 91.18*** 0.55*** 50.90***
Low decision authority 0.00 98.75* 0.17 65.82*** 0.74*** 34.87***
High psychological demands 0.44*** -108.86 0.87*** -70.16*** 1.57*** -38.47***
Low social support 0.11 45.62 0.40*** 22.02** 0.88*** 21.84***
Low social support (from supervisors) 0.12 40.70 0.47*** 7.97 0.98*** 13.30***
Low social support (from colleagues) 0.16 24.16 0.44*** 13.48** 1.03*** 8.97**
Jobstrain 0.06 70.82* 0.27** 46.13*** 0.86*** 23.53***
Isostrain 0.06 73.09* 0.29** 43.96*** 0.84*** 25.95***
Low reward 0.12 41.49 0.45*** 12.27 1.06*** 6.57
Low esteem 0.16 24.21 0.50*** 1.42 1.09*** 3.98
Job insecurity 0.17 17.06 0.47*** 7.63 1.04*** 7.82*
Low job promotion 0.07 68.63* 0.39*** 22.85** 0.99*** 12.73**
Long working hours 0.25* -16.91 0.53*** -4.87 1.15*** -2.03
Night work 0.20 3.12 0.50*** 1.57 1.12*** 0.52
Shift work 0.21* -1.10 0.50*** 1.90 1.10*** 2.45 Unsociable work days 0.21* 0.35 0.50*** 2.91 1.11*** 1.72*
Low predictability 0.22* -4.85 0.50*** 1.83 1.12*** 1.25 Physical violence 0.22* -4.16 0.51*** -0.09 1.13*** -0.12
Bullying 0.22* -5.56 0.51*** -0.35 1.10*** 2.78
Verbal abuse 0.15 28.87 0.49*** 3.51 1.26*** -11.30***
Demands for responsibility 0.20 3.72 0.53*** -3.61* 1.14*** -0.43 Model 1 -0.04 120.60* 0.09 81.95*** 0.56*** 50.19***
Model 2 -0.08 139.67* 0.08 85.00*** 0.55*** 51.17***
Extended models 0 (each factor separately)
Biological exposure 0.23* -11.03 0.54*** -5.46 1.15*** -1.43 Chemical exposure 0.22* -2.80 0.52*** -2.04 1.15*** -1.65 Physical exposure 0.18 12.27 0.47*** 6.96** 1.00*** 11.91*** Noise 0.17 17.13 0.46*** 9.57*** 0.99*** 12.81*** Thermic constraints 0.21* -0.67 0.50*** 1.98 1.06*** 6.05** Radiations 0.21* -1.20 0.51*** 0.08 1.13*** 0.00 Controlled air/space 0.20 3.18 0.50*** 2.22 1.12*** 1.09 Biomechanical exposure 0.20 7.05 0.47*** 8.67** 1.06*** 6.50***
Manual materials handling 0.16 25.35 0.42*** 16.85*** 1.00*** 11.89***
Postural/articular constraints 0.19 10.29 0.45*** 11.44** 1.04*** 8.44**
Vibrations 0.21* 0.20 0.51*** 0.59 1.10*** 2.32
Driving 0.21* 0.14 0.50*** 2.50 1.12*** 0.63
Model 3 0.19 8.37 0.47*** 7.39 1.00*** 11.64**
Model 4 0.15 26.80 0.41*** 19.23** 0.90*** 20.56***
Adjusted for age. Bold β and contribution: significant at 5%. Professionals/managers: reference category
Model 1: decision latitude + social support + reward + unsociable work days + physical violence + bullying + verbal violence + demands for responsability Model 2: skill discretion + decision authority + social support from supervisor + social support from colleagues + esteem + job insecurity + job promotion + unsociable work days + physical violence + bullying + verbal violence + demands for responsability
Model 3: chemical + physical + biomechanical exposure