HAL Id: hal-02895370
https://hal.archives-ouvertes.fr/hal-02895370
Submitted on 12 Feb 2021
HAL is a multi-disciplinary open access
archive for the deposit and dissemination of
sci-entific research documents, whether they are
pub-lished or not. The documents may come from
teaching and research institutions in France or
abroad, or from public or private research centers.
L’archive ouverte pluridisciplinaire HAL, est
destinée au dépôt et à la diffusion de documents
scientifiques de niveau recherche, publiés ou non,
émanant des établissements d’enseignement et de
recherche français ou étrangers, des laboratoires
publics ou privés.
Tool kit helps digitize tide gauge records
Albin Ullmann, Frédéric Pons, Vincent Moron
To cite this version:
Albin Ullmann, Frédéric Pons, Vincent Moron. Tool kit helps digitize tide gauge records. Eos,
Trans-actions American Geophysical Union, American Geophysical Union (AGU), 2005, 86 (38), pp.342.
�10.1029/2005EO380004�. �hal-02895370�
Eos, Vol. 86, No. 38, 2 0 September 2005
SECTION NEWS
Tool Kit Helps Digitize Tide Gauge Records
PAGE 342The Numerisation des Niveaux d'Eau (NUNIEAU) is an integrated and automated MATLAB computer program tool kit for digitiz ing, transforming, and validating paper records of sea level variations, called marigrams (Fig ure la), that can cut in half the time required to digitize paper records.
This tool kit developed in 2004 by F Pons is currently obtainable by request from the developer, but will be available online on the IMPLIT (Impact des evenements extremes sur les hydro-systemes du litoral mediterranean francais) Web site in early 2006.
Marigrams obtained from mechanical tide gauges provide the longest continuous record of sea level variations (the longest sea level record along the French Mediterranean coast— the marigram of Marseille—begins in 1885). With measurements of sea level obtained by satellite observation and from automated tide gauges only available from the 1990s onward, it is imperative to preserve information con tained in the paper records. Already several marigrams have been lost.
The process of manually digitizing the mari grams is also a tedious task; about 25 hours of manual work are necessary to convert a year's worth of marigrams into a numerical time series of sea level height at hourly timescales using a digital pen. Eventual corrections of the numerical time series considerably lengthen this work.The same task using NUNIEAU, with an off-the-shelf personal computer (3-GHz CPU, 1 Gb RAM), is reduced to approximately 12 hours, including corrections of time and height shifts between consecutive weeks.
NUNIEAU has been used to produce validated, near-continuous, densely sampled time series for three measurement stations
(Grau de la Dent,Port-Ven-dres,and Sete harbor) of the SMNLR (Maritime and Navi gation Service of Langued-oc-Rousillon) for the French Mediterranean coast, which allows for the analysis of sea level variations from July 1979 to December 1999 at hourly timescales.
NUNIEAU is currently being used on other marigrams of the French Mediterranean coast (including Port de Bouc from 1960 to 2000),and it has also successfully been used to convert river level paper records (i.e., a limnigraph of the Herault River for the year 1996) into numerical time series.
Converting Paper Records
Paper record marigrams obtained from me chanical tide gauges are first scanned in color
Pig. 1. (a) An example of a mechanical tide gauge paper record or marigram for 23-29 July 1982 at station Grau de la Dent in the Rhone delta. The bold annotations are used as part of the processing to produce a numerical time series, (b) From the original marigram scan, NUNIEAU is used to extract a cleaned subset of the image that is then digitized and transformed into a numerical time series of sea level height. The axes scales represent the scanned pixel number.
at a resolution of 200 dots per inch.
NUNIEAU automatically analyzes each scanned marigram (Figure la) image to produce a nu
merical time series
O C E A N
of sea level heightSCIE1S
(Figure lb). For each scanned image, it is neces sary to define the following as input parameters for NUNIEAU: the time and date ranges of the marigram, its horizontal and vertical scales, the color-coding of the paper record, the zero level (i.e., the reference level noticed by the technician according to the French geographic measurement system), and the desired time sampling increment. Scan im age pixels are converted into a binary matrix format (1 for valid pixels, 0 for all others), which is then transformed into a numerical time series according to the NUNIEAU input parameters.The resultant numerical time series returns sea level height at the specified time sampling
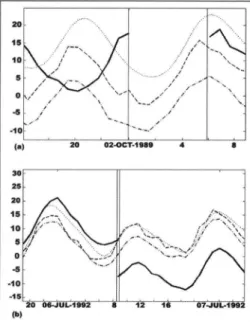
Fig. 2. (a) An example of temporal shift between consecutive marigrams on 2 October 1989. Vertical axis is centimeters above Nivelle-ment General de la France (NGF) level, (b) An example of height shift between consecutive marigrams on 6 July 1992. The vertical axis is centimeters above NGF level (bold curve, sea level variation at Grau de la Dent; dash-dotted curve, sea level variation at Port-Vendres; dashed curve, sea level variation at Sete; dotted curve, astronomical tide computed at Grau de la Dent).
interval, and includes maximum, minimum, and mean values. Numerical time series for consecutive marigrams are then concatenated to produce a continuous record. A control file containing scan parameters and other relevant information is automatically created by NUNIEAU. Before use in scientific analyses, these newly derived numerical time series of sea level height must first be corrected and validated.
The most common errors in the derivation of numerical time series of sea level from mari grams are time (Figure 2a) and height (Figure 2b) differences between the end of one mari gram and the beginning of the next. In general, temporal shifts between two consecutive weeks are related to an incorrect setting of the tide gauge clock and/or a positioning difference of the new paper roll. Height differences are commonly due to an incorrectly defined zero reference level.
The correction of time/height shifts is the most important step in validating the sea level height numerical time series. NUNIEAU allows on-screen checking of the sea level variations at hourly or shorter, timescales for a given sta tion and their direct comparisons with the computed astronomical tide.The multiplicity of stations along the French Mediterranean coast has allowed for the correcting and vali dating of the derived numerical time series for three stations.
Acknowledgments
Eos, Vol. 86, No. 38, 20 September 2005
funding from SMNLR (Maritime and Navigation Service of Languedoc-Roussillon, French Ministry of Transport and Public Works) and the French National Hydro-Meteorological Center (SCHAPI,the French Water Directorate, Ministry of Ecology and Sustainable Develop ment). It has been presented for the DISCO-BOLE (Donnees Pour le Dimensionnement des Structures Coheres et des Ouvrages de Bord de Mer a Longue Echeance) project financed by the French Ministry of Transport (METTATLM) and the French Ministry of Ecol ogy and Sustainable Development (MEDD).
A.Ullman was also funded by an IMPLIT (Impact des Evenements Extremes sur les Hydro-Sys-temes du Littoral Mediterranean Frangais) con tract GICC-2 (Gestion et Impacts du Change-ment Climatique), Ministry of Ecology and Sustainable Development. We thank Andrew Goodwillie (Columbia University) for his com ments and suggestions.
—ALBIN ULLMANN, UFR des S c i e n c e s Geographi-q u e et d e 1 A m e n a g e m e n t , Universite dAix-Marseille I, a n d C E R E G E - U M R 6 6 3 5 , Aix-en-Provence, F r a n c e ; FREDERIC PONS, Centre d'Etudes T e c h n i q u e d e
l'Equipement, C e d e x 3 Aix-en-Provence, France; a n d VINCENT MORON, UFR d e s S c i e n c e s G e o g r a p h i q u e et d e rA m e n a g e m e n t , Universite dAix-Marseille I, a n d CEREGE-UMR 6635, Aix-en-Provence, F r a n c e ( n o w at the International R e s e a r c h Institute for Climate Prediction, Palisades, N.Y)
For additional information, c o n t a c t A. Ullmann; E-mail: [email protected].
2006 Ocean Sciences Meeting Travel Grant Opportunities
PAGE 342Travel support for students participating in the 2006 Ocean Sciences Meeting (20-24 February, Honolulu, Hawaii) is being offered through two programs.The 2006 Ocean Sci ences Meeting is jointly sponsored by AGU, the American Society of Limnology and Oceanography (ASL0),and The Oceanogra phy Society (TOS).
Student Travel Grant Program: Students
presenting first-author papers at the Ocean Sciences Meeting are eligible to apply for par tial travel support through the Student Travel Grant program. Support for this program has been made available by a grant from the U.S. National Oceanographic Partnership Program (www.nopp.org),with additional contributions from AGU andASLO.
Grant recipients will be selected using sev eral criteria, including degree level,availability of additional travel support, evidence of need,
and advisor/supervisor comments. Disciplin ary breadth and the variety of geographic/in stitutional locations of the recipients will be taken into consideration. Grants will range between $400 and $750.The final award will be determined on the basis of geographic proximity to the meeting.
Applications are due by 20 October 2005. Applicants must be a student member of AGU,ASL0 or TOS. Previous recipients of AGU Student Travel Grants are not eligible to apply. Complete eligibility requirements and the online application form are available at www.agu.org/meetings/os06/.
ASLO Minorities Program:
Underrepre-sented minority students (undergraduate and graduate) who are interested in the marine and aquatic sciences are eligible to apply for full travel support (transportation, housing, food, and registration) to attend the Ocean Sciences Meeting.The ASLO Minorities Program also in
cludes several special activities for participating students: a one-day pre-conference workshop (19 February),field trips,a dedicated student research symposium, partnering with meeting mentors, and a keynote address from a leading aquatic scientist. Students will also receive a free membership in ASLO, including a subscrip tion to the journal Limnology and Oceanogra
phy.
The ASLO Minorities Program is a collabora tion between Hampton University Virginia, and ASLO, with sponsorship from the U.S. National Science Foundation. Over 520 students have participated in this program since 1990. Appli cations for the 2006 Ocean Sciences Meeting program are due 3 October 2005. Complete in formation and application forms are available at: http://www.hamptonu.edu/science/ASLO. htm.
For more information, contact Ben Cuker, Marine Science Department, Hampton Uni versity, Hampton,VA 23668;Tel: +1-757-727-5884; E-mail: [email protected].
= 9 3 Sumatra Earthquake
FORUM
COMMENT & REPLY
Comment on "Could the M
tTrigger a Geomagnetic Jerk?"
PAGE 343
In a recent issue of Eos,Florindo et al. [2005] suggest that large seismic events, such as the magnitude 9.3 Sumatra earthquake of 26 December 2004, may cause changes in topography at the core-mantle boundary (CMB), thereby affecting flow in the core. They hypothesize that this effect may trigger a geomagnetic jerk, which would be observed at Earth s surface after a time delay to allow for the signal to propagate through the weakly conducting mantle. However, they do not pro vide any estimates of the amplitude or form of the CMB topography changes that are re quired, or of the actual CMB deformation that may have occurred as a result of the Sumatra event.
Here, I argue that it is unlikely that large earthquakes can lead to geomagnetic jerks.
Geomagnetic jerks are rapid (~1 year)
changes in the slope of the first time deriva tive of the geomagnetic field recorded at the surface.They are of internal origin [Malin and
Hodder, 1982] and are observed on a global
scale [Alexandrescu et al, 1996] .They also correlate with times at which inflections in the time derivative of the length of day (LOD) are observed [Holme and De Viron, 2005]. Thus, if geomagnetic jerks originate in the core, they must be related to a global change in flow near the surface of the core, and this global flow must participate in the angular momentum balance between the core and the mantle.
Torsional oscillations, which are oscillations of rigid coaxial cylindrical surfaces inside the core, meet both of these criteria. Moreover, they have been shown to be consistent with geomagnetic jerks [Bloxham et al., 2002], with variations in flow amplitude of the order of 1 km/yr.We note that global flows other than tor
sional oscillations could conceivably produce geomagnetic jerks, but the required CMB to pography change should be of the same order as the value given below and so the general result presented here remains valid.
In order to instigate a change in torsional os cillations, the deformation of the CMB must be axisymmetric and symmetric about the equa tor. The amplitude of the required deformation is modest: Inside the core, a torsional oscilla tion flow of 1 km/yr results from a distortion of the elliptical surfaces of constant density of 0.2 mm [Dumberry and Bloxham, 2004]. Hence, if large earthquakes can generate such a change in CMB ellipticity they can induce significant changes in core flow and produce a geomagnetic jerk.
Considering the relatively large displace ments that took place in the Sumatra earth quake (as high as 20 m in some places),this hypothesis seems plausible. However, the north-south orientation of the fault plane im plies that the largest gradients in vertical deformations were east-west, incompatible with the axisymmetric CMB deformations required for torsional oscillations. In addition, despite the huge fault rupture zone of 1200 km, most of this deformation occurred locally.
To give an idea of the much smaller global CMB topography change that has occurred, consider the change in ellipticity.The displace ment in an earthquake produces a change