0099-2240/11/$12.00 doi:10.1128/AEM.06106-11
Copyright © 2011, American Society for Microbiology. All Rights Reserved.
Quantitative PCR Enumeration of Total/Toxic Planktothrix rubescens
and Total Cyanobacteria in Preserved DNA Isolated
from Lake Sediments
䌤
†
Olga Savichtcheva,
1Didier Debroas,
2Rainer Kurmayer,
3Clement Villar,
1Jean Philippe Jenny,
4Fabien Arnaud,
4Marie Elodie Perga,
1and Isabelle Domaizon
1*
INRA-UMR 42 CARRTEL, Centre Alpin de Recherche sur les Re´seaux Trophiques des Ecosyste`mes Limniques,
74203 Thonon-les-Bains Cedex, France1; Universite´ Blaise Pascal Clermont, UMR CNRS 6023,
Laboratoire Microorganismes: Ge´nome & Environnement, 24 Av. des Landais, BP 80026,
63171 Aubie`re Cedex, France2; Institute for Limnology, Austrian Academy of Sciences,
Mondseestrasse 9, A-5310 Mondsee, Austria3; and CNRS Universite´ de Savoie,
UMR 5204, EDYTEM, 73379 Le Bourget du Lac, France4
Received 29 July 2011/Accepted 29 September 2011
The variability of spatial distribution and the determinism of cyanobacterial blooms, as well as their impact at the lake scale, are still not understood, partly due to the lack of long-term climatic and environmental monitoring data. The paucity of these data can be alleviated by the use of proxy data from high-resolution sampling of sediments. Coupling paleolimnological and molecular tools and using biomarkers such as pre-served DNA are promising approaches, although they have not been performed often enough so far. In our study, a quantitative PCR (qPCR) technique was applied to enumerate total cyanobacterial and total and toxic Planktothrix communities in preserved DNA derived from sediments of three lakes located in the French Alps (Lake Geneva, Lake Bourget, and Lake Annecy), containing a wide range of cyanobacterial species. Preserved DNA from lake sediments was analyzed to assess its quality, quantity, and integrity, with further application for qPCR. We applied the qPCR assay to enumerate the total cyanobacterial community, and multiplex qPCR assays were applied to quantify total and microcystin-producing Planktothrix populations in a single reaction tube. These methods were optimized, calibrated, and applied to sediment samples, and the specificity and reproducibility of qPCR enumeration were tested. Accurate estimation of potential inhibition within sediment samples was performed to assess the sensitivity of such enumeration by qPCR. Some precautions needed for interpreting qPCR results in the context of paleolimnological approaches are discussed. We concluded that the qPCR assay can be used successfully for the analysis of lake sediments when DNA is well preserved in order to assess the presence and dominance of cyanobacterial and Planktothrix communities.
Eutrophication of freshwater ecosystems is accompanied by changes in diversity and abundance of the phytoplankton, lead-ing to a decrease in planktonic diversity and, usually, a domi-nance of cyanobacteria (14, 15). Proliferation of toxic cyano-bacteria in aquatic ecosystems has been associated with major ecological disturbances, such as a decrease in aquatic biodiver-sity, with potential consequences for the entire food web. The toxic potential of several genera of planktonic freshwater cya-nobacteria producing microcystins (MCs), the most prevalent cyanobacterial hepatotoxins in freshwaters, may also represent a considerable health risk for both wild and domestic animals as well as for human beings (7). Toxic cyanobacteria can even occur in less eutrophic systems, such as deep mesotrophic lakes in the Alps (7, 29). In the latter case, Planktothrix rubescens is currently the dominant species reported for the following Eu-ropean subalpine lakes: Zurich (Switzerland) (55, 56), Garda
(Italy) (48), Mondsee (Austria) (27), Nantua (France) (17), and Bourget (France) (23, 24). Planktothrix is one of the most important MC-producing genera in temperate lakes (27). Var-ious chemical, physical, and biological parameters are involved in the development of cyanobacteria (12), and the variability of the spatial distribution (biogeography), the determinism of cyanobacterial blooms, and their impact at the lake scale are not understood. Several studies have highlighted the impor-tance of long-term data sets in attempting to elucidate these ecological questions (2, 3, 20, 24, 57). However, existing long-term biomonitoring programs are usually incomplete and started, at best, in the middle of the 1950s, when the majority of the lakes (in temperate regions) were already impacted by cyanobacterial blooms. The paucity of long-term climatic and environmental monitoring data on the water body can be com-pensated by the use of proxy data from high-resolution sedi-mentary records (22). Fossilized organic components provide an archive of ancient aquatic microbial communities and hence can be used to reconstruct variations in climate and their impact on biodiversity (9). Preserved DNA can provide infor-mation at the species level by phylogenetic comparison, as well as data on quantitative proportions of species, and DNA has been shown to be preserved in the sediments of stratified lakes with anoxic and cold bottom waters (5, 9, 11). A strong DNA
* Corresponding author. Mailing address: INRA-UMR CARRTEL, Biodiversity, Functioning and Evolution of Lacustrin Ecosystem (BioFEEL), 75 Avenue de Corzent, BP 511, 74203 Thonon-les-Bains Cedex, France. Phone: 33 4 50 26 78 72. Fax: 33 4 50 26 07 60. E-mail: isabelle.domaizon@thonon.inra.fr.
† Supplemental material for this article may be found at http://aem .asm.org/.
adsorption to mineral and organic matrices in sediments is also thought to be responsible for enhanced preservation due to protection against degradation by nucleases (4, 10, 44, 47, 49). Consequently, the cells of different microorganisms may often be preserved in deep lake sediments with sufficient fidelity to allow taxonomic identification or ecological inference, thus producing an archive of limnological history.
To date, most preserved DNA analyses have been per-formed on DNA from permafrost zones, halite crystals, amber, and marine sediments (4, 9, 10, 13, 41). Sediment records have been applied to a range of global environmental issues, includ-ing lake acidification, eutrophication, climate change (22), and the effect of human activity on the environment (34). In this sense, molecular biology-based techniques, such as PCR and quantitative PCR (qPCR), represent powerful tools for pro-viding valuable information about in situ microbial dominance and diversity. Recently, Taq nuclease assays (TNAs) were de-signed and applied for quantification of total and toxic
Plank-tothrix populations in water samples (6, 40, 50). However, to
our knowledge, no comparable approach has been reported from the paleolimnological point of view, particularly regard-ing the quantification of Planktothrix and cyanobacteria in the preserved DNA derived from lake sediments. However, the comparability of such studies between environments, or even between different depths in the same sediment core, depends on various factors, e.g., sedimentary processes (ultimately ex-plaining the efficiency of the preservation of organic matter) or methodological issues such as nucleic acid yield and amplifi-cation efficiency for each particular sediment type (33). Addi-tionally, studies on preserved DNA are complicated by the extreme sensitivity of analytical techniques to DNA contami-nation and degradation, requiring adequate test procedures for both experimental and authentication methodology. The sen-sitivity of qPCR to even a small amount of coextracted inhib-itors, such as organic matter in humus-rich sediments, might cause erroneously low estimates of the target. Therefore, these facts necessitate proper validation of the method before ap-plying it to real environmental sediment samples.
The primary goal of this study was to demonstrate that qPCR can be applied successfully to enumerate total cyano-bacterial and total/toxic Planktothrix rubescens and Planktothrix
agardhii populations in preserved DNA derived from the
sed-iments of three lakes located in the French Alps. This meth-odological validation represents an essential step for develop-ing the analytical approach for further application to large-scale analyses of whole deep-sediment cores in order to understand the historical presence of cyanobacteria and their impact on lake ecology.
MATERIALS AND METHODS
Culture sample collection.A total of 21 P. rubescens, 17 P. agardhii, and 26 other cyanobacterial and algal clonal but nonaxenic strains were used for the testing of primers and probes (see Table S1 in the supplemental material). Strains were either obtained from the Thonon Culture Collection (TCC) (INRA, France) or supplied by international culture collections. All strains were grown under sterile conditions in BG11 medium (46) under continuous light (20mol m⫺2s⫺1) at 20⫾ 2°C. Cells were harvested during the early stationary phase and subjected to counting by microscopy or DNA extraction as detailed below.
Lake sediment samples.Our approach was based on analyses of sediment cores from three lakes located in the French Alps (Lake Geneva [Leman], Lake Bourget, and Lake Annecy) (see Table S2 in the supplemental material). Lake
Bourget (45°44⬘N, 5°52⬘E; 18 km long by 2.8 km wide; maximum depth, 145 m; mesotrophic) is a hard-water lake at the northwestern edge of the French Alps (19). Five sediment cores were obtained from both the southern basin and the northern basin of Lake Bourget (cores B1 to B5) (see details in Table S2). One sediment core from Lake Annecy (A1) was retrieved at the central point, at a 65-m depth, in 2010. Lake Annecy (45°51⬘N, 6°10⬘E; 14.6 km long by 3.2 km wide; maximum depth, 82 m; oligotrophic) is known as “Europe’s cleanest lake.” Sediment core L1 from Lake Geneva (46°26⬘N, 6°33⬘E; 73 km long by 14 km wide; maximum depth, 310 m; mesotrophic), the largest lake on the border between France and Switzerland, at the northern end of the French Alps, was taken at the deepest point of the lake. All cores were retrieved by means of a UWITEC gravity corer (Mondsee, Austria) and dated by radionuclides (210
P,
137
Cs, and241
Am) and lamination counting as previously described (19, 39). Four different slices were subsampled along the deep cores taken from Lake Bourget (B5-1, B5-4, B5-10, and B5-24), Lake Annecy (A1-1, A1-4, A1-10, and A1-24), and Lake Geneva (L1-1, L1-4, L1-10, and L1-24); these slices (1-cm height) were taken at 1-, 4-, 10-, and 24-cm core depths, respectively, to compare distinct regions of the cores which may correspond to the different trophic periods in the lakes (oligotrophic to eutrophic) (19, 39). The dating chronology of the sediment is presented in Table S2 in the supplemental material. For the sediment cores B1 to B4 from Lake Bourget, samples were taken only at a 4-cm depth in each core (samples B1-4, B2-4, B3-4, and B4-4) in order to obtain repeated measures, at the same depth, from different cores taken in the same lake. For each sediment sample, an aliquot of approximately 10 g of homoge-nized wet sediment was dried at 50°C and weighed. The rest of the sample was subjected to molecular analysis.
Due to the risk of contamination of the sediment samples by modern DNA, special laboratory precautions against contamination were applied as described previously (separated stations for sampling, DNA extractions, and PCR, sterile disposable labware, and negative controls for PCR) (9, 34).
Total cell counts from culture samples by microscopic analysis.In order to test the accuracy of qPCR, P. rubescens strain TCC 29 cell numbers determined by microscopy were related to those estimated by qPCR with DNA extracts. P.
rubescens TCC 29 cell densities were determined from freshly grown cultures
preserved with Lugol’s solution by use of an optical microscope (Olympus BH-2) equipped with a hemocytometer (Malassez cells). Samples were diluted up to 100-fold (depending on the population density), P. rubescens TCC 29 filament lengths were measured at a magnification of⫻20, and the results were averaged for at least duplicate whole-chamber counting. The number of TCC 29 cells making up the filament was estimated by measuring the total filament length and mean cell length (5m as measured at a magnification of ⫻400). All image combining, processing, and analysis were performed with the standard software package provided by Olympus (BH-2).
DNA extraction from culture and sediment samples. Genomic DNAs (gDNAs) from a wide range of cyanobacterial and other algal cultures were extracted by the DNA extraction protocol with GenElute LPA (linear polyacryl-amide) modified by Jardillier et al. (26). Modification included the addition of 1 l of GenElute LPA (Sigma-Aldrich, Inc.) to aid in DNA recovery.
Genomic DNAs preserved in sediment samples were extracted from 2 or 3 subsamples of 1 g of wet sediment each to avoid any heterogeneity, and resulting DNA extracts were pooled together. DNA was extracted using an UltraClean soil DNA isolation kit (Mobio, Carlsbad, CA) according to the manufacturer’s in-structions. The DNA extraction was evaluated on the basis of recovery efficiency, reproducibility, resulting DNA integrity, and performance in qPCR analyses. The total DNA concentration was measured using a Quant-iT PicoGreen kit (Invitrogen) on a Rotor Gene 3000 qPCR cycler with software version 6.0 (Corbett Research, Mortlake, Australia). Quantification with lambda DNA stan-dards (Invitrogen) was performed in triplicate. The DNA was stored at⫺20°C until further analysis.
Preserved DNA quality check by amplification of the 16S rRNA-ITS region.
Each preserved DNA extract was analyzed for the presence of the cyanobacterial 16S rRNA-internal transcribed spacer (ITS) gene region by PCR (25) to deter-mine the quality and fragment integrity of the DNA throughout the core and to exclude the possibility of PCR inhibition causing negative qPCR results. Thus, the presence of 16S rRNA-ITS gene amplification products (around 1,500 bp) was used as a reference to standardize the PCR. PCR amplification was per-formed in a volume of 50l containing up to 50 ng of a template DNA, 5 l of 10⫻ PCR buffer (Bioline), 500 nM (each) forward (CYA371F [5⬘-CCTACGG GAGGCAGCAGTGGGGAATTTTCC-3⬘]) and reverse (373R [5⬘-CTAACCA CCTGAGCTAAT-3⬘]) primers (Biomers), 1.2 mM MgCl2(Bioline), 1 U of Taq
DNA polymerase (Bioline), deoxynucleoside triphosphates (a 200M concen-tration of each; Bioline), and 1 mg ml⫺1bovine serum albumin (BSA; Sigma). All PCRs were performed using a TProfessional Basic gradient thermocycler
(Biometra) and included an initial denaturation at 94°C for 5 min, followed by 30 cycles of 94°C for 1 min, an annealing temperature of 60°C for 1 min, and elongation at 72°C for 1 min. The amplification products of the 16S rRNA-ITS gene region from preserved DNA were sequenced (Beckman Coulter Genomics) as described previously (31). Obtained sequences were checked for chimera formation and compared with similar sequences available in GenBank by a BLAST search (1).
qPCR protocols.Two types of qPCR chemistries were applied in our study: a nonselective fluorescent dye, SYBR green (SG), was explored to quantify total cyanobacteria, while TNAs were applied to enumerate (i) the total population of
Planktothrix by amplification of two alternatives (the intergenic spacer region of
the phycocyanin operon [PC-IGS] region [two alternative primer-probe sets] and the 16S rRNA gene [TNA-16S rRNA]) and (ii) the population of MC-producing
Planktothrix species via amplification of the mcyA region, which is indicative of
microcystin biosynthesis (see Table S3 in the supplemental material) (21). Mul-tiplex qPCR assays were then applied to quantify total and toxic Planktothrix spp. in a single reaction tube for all sediment samples.
All amplifications were performed in triplicate, using a Rotor Gene 3000 instrument with software version 6.0 (Corbett Research, Mortlake, Australia). Each multiplex reaction mix (25l) contained 12.5 l of 2⫻ Rotor Gene multiplex PCR master mix (Qiagen), a 300 nM concentration of each primer, a 200 nM concentration of each TaqMan probe, and 2l of template DNA. No-template controls and respective positive controls were included in all runs. The TaqMan probes had a fluorescent reporter dye (6-carboxyfluorescein [FAM] or 6-carboxyl-X-rhodamine [ROX]) attached covalently to the 5⬘ end and black hole quencher 1 (BHQ-1) or black hole quencher 2 (BHQ-2) dye (see Table S3 in the supplemental material). The following three qPCR master mixes were evaluated based on their performance during amplification: QuantiTect Probe PCR master mix, with and without ROX passive reference dye (Qiagen), and Rotor Gene multiplex PCR master mix (Qiagen). The singleplex TNA reaction mix (25l) consisted of 12.5 l of one of the 2⫻ PCR master mixes mentioned above, 300 nM (each) forward and reverse primers (Biomers), 200 nM TaqMan probe (Biomers), and 1 to 5l of template DNA. TNA reactions were initiated by either a 5-min (for Rotor Gene multiplex PCR master mix) or 15-min (for QuantiTect Probe PCR master mixes) hold at 95°C to activate the hot start polymerase, followed by 40 cycles of a two-step PCR consisting of a denaturation step at 95°C for 15 s and subsequent annealing and elongation steps at 60°C for either 15 s (for Rotor Gene multiplex PCR master mix) or 60 s (for QuantiTect Probe PCR master mixes).
For the SYBR green assay, two alternative primer sets were checked to enumerate total cyanobacteria (25): (i) CYA371F-CYA783R, targeting the 16S rRNA gene, and (ii) CSIF-373R, targeting the 16S rRNA-ITS gene region. qPCRs were performed in a 25-l volume containing 12.5 l of 2⫻ QuantiTect SYBR green PCR master mix (Qiagen), 500 nM (each) forward and reverse primers (Biomers), and 2l of template DNA. The qPCR program consisted of an initial polymerase activation step (95°C for 15 min) followed by 40 cycles of denaturation at 94°C for 60 s, annealing at 60°C for 60 s, and extension at 72°C for 60 s. The qPCR program was followed by a melting curve determination step (from 70°C to 95°C at a transition rate of 1°C every 5 s) to determine the specificity of the amplification. As an additional post-PCR analysis (51), all qPCR products from the SYBR green-rRNA-ITS assays were analyzed for un-specific PCR amplification by running in a 2% agarose gel for 99 min at 50 V.
Assessment of specificity of qPCR assays.The specificities of primers and TaqMan probes as well as the optimal annealing temperatures for all qPCR assays were evaluated both in silico by Primer-BLAST (1) and experimentally by amplification tests with a wide range of target and nontarget algal species (see Table S1 in the supplemental material). The specificity and robustness of each TNA were tested by adding different amounts of DNA originating from other organisms as a background (40). DNAs extracted from Microcystis strain HUB 524, Lyngbya strain TCC 3a, Synechococcus strain TCC 32, and Anabaena strain TCC 79 were added to the DNA of P. rubescens strain TCC 29 (at 1.25 ng of DNA per template) and mixed at ratios of 1:100 and 1:1, and the resulting mixtures were analyzed by TNAs amplifying the PC-IGS region and the 16S rRNA gene. The TNA targeting the mcyA region was considered highly specific (6), and only DNA from Synechococcus strain TCC 32 was added to the DNA of
P. rubescens strain TCC 29 (at 0.5, 5, and 50 ng of DNA per template) and mixed
at ratios of 1:100, 1:10, and 1:1. In order to verify the specificity of the qPCR assays performed with sediment samples, the resulting qPCR amplification prod-ucts (for enumeration of total cyanobacteria and toxic Planktothrix spp.) from preserved DNA were sequenced as described above.
Standardization and amplification efficiency.In our study, the minimum in-formation for publication of quantitative PCR experiments (MIQE) guidelines (8) were followed in order to standardize the experimental practice and
termi-nology and to promote consistency between different results (the quantification cycle [Cq] was used instead of the threshold cycle [CT]).
Tenfold dilution standards were prepared from gDNA for each qPCR assay, ranging from 2.5 to 2.5⫻ 10⫺5ng gDNAl⫺1. For each standard, the concen-tration (number of copies) of diluted DNA was plotted against the mean CQ value (determined in triplicate), and the slopes of the standard curves were calculated by performing a linear regression analysis with Rotor Gene software (version 6.0; Corbett Research, Mortlake, Australia). The mcyA, 16S rRNA, and PC-IGS gene copy numbers of the DNAs of the standard strains of Planktothrix were calculated using the equation indicated below, assuming that the
Plankto-thrix agardhii strain CYA126/8 genome has only one PC-IGS and one mcyA gene
and four copies of the 16S rRNA gene (R. Kurmayer, unpublished data). Cell numbers for total cyanobacterial counts were estimated using an average 16S rRNA gene copy number of 3 (18, 41). The approximate genome size of
Plank-tothrix spp. was determined to be 5.0 Mb, and the average size of cyanobacterial
genomes (4.2 Mb) was used to estimate their total counts (54; http://www.ncbi .nlm.nih.gov/genomes/lproks.cgi?view⫽1). It was calculated that 25 ng of each gDNA standard corresponded to averages of 4.63⫻ 106
and 5.48⫻ 106
cells for
Planktothrix spp. and total cyanobacteria, respectively, according to the following
equation: number of copies per microliter⫽ DNA concentration (g/l) ⫻ 106
(pg/g) ⫻ (1 pmol/660 pg ⫻ genome size [bp]) ⫻ 6.022 ⫻ 1023(copies/mol)⫻
10⫺12(mol/pmol).
Cqvalues of the sediment samples were determined for each TNA and SYBR green assay by importing the respective standard curve from each qPCR assay and adjusting it to the Cqvalue of the 10⫺4or 10⫺5gDNA standard, used as a respective positive control in each run. The accuracy of the qPCR assay was confirmed by relating the cell numbers determined by microscopy and estimated by qPCR with those determined by TNA-16S rRNA with DNA extracts, and the regression equation defining this relationship was established by standard Excel software.
Assessment of inhibition in sediment samples.16S rRNA and TNA-PlPC (50) were performed with a series of increasing amounts of genomic DNA of P. rubescens strain TCC 29 (0.125, 1.25, 12.5, and 125 ng per reaction mix) in the presence of increasing amounts of sediment DNAs (extracted from the Lake Bourget core at different depths [1, 10, and 24 cm]), mixed at ratios of 1:1, 1:10, 1:100, and 1:1,000. Efficiencies of qPCR performed with the resulting mixtures and also with DNA extracts of P. rubescens strain TCC 29 in the absence of sediment DNAs were compared based on the obtained Cqvalues. To test the effect of sediment addition (potential inhibition) on the qPCR results, the data were subjected to one-way analysis of variance (ANOVA) (the equal variance of groups and the normal distribution of residuals were tested). XLstats software was used to perform this statistical analysis.
Nucleotide sequence accession numbers.The sequences of the amplification products of the 16S rRNA-ITS gene region from preserved DNAs were depos-ited in the GenBank database under accession numbers JN098337 to JN098376. The sequences of qPCR amplification products from preserved DNAs were deposited in the GenBank database under accession numbers JN703798 to JN703887.
RESULTS AND DISCUSSION
Specificity of qPCR assays.For all TNAs, the assessment of
primer and probe specificities was performed previously with respective controls (6, 40, 50); however, in order to confirm their specificities with other isolates, additional in silico and experimental amplification tests were performed in our study. The results revealed that Planktothrix-specific primers and TaqMan probes were specific for P. rubescens and P. agardhii but not for other species of cyanobacteria. The PC-IGS and 16S rRNA gene fragments were amplified from all P. agardhii and P. rubescens strains tested, whereas the mcyA gene frag-ment was amplified only from MC-producing Planktothrix strains (see Table S1 in the supplemental material). All non-target DNAs could be amplified by non-targeting the cyanobacte-rium-specific 16S rRNA-ITS gene region but gave no products when those DNAs were amplified with Planktothrix-specific primer-probe sets. The presence of as much as 0.0125 to 1.25 ng of Microcystis, Lyngbya, Synechococcus, and Anabaena
DNAs in the qPCR mixtures did not show a significant effect on Cqvalues of the samples which had only P. rubescens DNA (Table 1). For mcyA, the majority of nonspecific templates did not show any amplification, but in some cases, late amplifica-tion signals (Cq ⬎ 31) were observed for nontarget species,
which could be abundant in the lake sediments (e.g.,
Synecho-coccus, Microcystis, and Anabaena). Nevertheless, the
sequenc-ing results for the mcyA amplicons from the qPCR runs with sediment samples from 1-, 4-, and 24-cm core depths (16 se-quences for each depth) confirmed the specificity of TNA-MAP (6), demonstrating the specific amplification of the target
mcyA gene of P. rubescens and P. agardhii only from sediment
samples.
The application of SYBR green with optimal primer sets can be as sensitive as qPCR using TaqMan probes (35), but it is much cheaper to operate. In our study, SYBR green assay with the CYA371F-CYA783R primer set did not show sufficient specificity over the wide range of annealing temperatures ex-amined (52 to 60°C). The alternative primer set, CSIF-373R, appeared to be highly specific for cyanobacteria, and a single amplification product with a characteristic melting tempera-ture was observed when both genomic DNAs from a variety of algal cultures and preserved DNAs from sediment samples were analyzed. Importantly, the characteristic melting temper-atures of different cyanobacterial standard strains, including P.
rubescens strains TCC 29 and TCC 38 (86⫾ 0.1°C), P. agardhii
strains SAG 5.81 and CCAP 1459/15 (86.1⫾ 0.1°C), Anabaena strain TCC 79 (85.8⫾ 0.2°C), Microcystis strains HUB 5.3 and HUB 524 (85.9⫾ 0.1°C), and Synechococcus strains TCC 32 (86.2⫾ 0.3°C) and TCC 173 and 175 (87.3 ⫾ 0.6°C), corre-sponded to those for DNAs amplified from sediment samples
(86.1⫾ 0.2°C). This result confirms that specific amplification occurred with preserved DNAs from sediment samples. The sizes of the PCR products varied among the different cyano-bacterial genera (275 bp to 350 bp) (25), which resulted in small differences (⬍1.5°C) in the characteristic melting tem-peratures. When a DNA mix containing known amounts of specific and nonspecific templates was analyzed by qPCR, only specific amplification was observed, based on the presence of a single melting peak. Post-PCR analyses by inspection of an agarose gel containing each sediment sample showed no un-specific products, which confirmed the results of melting curve analyses. Primer dimers were not formed during qPCR exper-iments, as shown by the negative-control samples and postam-plification melting curve analyses for every run. Moreover, since the application of SYBR green with relatively large (⬃300-bp) qPCR products might be questionable for environ-mental samples, the resulting rRNA-ITS gene amplification products of qPCR runs were sequenced to obtain the ultimate proof of the specificity of this assay for sediment samples. The sequencing results (44 sequences) obtained for depths of 1, 4, 10, and 24 cm revealed a wide range of cyanobacterial diver-sity, and no unspecific sequences were observed. The majority of clones were affiliated with Synechococcus spp., Planktothrix,
Anabaena, and Microcystis spp. Thus, qPCR with SYBR green
chemistry was found to be specific even with sediment samples, was reliable and robust enough to prevent false-positive re-sults, and therefore could be applied successfully to enumerate total cyanobacteria in sediment samples.
Sensitivity and amplification efficiency of qPCR assays
per-formed with culture and preserved DNA samples.Standard
curves based on serial dilutions of genomic DNA were
con-TABLE 1. qPCR assay specificity check for Planktothrix rubescens based on Cqvalues obtained for mixtures of
target and nontarget species DNAs
Organism(s)a Strain(s) Ratio of
mixture
Cqvalue (mean⫾ SD)
TNA-PlPC TNA-16S
rRNA
TNA-MAP with dilution factor of:
1 0.1 0.01
P. rubescens TCC 29 21.52⫾ 0.04 19.57⫾ 0.05 16.82⫾ 0.07 20.58⫾ 0.11 24.83⫾ 0.08
P. rubescens and TCC 29/HUB 524 1:1 21.74⫾ 0.07 19.61⫾ 0.03
Microcystis TCC 29/HUB 524 1:100 21.94⫾ 0.03 19.89⫾ 0.19 Microcystis HUB 524 33.11⫾ 0.04 33.82⫾ 0.07 P. rubescens and TCC 29/TCC 3a 1:1 21.95⫾ 0.13 20.15⫾ 0.04 Lyngbya TCC 29/TCC 3a 1:100 21.81⫾ 0.03 19.98⫾ 0.08 Lyngbya TCC 3a 34.12⫾ 0.07 33.91⫾ 0.03 P. rubescens and TCC 29/TCC 32 1:1 21.78⫾ 0.02 19.58⫾ 0.08 16.68⫾ 0.06 20.12⫾ 0.04 24.89⫾ 0.02 Synechococcus TCC 29/TCC 32 1:10 16.97⫾ 0.05 20.59⫾ 0.08 24.53⫾ 0.23 TCC 29/TCC 32 1:100 22.03⫾ 0.02 19.95⫾ 0.09 16.74⫾ 0.05 20.22⫾ 0.05 24.78⫾ 0.03 Synechococcus TCC 32 32.17⫾ 0.15 32.27⫾ 0.07 31.72⫾ 0.22 —b —b P. rubescens and TCC 29/TCC 79 1:1 22.32⫾ 0.12 20.14⫾ 0.09 Anabaena TCC 29/TCC 79 1:100 21.84⫾ 0.06 19.96⫾ 0.12 Anabaena TCC 79 32.59⫾ 0.04 32.56⫾ 0.05
aMixes of P. rubescens strain TCC 29 and background DNAs originating from other organisms (Microcystis strain HUB 524, Lyngbya strain TCC 3a, Synechococcus strain TCC 32, and Anabaena strain TCC 79).
structed for all four qPCR assays, and they were not extrapo-lated beyond the ranges of dilution, which were defined as 23.2⫻ 105to 23 and 27.4⫻ 105to 27 copies per template for
each of the target regions detected by TNAs and SYBR green reactions, respectively. The amplification efficiencies (E) for all qPCR assays were in the range of 92 to 103% (Table 2). Since quantification errors typically occur toward both ends of a calibration curve, cell quantification for sediment samples was achieved by direction toward the central region of the standard curves, which is found to be the most resistant against back-ground effects (28). A significant relationship between the
Planktothrix cell numbers estimated by microscopic counting
and those estimated by TNA-16S rRNA was found (Fig. 1C). The cell number per milliliter estimated by qPCR with DNA extracts was 1.11 ⫻ 107 ⫾ 9.81 ⫻ 105, compared to 2.08 ⫻
107⫾ 0.56 ⫻ 106for enumeration by direct microscopic
count-ing. The regression equation was as follows: y⫽ 4.38x ⫺ 1,184 (R2⫽ 0.97; P ⬍ 10⫺4; n⫽ 18), where y and x are the log cell
numbers determined by microscopic and TNA-16S rRNA methods, respectively.
Controls for evaluating the performances of the multiple assays, amplifying each target individually and comparing the results with those for the multiplex assays, were performed for both cultures and sediment samples. Resulting Cqvalues for all
assays were highly comparable, independent of the sample type and target gene (TCC 29 had Cqvalues of 16.66⫾ 0.45
[single-plex] and 16.39 ⫾ 0.18 [multiplex], and B5-1 had values of 27.14 ⫾ 0.40 [singleplex] and 26.52 ⫾ 0.09 [multiplex], as determined by TNA-PlPC). The different qPCR mixes tested did not reveal significant differences in performance, demon-strating similar Cqvalues for both culture and sediment sam-ples as determined by either TNA-PlPC or TNA-16S rRNA (data not shown). However, Rotor Gene multiplex PCR mas-ter mix, optimized specifically for Rotor Gene cyclers, had a shorter analysis time and was therefore used for all further qPCRs.
When two alternative TNAs for enumeration of total
Plank-tothrix populations via the PC-IGS region of PlankPlank-tothrix, i.e.,
TNA-PC and TNA-PIPC, were compared, the latter demon-strated a higher sensitivity of detection, showing lower Cq
val-ues (12.80⫾ 0.35 for TCC 29 and 10.86 ⫾ 0.24 for TCC 83-1 with TNA-PlPC versus 15.38⫾ 0.37 for TCC 29 and 13.52 ⫾ 0.07 for TCC 83-1 with TNA-PC). Thus, all qPCR assays with sediment samples were performed by TNA-PlPC. Total
Plank-tothrix enumeration by either 16S rRNA or PC-IGS
gene-targeting primer-probe sets revealed comparable results for both sediment and culture samples, showing the high repro-ducibility and reliability of these genetic markers. Generally,
CQ values obtained by TNA-16S rRNA were the lowest among the other TNAs for all preserved DNA samples (Ta-ble 2). This was likely due to the multiple copy number of the 16S rRNA gene (four copies of the 16S rRNA gene are found in P. agardhii CYA126/8). It was feasible to detect small numbers of Planktothrix, down to 3 copies per tem-plate, by TNA-16S rRNA assay, while such detection was not reliable by TNA-PlPC. Thus, qPCR targeting the 16S rRNA gene of Planktothrix spp. has certain advantages over the application of PC-IGS-based qPCR, since it has in-creased sensitivity and enables the detection of rare organ-isms in a sample (34, 35, 50). TABLE 2. Parameters for standard curves of qPCR amplifications of Planktothrix rubescens obtained from culture (TCC 29 and TCC 83-1) and sediment (B5-1 and B5-24) samples Parameter a Value TNA-16S rRNA TNA-PlPC TNA-MAP SG-rRNA ITS TCC 29 TCC 83-1 B5-1 B5-24 TCC 29 TCC 83-1 B5-1 B5-24 TCC 29 TCC 83-1 B5-1 B5-24 TCC 29 TCC 83-1 B5-1 B5-24 Slope ⫺ 3.37 ⫺ 3.34 ⫺ 3.27 ⫺ 3.29 ⫺ 3.35 ⫺ 3.31 ⫺ 3.2 ⫺ 3.36 ⫺ 3.25 ⫺ 3.15 ⫺ 3.39 ⫺ 3.36 ⫺ 3.51 ⫺ 3.40 ⫺ 3.52 ⫺ 3.35 R 2 0.998 0.998 0.998 0.998 0.998 0.999 0.996 1 0.997 0.996 0.994 1 0.998 0.998 0.998 0.999 E (%) 98.6 99.3 102.1 101.0 98.6 99.9 102.3 98.0 103.2 101 97.0 98.0 93.6 96.8 92.0 99.0 y intercept 35.67 36.61 32.89 36.26 38.14 36.26 34.57 36.65 38.75 38.32 39.39 39.57 36.02 32.54 36.73 36.48 Dilution factor 1–10 ⫺ 5 1–10 ⫺ 5 1–10 ⫺ 2 1, 0.1 1–10 ⫺ 4 1–10 ⫺ 4 1–10 ⫺ 2 1, 0.1 1–10 ⫺ 4 1–10 ⫺ 4 1–10 ⫺ 2 1, 0.1 1–10 ⫺ 5 1–10 ⫺ 5 1–10 ⫺ 2 1, 0.1 aR 2, correlation coef ficient; E , amplification ef ficiency.
Assessment of inhibition due to coextracted materials from
sediment samples. Due to the potentially high humic acid
content in sediment samples, an absence of inhibition should be demonstrated when performing qPCR with such samples.
The approach applied in this case was based on the assumption that inhibitors are diluted out when a log-linear relationship is achieved between Cqand the dilution factor (33). No inhibition effect was noticed when preserved DNAs from sediment
sam-FIG. 1. Examples of qPCR standard curves obtained for Taq nuclease assays (TNA-16S rRNA, TNA-PlPC, and TNA-MAP) and the SYBR green assay (SG-rRNA-ITS), generated after amplification of predetermined concentrations (log scale) of MC-producing P. rubescens strain TCC 29 (A) and Lake Bourget sediment sample B5-1 (B). For the description of all curves, see Table 2. (C) Correlation between P. rubescens strain TCC 29 cell densities estimated by microscopic counting and those estimated by TNA-16S rRNA. Error bars, which are hidden by the symbols in almost all cases, give the standard deviations for three independent amplifications.
ples from different depths along the sediment core were mixed with P. rubescens strain TCC 29 at any ratio, as assessed by either TNA-16S rRNA or TNA-PlPC. Further ANOVA showed no significant effect of sediment DNA addition on Cq
values at any dilution rate (P ⫽ 0.935 and P ⫽ 0.584 for TNA-16S rRNA and TNA-PlPC, respectively). Cqvalues of all
mixes were 15.62⫾ 0.14 and 11.06 ⫾ 0.33 by TNA-PlPC and TNA-16S rRNA, respectively, while Cqvalues of strain TCC 29
in the absence of sediment samples were 15.46⫾ 0.27 and 10.86⫾ 0.51, respectively. When both culture and preserved DNAs were diluted 10-, 100-, and 1,000-fold and mixed at a ratio of 1:1, Cqvalues of those mixes were not changed
com-pared with those of TCC 29 alone at the respective dilution rate. Additionally, a CQvalue of 11.19⫾ 0.73 was achieved for
all nondiluted culture and sediment samples mixed at a ratio of 1:1, as determined by TNA-16S rRNA, which was close to the
CQ value for TCC 29 alone (10.86⫾ 0.51). Importantly, the amplification efficiencies of all qPCR assays performed with preserved DNAs from sediment samples (0.87 to 1.16) (Table 2; Fig. 1B) were as high as those with the respective standards (0.91 to 1.05) (Table 2; Fig. 1A). Similar qPCR amplification efficiencies ensured that no PCR-inhibiting contaminants were present in the sediment samples. Based on the obtained re-sults, we concluded that qPCRs were not inhibited, which is a prerequisite for reliable enumeration of both toxic and total
Planktothrix spp. and total cyanobacteria in preserved DNA. Quantification of total/toxic Planktothrix spp. and total
cy-anobacteria in preserved DNAs from lake sediments.
Sedi-ment sampling sites were selected based on the fact that Lake Geneva, Lake Annecy, and Lake Bourget are deep large lakes (with anoxic bottom waters over at least the last few decades) from the same region but show different histories in terms of their trophic status and, consequently, different diversity and quantities of cyanobacteria (16, 24). Thus, if DNA is preserved in the laminated sediments of these lakes, DNA-based analyses of sediment samples should reveal these differences regarding planktonic communities, and more particularly, qPCR analyses are likely to reflect the abundance and dominance of a wide range of cyanobacterial species in water columns.
Lake sediments contained 0.24 (L1) to 5.95 (B5-10)g DNA per gram of dry sediment. Lake Annecy sediments had smaller amounts of genomic DNA extracted than those of Lake Bour-get and Lake Geneva, probably due to low productivity. The DNAs from lake sediments resulted in amplification of 1,500-bp PCR products from the 16S rRNA-ITS gene region; thus, as reported before by Coolen et al. (9) for other ecosys-tems, fragmentation of this region of DNA during burial in the sediments did not occur, or at least was rare enough to favor the preservation of a sufficient quantity and quality of DNAs from several cyanobacterial groups. Moreover, the amplifica-tion products of the 16S rRNA-ITS gene region were se-quenced, and around 100 sequences per core depth were ob-tained (O. Savichtcheva et al., unpublished data). To date, sequencing analyses with preserved DNAs from sediments have not been performed often enough, indicating the neces-sity and novelty of our approach. In this study, we focused mainly on demonstration of the quality and integrity of a pre-served DNA fragment, rather than discussing the diversity of various cyanobacterial groups, by sequencing the 16S rRNA-ITS gene region. The sequencing results obtained for depths of
1, 4, 10, and 24 cm revealed a wide range of cyanobacterial diversity, and no chimeric sequences were observed. The ma-jority of clones were affiliated with Synechococcus spp. but also included Cyanobium, Anabaena, Nostoc, Microcystis, and
Planktothrix spp. Thus, these results demonstrate sufficient
quality and fragment integrity of the preserved DNA. We determined the amounts of DNA derived from
Plank-tothrix and cyanobacteria in sediment cores by qPCR. Overall,
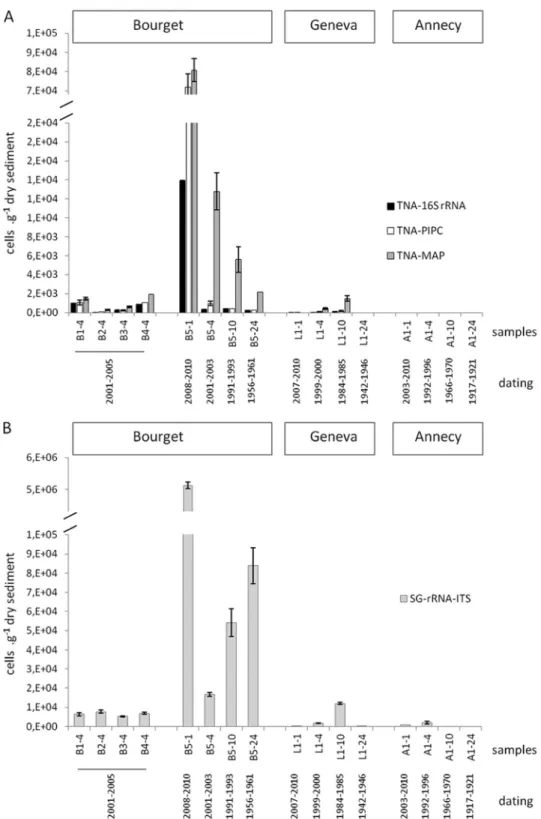
qPCR assays performed with preserved DNAs from different lake sediments revealed clear differences in the quantitative compositions of total and toxic Planktothrix and total cyano-bacteria (Fig. 2). Thus, qPCR enumeration showed high cya-nobacterial counts in Lake Bourget sediments and very low ones in Lake Annecy sediments, which is in good correspon-dence with available data on lake water monitoring (16, 24, 43). Lake Bourget and Lake Geneva were indeed affected by eutrophication in the second half of the 20th century, and these systems are now recovering toward an oligotrophic status, while Lake Annecy has not been impacted by such strong eutrophication, and its oligotrophy has been preserved over the past decade (42). Lake Geneva underwent strong eutro-phication in the early 1960s, but following the implementation of phosphorus reduction measures in the 1970s, the phospho-rus concentration decreased from⬃90 g liter⫺1in the mid-1970s to⬃30 g liter⫺1in 2005 in Lake Geneva (53) and from 120 to 26g liter⫺1between 1980 and 2001 in Lake Bourget (24).
Among all the lakes, Lake Bourget had the highest counts for total (as determined by both 16S rRNA and PC-IGS gene-based qPCR) and toxic (sample B5-1) Planktothrix populations as well as for total cyanobacteria (sample B5-1). Total
Plank-tothrix quantifications based on the 16S rRNA and PC-IGS
genes showed comparable results and demonstrated similar trends for all sediment cores (Fig. 2A). Generally, mcyA-based counts exceeded those of 16S rRNA or PC-IGS gene-based assays (Fig. 2A). The fact that sequencing results for the mcyA amplicons confirmed the amplification of only Planktothrix spp. rejects the idea that the primers targeting this conserved con-densation domain (21) might be able to coamplify other MC-producing taxa. At present, the highest mcyA proportions (⬎100%) in sediment samples cannot be explained. From these preliminary results, it was concluded that the proportion of the mcyA gene has remained high in Lake Bourget since the 1950s and in Lake Geneva since the 1980s. In the future, alternative qPCR assays to enumerate toxic Planktothrix spp. should be applied to validate those results.
For Lake Bourget, the proliferation of MC-producing P.
rubescens has been reported previously (7, 24); the dominance
of this taxon in Lake Bourget has been known at least since 1996 and is associated mainly with the process of restoring this ecosystem. In Lake Annecy sediments, no Planktothrix spp. were detected by qPCR, and Planktothrix has never been re-ported for planktonic assemblages in this lake. The presence of
P. rubescens has been detected in the pelagic compartment of
Lake Geneva, but generally in small amounts (compared to those in Lake Bourget). Planktothrix spp. have been detected in Lake Geneva, especially during the years 1963 to 1985 (16). Importantly, we observed the same trend by performing qPCR assays with lake sediments, which confirmed the lower
Within the Lake Geneva sediment core, total and toxic
Planktothrix spp. were detected at 1-, 4-, and 10-cm depths (for
dating, see Table S2 in the supplemental material) but not at the 24-cm core depth, while other cyanobacteria were detected down to the 24-cm layer. Interestingly, total cyanobacterial
qPCR counts increased gradually from 1 to 10 cm, consistent with the period of strong eutrophication observed in the late 1980s (53), and decreased again at the 24-cm core depth (con-sistent with a period of pre-eutrophication according to data from the long-term monitoring of deep perialpine lakes).
FIG. 2. Abundances of total (TNA-16S rRNA and TNA-PlPC) and MC-producing (TNA-MAP) Planktothrix (A) and total cyanobacteria (SG-rRNA-ITS) (B), estimated by qPCR, in the sediment samples from three lakes located in the French Alps (Lake Geneva, Lake Bourget, and Lake Annecy). Error bars, which are hidden by the symbols in some cases, give the standard deviations for three independent amplifications.
Within the Lake Bourget sediment core, particularly high
Planktothrix and cyanobacterial counts were observed at a 1-cm
core depth (Fig. 2), and they decreased with the depth but remained at high levels at 4-, 10-, and 24-cm core depths. This suggests that the presence of P. rubescens is ancient in this lake (the 24-cm depth in sediment corresponds to the period from 1956 to 1961 [see Table S2 in the supplemental material]). Some older data on planktonic counts (performed occasion-ally) confirm the presence of this taxon in Lake Bourget in 1913 (32).
In the Lake Annecy sediment core, cyanobacteria were de-tected by qPCR at 1- and 4-cm depths but not at 10- and 24-cm core depths (Fig. 2). The values were generally low, with the highest quantification recorded for the 4-cm layer (correspond-ing to the period from 1992 to 1996).
The data obtained in our study are consistent with the past dynamics of cyanobacteria and likely reflect the temporal vari-ations in Planktothrix and cyanobacterial species in these deep lakes. Thus, combining paleolimnology and molecular tools, the amounts of cyanobacterial and Planktothrix compositional turnover in sediments from different lakes could be analyzed, and distinct regions of the sediment core, corresponding to different trophic periods in the lake (oligotrophic to eutro-phic), could be identified, inferring the recent history of the lake ecosystems.
Limitations of the use of qPCR for paleolimnology, with
future perspectives.One of the major limitations in the use of
the qPCR approach for paleolimnology is the efficiency of DNA preservation, which could vary from 1 year to another, especially depending on the length or stability of anoxia. Even though it is difficult to prove that no shifts in degradation processes occurred from 1 year to the other during the past century in the three studied lakes, it could be expected that rather good preservation conditions have occurred during the last century in these three cold, anoxic aquatic sediments (19). Paleolimnological studies performed recently on Lake Bourget and Lake Annecy (19, 39, 42) provided converging information about the efficient storage of organic material in these lakes during the last century. Additionally, we showed that high-quality DNA could be extracted from these sediments, and since a short DNA region is targeted in performing qPCR, the qPCR method should be considered even with partial degra-dation of preserved DNA. Consequently, we assume that full analyses of these sediment cores by using the qPCR approach and sequencing in order to target cyanobacteria (and poten-tially other phytoplanktonic taxa, such as diatoms) are of spe-cial interest to reconstruct the comparative history of these lakes (19). Moreover, to avoid the obstacles related to the different DNA preservation levels within sediment layers, it would be useful to apply the relative counts (e.g., the ratios of
Planktothrix counts to total cyanobacterial counts) instead of
their absolute numbers.
On the other hand, not all cellular material is transported equally well to sediments, and there are species- or cell-specific variations in the level of (post)depositional degradation of intracellular DNA (10). We assume that obtained DNAs rep-resent preserved DNAs from Planktothrix and other cyanobac-teria residing in the water column rather than DNAs derived from physiologically active microorganisms residing in the sed-iments. P. rubescens is characterized by its location in the
metalimnic layer of the water column, and internal waves ap-pear to have a major impact on its spatial distribution and proliferation, influencing the growth of this species by a direct impact on light availability (12). This species is particularly well adapted for growing at low light intensities and also at low temperatures (56). In contrast, other cyanobacterial colonies (especially Microcystis spp.) have a benthic life cycle, where they form blooms during the summer, sink and reach sedi-ments in autumn, remain in the sedisedi-ments as vegetative cells during winter, and provide an inoculum for the water column in spring (30). For Planktothrix, such a benthic life cycle has not been reported. All of these factors could introduce a certain level of discrepancy and error to the qPCR-based approach performed with preserved DNA, especially where comparisons between different phytoplanktonic groups (e.g., diatoms, cya-nobacteria, and chlorophyceae) are concerned. We should thus be cautious in using DNA as a quantitative indicator of past phytoplankton community structure. The combined applica-tion of DNA and tradiapplica-tional biomarkers, such as lipids or pigments, would also provide converging information about the importance of phytoplankton groups stored in sediments. Further studies on the application of qPCR to sediment samples, as well as development of the data set by sequencing of the 16S rRNA-ITS gene region, should be conducted. Only a few characteristics about cell viability of cyanobacteria in sediments have been studied yet; thus, the identification of the active microbial population within sediment samples can be addressed by targeting rRNA content directly rather than tar-geting DNA. Moreover, the preservation (during sedimenta-tion processes and after deposisedimenta-tion on sediments), origin, and size of DNA in sediments should not be neglected. Even though it is expected that similar preservation conditions might occur in various anoxic aquatic sediments, further work exam-ining whether the DNAs from different species are equally well preserved should be performed.
ACKNOWLEDGMENTS
We thank the ANR (France), who supported the Iper Retro pro-gram (ANR VULNS-005), and the INEE (CNRS France), who sup-ported the PEPS program ADNmessager, for financial support. We also thank the Austrian Science Fund (FWF P20231 to R. Kurmayer). We are grateful for the valuable comments and suggestions from two anonymous reviewers of an earlier draft of the manuscript.
REFERENCES
1. Altschul, S. F., W. Gish, W. Miller, E. W. Myers, and D. J. Lipman. 1990. Basic local alignment search tool. J. Mol. Biol. 215:403–410.
2. Anneville, O., et al. 2002. Temporal mapping of phytoplankton assemblages in Lake Geneva: annual and interannual changes in their patterns of suc-cession. Limnol. Oceanogr. 47:1355–1366.
3. Bla´ha, L., et al.2010. Kinetic bacterial bioluminescence assay for contact sediment toxicity testing: relationships with the matrix composition and contamination. Environ. Toxicol. Chem. 29:507–514.
4. Boere, A. C., W. I. C. Rijpstra, and G. I. de Lange. 2011. Exploring preserved fossil dinoflagellate and haptophyte DNA signatures to infer ecological and environmental changes during deposition of sapropel S1 in the eastern Med-iterranean. Paleooceanography 26:PA2204.
5. Borin, S., E. Crotti, and F. Mapelli. 2008. DNA is preserved and maintains transforming potential after contact with brines of the deep anoxic hypersa-line lakes of the Eastern Mediterranean Sea. Sahypersa-line Systems 4:10. 6. Briand, E., et al. 2008. Temporal variations in the dynamics of potentially
microcystin-producing strains in a bloom-forming Planktothrix agardhii (cy-anobacterium) population. Appl. Environ. Microbiol. 74:3839–3848. 7. Briand, J. F., et al. 2005. Variations in the microcystin production of
Plank-tothrix rubescens (cyanobacteria) assessed from a four-year survey of Lac du
Bourget (France) and from laboratory experiments. Microb. Ecol. 50:418– 428.
8. Bustin, S. A., et al. 2009. The MIQE guidelines: minimum information for publication of quantitative real-time PCR experiments. Clin. Chem. 55:611– 622.
9. Coolen, M. J. L., et al. 2004. Combined DNA and lipid analyses of sediments reveal changes in Holocene haptophyte and diatom populations in an Antarctic lake. Earth Planet. Sci. Lett. 223:225–239.
10. Coolen, M. J. L., and G. Shtereva. 2009. Vertical distribution of metaboli-cally active eukaryotes in the water column and sediments of the Black Sea. FEMS Microbiol. Ecol. 70:525–539.
11. Corinaldesi, C., F. Beolchini, and A. Dell’Anno. 2008. Damage and degra-dation rates of extracellular DNA in marine sediments: implications for the preservation of gene sequences. Mol. Ecol. 17:3939–3951.
12. Cuypers, Y., B. Vincon-Leite, A. Gloleau, B. Tassin, and J. F. Humbert. 2011. Impact of internal waves on the spatial distribution of Planktothrix rubescens (cyanobacteria) in an alpine lake. ISME J. 5:580–589.
13. Danovaro, R., C. Corinaldesi, A. Dell’Anno, M. Fabiano, and C. Corselli. 2005. Viruses, prokaryotes and DNA in the sediments of a deep-hypersaline anoxic basin (DHAB) of the Mediterranean Sea. Environ. Microbiol. 7:586– 592.
14. Dokulil, T. M., and K. Teubner. 2000. Cyanobacterial dominance in lakes. Hydrobiologia 438:1–12.
15. Dokulil, T. M., and K. Teubner. 2005. Do phytoplankton communities cor-rectly track trophic changes? An assessment using dicor-rectly measured and paleolimnological data. Freshw. Biol. 50:1594–1604.
16. Druart, J. C., and G. Balvay. 2007. Lake Leman and its microscopic life. Editions Quae, Versailles, France.
17. Feuillade, J. 1994. The cyanobacterium (blue-green alga) Oscillatoria
rube-scens DC. Arch. Hydrobiol. Adv. Limnol. (Ergeb. Limnol). 41:77–93.
18. Fogel, G. B., C. R. Collins, J. Li, and C. F. Brunk. 1999. Prokaryotic genome size and SSU rDNA copy number: estimation of microbial relative abun-dance from a mixed population. Microb. Ecol. 38:93–113.
19. Giguet-Covex, C., et al. 2010. Sedimentological and geochemical records of past trophic state and hypolimnetic anoxia in large, hard-water Lake Bour-get, French Alps. J. Paleolimnol. 43:171–190.
20. Havens, K. E., R. T. James, and T. L. East. 2003. N:P ratios, light limitation, and cyanobacterial dominance in a subtropical lake impacted by non-point source nutrient pollution. Environ. Pollut. 122:379–390.
21. Hisbergues, M., G. Christiansen, L. Rouhiainen, K. Sivonen, and T. Borner. 2003. PCR-based identification of microcystin-producing genotypes of dif-ferent cyanobacterial genera. Arch. Microbiol. 180:402–410.
22. Hobbs, W. O., et al. 2010. Quantifying recent ecological changes in remote lakes of North America and Greenland using sediment diatom assemblages. PLoS One 5:1–12.
23. Humbert, J. F., G. Paolini, and B. Le Berre. 2001. Monitoring a cyanobac-terial bloom and its consequences for water quality, p. 496–499. In G. Hal-legraeff et al. (ed.), Harmful algal bloom 2000. Intergovernmental Oceano-graphic Commission of UNESCO 2001, UNESCO, Paris, France. 24. Jacquet, S., et al. 2005. The proliferation of the toxic cyanobacterium
Plank-tothrix rubescens following restoration of the largest natural French lake (Lac
du Bourget). Harmful Algae 4:651–672.
25. Janse, I., M. Meima, W. E. A. Kardinaal, and G. Zwart. 2003. High-resolu-tion differentiaHigh-resolu-tion of cyanobacteria by using rRNA-internal transcribed spacer denaturing gradient gel electrophoresis. Appl. Environ. Microbiol.
69:6634–6643.
26. Jardillier, L., M. V. Zubkov, J. Pearman, and D. J. Scanlan. 2010. Significant CO2fixation by small prymnesiophytes in the subtropical and tropical
north-east Atlantic Ocean. ISME J. 4:1180–1192.
27. Kurmayer, R., G. Christiansen, J. Fastner, and T. Borner. 2004. Abundance of active and inactive microcystin genotypes in populations of the toxic cyanobacterium Planktothrix spp. Environ. Microbiol. 6:831–841. 28. Kurmayer, R., and T. Kutzenberger. 2003. Application of real-time PCR for
the quantification of microcystin genotypes in a population of the toxic cyanobacterium Microcystis sp. Appl. Environ. Microbiol. 69:6723–6730. 29. Kurmayer, R., E. Schober, L. Tonk, P. M. Visser, and G. Christiansen. 2011.
Spatial divergence in the proportions of genes encoding toxic peptide syn-thesis among populations of the cyanobacterium Planktothrix in European lakes. FEMS Microbiol. Lett. 317:127–137.
30. Latour, D., H. Giraudet, and J.-L. Berthon. 2004. Frequency of dividing cells and viability of Microcystis aeruginosa in sediments of a eutrophic reservoir. Aquat. Microb. Ecol. 36:117–122.
31. Lepe`re, C., I. Domaizon, and D. Debroas.2008. Unexpected importance of potential parasites in the composition of the freshwater small-eukaryote community. Appl. Environ. Microbiol. 74:2940–2949.
32. Le Roux, M. 1928. Recherches biologiques dans les grands lacs de Savoie: Lac du Bourget et d’Annecy, p. 66. J. Abry & Cie, France.
33. Lloyd, K. G., B. J. Macgregor, and A. Teske. 2010. Quantitative PCR method for RNA and DNA in marine sediments: maximizing yield while overcoming inhibition. FEMS Microbiol. Ecol. 72:143–151.
34. Madeja, J., A. Wacnik, E. Wypasek, A. Chandran, and E. Stankiewicz. 2010. Integrated palynological and molecular analyses of late Holocene deposits from Lake Milkowskie (NE Poland): verification of local human impact on environment. Quat. Int. 220:147–152.
35. Malinen, E., A. Kassinen, T. Rinttila, and A. Palva. 2003. Comparison of real-time PCR with SYBR green I or 5⬘-nuclease assays and dot-blot hy-bridization with rDNA-targeted oligonucleotide probes in quantification of selected faecal bacteria. Microbiology 149:269–277.
36. Reference deleted. 37. Reference deleted. 38. Reference deleted.
39. Millet, L., et al. 2010. Reconstruction of the recent history of a large deep prealpine lake (Lake Bourget, France) using subfossil chironomids, diatoms, and organic matter analysis: towards the definition of a lake-specific refer-ence state. J. Paleolimnol. 44:963–978.
40. Ostermaier, V., and R. Kurmayer. 2009. Distribution and abundance of nontoxic mutants of cyanobacteria in lakes of the Alps. Microbiol. Ecol.
58:323–333.
41. Panieri, G., et al. 2010. Ribosomal RNA gene fragments from fossilized cyanobacteria identified in primary gypsum from the late Miocene, Italy. Geobiology 8:101–111.
42. Perga, M. E., M. Desmet, D. Enters, and J. L. Reyss. 2010. A century of bottom-up- and top-down-driven changes on a lake planktonic food web: a paleolimnological and paleoisotopic study of Lake Annecy, France. Limnol. Oceanogr. 55:803–816.
43. Personnic, S., I. Domaizon, T. Sime-Ngado, and S. Jacquet. 2009. Seasonal variations of microbial abundances and virus- versus flagellate-induced mor-tality of picoplankton in three peri-alpine lakes. J. Plankton Res. 31:1161– 1177.
44. Pietramellara, G., J. Ascher, and F. Borgogni. 2009. Extracellular DNA in soil and sediment: fate and ecological relevance. Biol. Fertil. Soils 45:219– 235.
45. Reference deleted.
46. Rippka, R. 1998. Isolation and purification of cyanobacteria. Methods En-zymol. 167:3–27.
47. Romanowski, G., M. G. Lorenz, and W. Wackernagel. 1991. Adsorption of plasmid DNA to mineral surfaces and protection against DNAase-1. Appl. Environ. Microbiol. 57:1057–1061.
48. Salmaso, N. 2010. Long-term phytoplankton community changes in a deep subalpine lake: response to nutrient availability and climatic fluctuations. Freshw. Biol. 55:825–846.
49. Schelble, R. T., J. A. Hall, and K. H. Nealson. 2008. DNA perseverance of microorganisms exposed to silica: an experimental study. Geobiology 6:503– 511.
50. Schober, E., and R. Kurmayer. 2006. Evaluation of different DNA sampling techniques for the application of the real-time PCR method for the quanti-fication of cyanobacteria in water. Lett. Appl. Microbiol. 42:412–417. 51. Scovhus, T. L., N. B. Ramsing, C. Holmstrom, S. Kjelleberg, and I. Dahllof.
2004. Real-time quantitative PCR for assessment of abundance of
Pseudo-alteromonas species in marine samples. Appl. Environ. Microbiol. 70:2373–
2382.
52. Reference deleted.
53. Tadonleke, R. D., J. Lazzarotto, O. Anneville, and J. C. Druart. 2009. Phytoplankton productivity increased in Lake Geneva despite phosphorus loading reduction. J. Plankton Res. 31:1179–1194.
54. Vaitomaa, J., et al. 2003. Quantitative real-time PCR for determination of microcystin synthetase E copy numbers for Microcystis and Anabaena in lakes. Appl. Environ. Microbiol. 69:7289–7297.
55. Van de Wyngaert, S., M. M. Salcher, J. Pernthaler, M. Zeder, and T. Posch. 2011. Quantitative dominance of seasonally persistent filamentous cyanobac-teria (Planktothrix rubescens) in the microbial assemblages of a temperate lake. Limnol. Oceanogr. 56:97–109.
56. Walsby, A. E., and F. Schanz. 2002. Light-dependent growth rate determines changes in the population of Planktothrix rubescens over the annual cycle in Lake Zurich, Switzerland. New Phytol. 154:671–687.
57. Wiedner, C., J. Rucker, and R. Bruggemann. 2007. Climate change affects timing and size of populations of an invasive cyanobacterium in temperate regions. Oceologia 152:473–484.