Analysis of a Top-Down Bottom-up Data Analysis Framework and
Software Architecture Design
by Anton Wirsch
B.S. Electronics Engineering Technology (1998) Brigham Young University
M.S. Computer Engineering (2004) California State University, Long Beach
Submitted to the System Design and Management Program in Partial Fulfillment of the Requirements for the Degree of
Master of Science in Engineering and Management ASSA CH NSTIL
at the
Massachusetts Institute of Technology
OCT
2
6 2016
May 2014SOy-,
Ili]LIBRARIES
2014 Anton Wirsch, All rights reserved
The author hereby grants to MIT permission to reproduce and to distribute publicly paper and electronic copies of this thesis document in whole or in part in any medium now known or
hereafter created. Signature of Author: Certified by: Approved by:
Signature redacted
U Anton WirschSystem Design and Management Program May, 2014
Signature redacted
Stuart Madnick John Norris Maguire (1960) Professor of Information Technology, MIT Sloan School of Management & Professor of E ring Systems, MIT School of Engineering
Signature redacted
Patrick Hale Director System Design and Management Program
An Analysis of a Top-Down Bottom-up Framework and Proof of Concept Software Architecture by
Anton Wirsch
Submitted to the System Design and Management Program in Partial Fulfillment of the Requirements for the Degree of Master of Science in Engineering and Management
1.1.1 Abstract
Data analytics is currently a topic that is popular in academia and in industry. This is one form of bottom-up analysis, where insights are gained by analyzing data. System dynamics is the
opposite, a top-down methodology, by gaining insight by analyzing the big picture. The merging of the two methodologies can possibly provide greater insight. What greater insight that can be gained is research that will be required in the future. The focus of this paper will be on the
software connections for such a framework and how it can be automated. An analysis of the individual parts of the combined framework will be conducted along with current software tools that may be used. Lastly, a proposed software architecture design will be described.
Table of Content
Abstract ... 2 Table of Content ... 3 1 Introduction ... 6 1. 1 M otivation ... 6 1.2 Fram ework ... 61.3 Software Architecture and Tools ... 6
1.4 System Dynam ics and Data M ining ... 7
1.5 Purpose ... 7
1.6 Summ ary of Chapters ... 8
2 Top-Down Bottom -up Overview ... 8
2.1 Bottom -up ... 8
2. 1.1 Overview ... 8
2.1.2 Data M ining, M achine Learning ... 9
2.1.3 Data M ining Flow ... 11
2.2 Top-down ... 13
2.2.1 Overview ... 13
2.2.2 System Dynam ics ... 13
2.2.3 System Dynam ics M odel Creation M ethod ... 14
2.2.4 M odel Components ... 16
2.2.5 Inform ation on Creating M odels ... 18
2.2.6 Tim e ... 18
3 Top-Down Bottom -Up Framework Analysis ... 19
3.1 Overview ... 19
3.2 England Riots ... 20
3.3 Forecasting ... 21
3.4 Fram ework Uses ... 22
3.5 Bottom -up Data Sources ... 22
3.6 M ultiple M odels ... 23
3.8 Framework Data Flow ... 27
3.9 Analysis... 29
3.9.1 System Dynamics M odel Creation ... 30
3.9.2 Variable Relationships... 31
3.9.3 Top-down Bottom-up Interface ... 31
3.9.4 System Dynamics Output Variables ... 32
3.9.5 Automated Support for Validation and Tracking Model Forecasts vs. Actual Outcomes (Box 2)... 32
3.9.6 Feedback ... 33
3.9.7 Automated Support for Comparing, Tracking & Balancing Effectiveness of Multiple M odels (Box 3)... 33
3.9.8 Automated Support for Model Parameter Calibration, Recalibration and Validation for M ultiple Locales & Situations (Boxi)... 34
3.9.9 Crowd Sourcing for Expert Opinion (Bottom-Up Output)... 35
3.9.10 Automated Support for Sensitivity Analysis to Infer Behavior Modes and Data Values to be M onitored (Box 4) ... 35
3.9.11 Controller ... 36
3.10 Framework Analysis M odifications... 36
3.11 M odifications ... 37
3.12 Riot Example ... 38
4 Top-Down and Bottom-Up Software Tools ... 41
4.1 System Dynamic Tools... 42
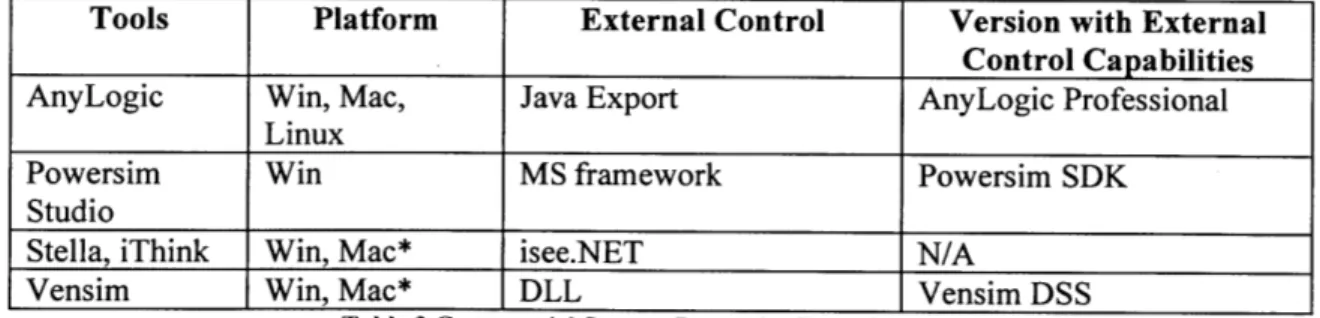
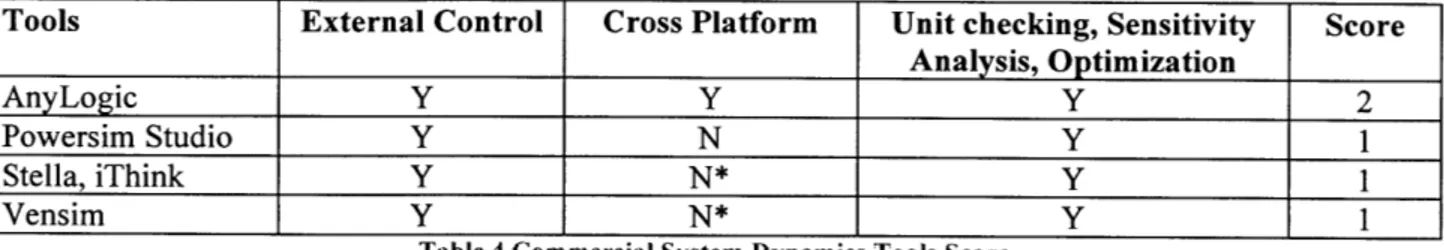
4.1.1 Commercial System Dynamics Tools... 42
4.1.2 Commercial System Dynamics Summary ... 44
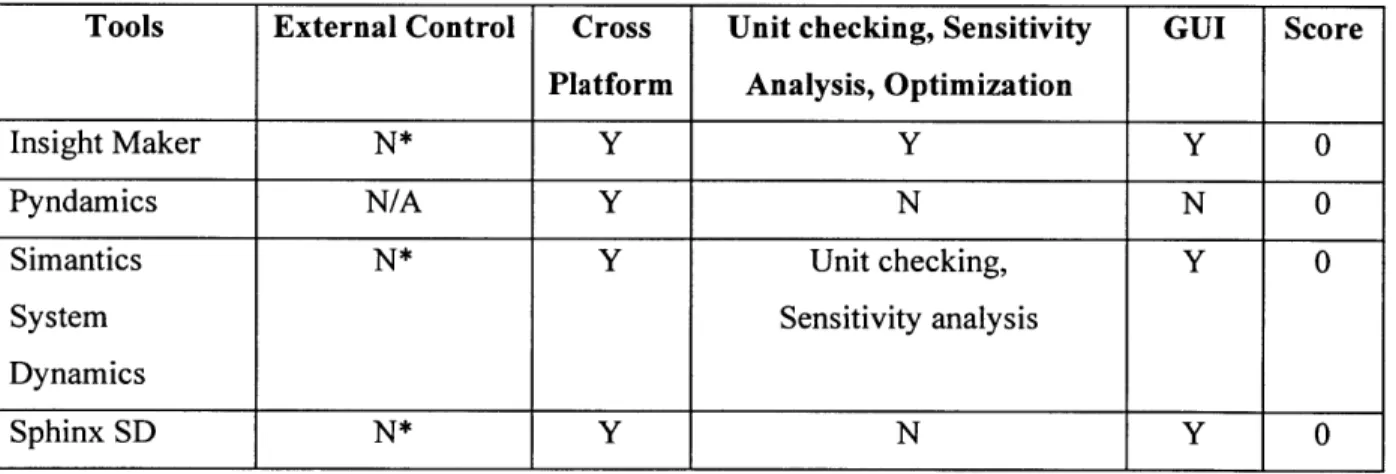
4.1.3 Open Source System Dynamics Tools... 45
4.1.4 Open Source Tools Summary ... 46
4.1.5 XM ILE System Dynamics Standard... 47
4.1.6 Other M odeling Tools... 48
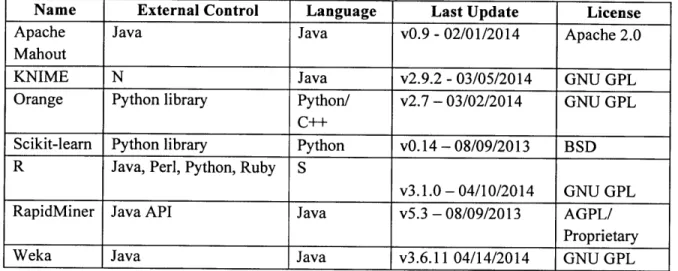
4.2 Data M ining Tools ... 49
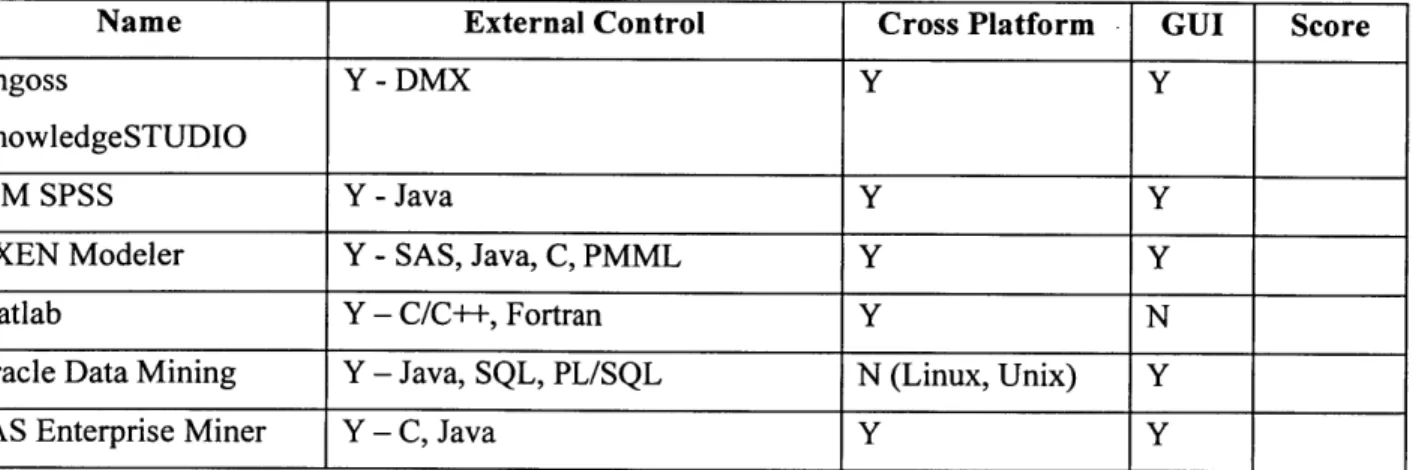
4.2.1 Commercial Data M ining Tool... 49
4.2.3 Open Source D ata M ining Tools ... 52
4.2.4 Open Source Data Mining Tools Summary and Score... 54
4.2.5 PM M L D ata M ining Standard ... 55
4.2.6 D ata M ining Softw are Tool Ranking ... 55
4.2.7 Candidate Tools ... 58
5 Top-D ow n Bottom -Up Softw are Architecture ... 58
5.1 Previous Softw are Im plem entations ... 59
5.2 Softw are Im plem entation... 60
5.2.1 TD/BU Connection... 61
5.2.2 Python Tools ... 61
5.3 Conceptual V iew ... 64
5.4 Softw are A rchitecture ... 66
5.5 A lternative A rchitectures ... 67
5.5.1 Python Im plem entation... 67
5.5.2 Java Im plem entation... 67
5.5.3 Stella, iThink, and Pow ersim ... 68
6 Conclusion ... 68
2 Introduction
2.1 Motivation
In recent years the amount of data that is being generated by people and machines have greatly increased. Buzzwords such as Big Data, Internet of Things, and Machine-to-Machine
Communication are commonly heard in mainstream media and indicate how prevalent the topic is. The potential benefit from vast amounts of data is that greater knowledge may be gained by analyzing the data. This type of analysis is a bottom-up approach and many organizations are implementing this approach. A top-down approach starts from general principles and works down to develop models of a process. This thesis investigates an architecture that combines the bottom-up approach with a top-down approach and reviews software tools that can realize the combined architecture.
2.2 Framework
A proposed framework of the combined methodologies has been provided, which will be discussed in detail in chapter 3. The framework consists of a top-down module and a bottom-up module along with connections between the two and other blocks. The framework will be analyzed to determine which portions of the proposed framework are applicable and which are not, as well as which portions are capable of automation. The resulting framework will then be used to design a software architecture that can be used to construct the framework.
2.3 Software Architecture and Tools
After the analysis of the top-down bottom-up framework, the resulting framework will then be used to design a software architecture. Existing data mining and system dynamics tools will be leveraged to propose a software implantation of the software architecture. The feature set and automation capabilities of data mining and system dynamics tools will be analyzed to determine which of the tools are applicable to the software implementation.
2.4 System Dynamics and Data Mining
System dynamics and data mining are implementations of top-down and bottom-up approaches respectively. Both are heavily used in business. One example of data mining in business is determining which subset of potential customers to advertise to. A company can analyze their database of customers to determine which types of people are the most common. Knowing this the company can target those types of people for advertisement instead of covering all types. System dynamics is often used to model the policies of a corporation. A simple example will be modifying the inventory policy of a corporation. Various inventory policies can be simulated to see how the change will effect inventory and the overall supply chain over a set period of time. A system dynamics model can be packaged as a "flight simulator" to allow managers to experiment with adjusting parameters and policies and seeing how the system behaves.
The operational methods of the two systems differ. Data mining is used in a live setting where new data is processed on a continuous basis. It is also usually highly automated where there is little to no human interaction required to operate the data mining system. The main use case for system dynamics on the other hand, is for an interactive simulation test environment. A user can set various parameters of the model and then execute a simulation to produce a time-series output. The combined framework and resulting software architecture will be the combination of the two. The framework will operate as an automated system, conduct simulations, and produce
a time-series output at a predetermined time interval.
2.5 Purpose
While data mining and system dynamics are used in business the combined framework as described here, will not be used for business use. Instead the use case will be to monitor and forecast various events that occur throughout the world. Another use case is to analyze historical events to help understand the important factors of the event. Riots are an example of an event. They occur frequently throughout the world and cause significant damage to a city such as the 2011 England riots.
The goal in this example is to see if the combined framework can forecast a riot. This will allow authorities to allocate resources and take action to help prevent the riot or prepare for the riot. Years of research will be required to test this theory. This thesis will provide the framework and software architecture to enable the start of the research.
2.6 Summary of Chapters
Chapter 2 will provide an overview of data mining and system dynamics. It will cover their strengths and limitations as well as the process to implement both methods.
Chapter 3 will analyze a framework that incorporates top-down and bottom-up methods. It will go over the various parts of the framework and any modifications that were made.
Chapter 4 will explore the software tools that are available data mining and system dynamics. A number of commercial and open source tools will be analyzed for their feature set for use in the software architecture.
Chapter 5 will discuss the software architecture and data mining and system dynamics tools that can be used for the construction of the software architecture.
Chapter 6 will provide a summary of the thesis.
3 Top-Down Bottom-up Overview
3.1 Bottom-up
3.1.1 Overview
Bottom-up (BU) analysis consists of analyzing various forms of data, such as numbers, text, images, video, voice, etc. in order to find relationships and patterns to gain knowledge from the data. Bottom-up analysis has experienced tremendous growth over the years. This type of analysis has spread to a number of sectors including finance, business, law enforcement, and defense to name a few. Data mining, machine learning, and big data are commonly
representatives of bottom-up analysis. This thesis will focus on the use of data mining when referring to bottom-up analysis.
3.1.2 Data Mining, Machine Learning
"Data mining is the process of exploration and analysis, by automatic or semi-automatic means, of large quantities of data in order to discover meaningful patterns and rules."[1]
The above quote provides a simple explanation to data mining. It is a system where data is gathered, stored, and then analyzed in an automated method.
One business case example of data mining is to determine if a person will apply for a credit card if provided an advertisement for a card. To understand what types of people are likely to apply for a credit card, credit card companies store attributes of each person that has joined. The attributes can include age, gender, occupation, income, marital status, home address, etc. A number of analytical methods can be used to determine what combination of attributes that a person has will likely apply for their credit card. This analysis portion is where machine learning is implemented. Past data is used to help create an algorithm that learns what combinations provide the highest probability that a person will apply for a credit card. The learned algorithm is called a fit algorithm. Once the fit algorithm has been developed it is used within a data mining system for live operation. Returning to the example, instead of mailing millions of random people credit card applications, a data mining system can parse through a database of noncredit card holders and test the attributes of each person against the fit algorithm. Those that are determined to likely apply for credit cards can be the recipients of a credit card application.
Machine learning is a method for learning from data in an automated fashion. The task of determining if an email is spam or not will be used as an example to explain machine learning further. A program or model, which contains a number of parameters, can learn if an email is spam or not through repeated exposure to spam email and nonspam email. Each exposure will adjust parameters to improve performance. This is an automate process where model itself is adjusting parameter to improve performance. Once the performance is at an acceptable level the model is considered fit. This thesis will refer to this fit model as the data mining model.
The main algorithms used for machine learning are classification, clustering, regression or prediction, and association rule. For classification, the goal is to classify something to a
predetermined set of categories. For example if a person is provided an advertisement for a credit card, will the person be likely to sign up or not. Only two possibilities exist for this case.
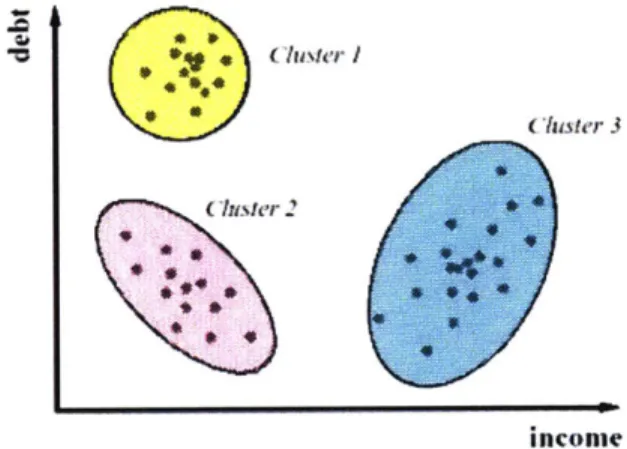
Clustering will group data into similar categories where the number of categories has not been predetermined. Data points, often referred to as records, that are similar are grouped together. A business example of clustering is comparing the amount of income and debt of a set people.
Points that are close to each other will be clustered. The figure below shows a plot of the points and the resulting three clusters.
ncomle
Figure I Cluster Example |21Regression will predict a value, such as the price of a house depending on attributes such as the
age of the house, number of rooms, neighborhood, etc. By analyzing the price of houses along with their attributes that have sold over the years a model can be created. The model can then be
used to predict what the price of a house would sell for based on the attributes of the house.
Lastly, association rule determines what objects are usually associated with each other. Super
markets are interested in this type of data. They are interested in knowing what other items are
usually purchased with hotdogs.
These four categories fall into two general groups supervised learning and unsupervised learning. Supervised learning, which includes classification and regression algorithms provide feedback. If a classification of a record is correct or incorrect the feedback can be used for learning.
Unsupervised learning, which includes clustering and association rule do not provide any feedback. Therefore learning cannot be gained by processing historical data. For example, clustering will group similar data points but since there is no predetermined number of classification to fall into there is no feedback to learn if the clusters are correct or not.
Each of the four categories can be implemented through a number of algorithms. For example classification is possible through decision trees, neural nets, Bayesian classifiers, and Support Vector Machines to list just a few. When a classification machine learning model is being constructed a number of algorithms will be tested to see which will perform the best. The same process is conducted with the other categories as well.
3.1.3 Data Mining Flow
The flow for data mining is described below.
Step1: Develop an understanding of the purpose of the data mining project. Is the purpose a one time effort or will it deal with executing countless times.
Step 2: Obtain the dataset to be used in the analysis. If the amount of data is extremely large then it may sufficient to randomly sample a portion of the data. A thousand records is usually enough for creating a model [3]. Data may need to be queried from multiple databases internally and externally.
Step 3: Explore, clean, and preprocess the data. Data may be plentiful but often it is not clean. Missing records from a dataset is common. A decision must be made on how to handle missing data. It can be ignored or averaged between the surrounding records. Incorrect data is also common. For this case obviously incorrect data can be checked for. For example if the expected value of a record is between two values and the record is outside the range then this record holds incorrect data an can be ignored.
Step 4: Reduce and separate the variables. Not all variables may be needed. At this step variables that are not required are removed from analysis. The more variables are included the more CPU
time will be required for processing. Therefore it is ideal to keep the number of variables as low as possible. For example, assume that a house has 20 attributes. If all 20 attributes are used to create a fit model then the fit model will have to use all 20 attributes for each record it processes. If the same or slightly less accurate fit model can be created with only 5 attributes then the CPU load will be considerably less.
Also, some variables will need to be modified or transformed. For example if a variable is the age of a person the resolution may be too fine. It may be easier to analyze if a number of age ranges were used instead.
Lastly when supervised training will be used the data should be split into three groups training, validation, and test. The training set is used to train a model. Once it is trained the validation and test set will be used to see how it performs with a different set of data.
Step 5: Choose the data mining task (regression, clustering).
Step 6: Use algorithms to perform the task. This will usually take many attempts. Various combinations of variables as well as multiple variants of the same algorithm will be tested. Promising algorithms can be tested with the validation dataset to see how it performs against a fresh set of data.
Step 7: Interpret the results of the algorithms. An algorithm from one of the many tested in step 6 needs to be chosen. The chosen algorithm should also be tested against the test dataset to see how it performs with yet another set of new data. At this point the algorithm has been fitted for the task at hand.
Step 8: The fit algorithm is integrated to the system for use with real data. The system will execute the fit algorithm against the new records to make a determination such as what
classification or clustering does the record belong to or what is the resulting numerical value, or what is the record associated with. Appropriate action for each possible outcome must then be taken.
3.2 Top-down
3.2.1 Overview
While bottom-up analyzes data to uncover patterns, a top-down method approaches a problem from the high level view a system. For example, in a bottom-up business example a company will look at sales and customer data to extract any patterns. A top-down approach could model a corporation and its strategy. Who are the target customers? What is the supply chain? What is the marketing? How are the departments divided? What are the corporate sales policies? How are
sales team incentivized? There are external factors that also need to be considered in this
example such as competition from other companies and the overall economy. If all the divisions of the company are not aligned with the corporate strategy then it will be easy to understand that the target sales and customer reach will not be optimal. By starting from the top and then
deconstructing the parts and understanding the interactions between the parts one can gain an understanding of what type of customers can be reached and attracted. This thesis will focus on system dynamics (SD) as the implementation of top-down analysis.
3.2.2 System Dynamics
Jay Forrester, who was a professor in the school of management at MIT, developed system dynamics in the 1950s [4]. System dynamics models complex systems and observes the behavior of the model over a period of time. The observations are conducting by executing simulations of the model and visually viewing the output through graphs and charts. Complex systems, where the aggregate relationships among multiple nodes are difficult to understand, are the type of systems that are suited for system dynamics. The strength of system dynamics is discovering relationships within the model that are not obvious. Simulations that are run on the model show how the relationships among nodes affect each other over a period of time [5].
One of the first implementation of SD was with one group in GE. They observed wild
fluctuations on orders of a particular household appliance. At one point they may be backlogged on large orders and at other times there would be little orders with much of the staff having nothing to do. Forrester was asked to solve the problem and he did so using system dynamics. He found that by modeling the management policy there was a long delay from when retailers put in their orders to when they would receive the product. Retailers anxious for their orders to arrive would pile on more orders. As the order went through the supply chain each step in the chain anticipated an increase in demand and would add more to the order, which eventually became increasingly inflated by the time it reached GE. As the retailers received their orders their supply soon surpassed demand leading to no orders, which would then again propagate through the supply channel. This was the basis of the cyclical orders [6].
The above example shows how system dynamics can be used to explain puzzling issues of a corporation. In this case the issue was not with one particular department but with the overall ordering system. Also note that the retailer and throughout the supply chain the actual order was not placed but additional orders were added. Orders were inflated because higher orders were
anticipated. Enough people in the whole chain held the same belief and acted on it, which
contributed to the phenomenon. These beliefs cannot be measured directly, but certainly affected the system. The beliefs that individuals hold in aggregate across a population are referred to as narratives. System dynamics is also able to include these unmeasurable concepts within a model. This capability separates system dynamics from data mining and other forms of bottom-up methodologies.
3.2.3 System Dynamics Model Creation Method
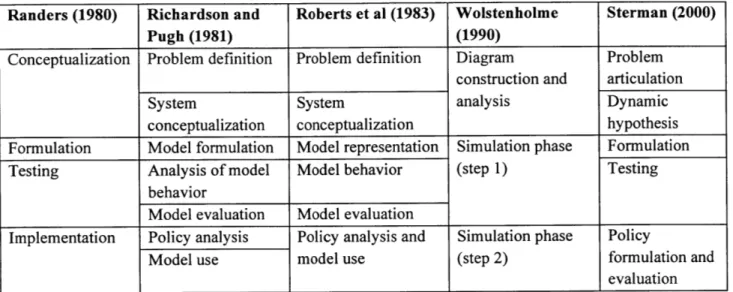
There are a number of current prominent thinkers in SD among them are Randers, Richardson and Pugh, Roberts et al., Wolstenholme, and Sterman. Each has defined a flow for creating a SD model.
Randers (1980) Richardson and Roberts et al (1983) Wolstenholme Sterman (2000)
Pugh (1981) (1990)
Conceptualization Problem definition Problem definition Diagram Problem
construction and articulation
System System analysis Dynamic
conceptualization conceptualization hypothesis
Formulation Model formulation Model representation Simulation phase Formulation
Testing Analysis of model Model behavior (step 1) Testing
behavior
Model evaluation Model evaluation
Implementation Policy analysis Policy analysis and Simulation phase Policy
Model use model use (step 2) formulation and
evaluation
Table 1 Prominent System Dynamics Leaders' Modeling Processes 171
Further details of the process proposed by Sterman are explained below.
Problem Articulation
The first step in designing a model is to set the bounds. What is the problem or question that
needs to be solved? The bounds should be set enough to model the problem. What should be
avoided is setting no bounds and attempt to model an all-encompassing system. This will lead to
a complex model that may never properly function correctly [8].
Dynamic Hypothesis
At this stage hypotheses for the problem can be entertained. What variables will be required for
the hypothesis? Variables fall into three categories: endogenous, exogenous, and excluded [9]. Endogenous variables are variables that are within the boundary of the problem. Exogenous
variables are variables that are outside of the boundary. In general there should be very few
exogenous variables used. Lastly, excluded variables are variables that are not used since they
have little to no affect the outcome of a model.
Formulation
Testing
Testing and Formulation are an iterative process. The first test is to verify that the behavior of the model is matching with expected behavior. Many iterations of testing and modifying the model is usually required before the model behaves properly.
Another aspect of testing is ensuring units consistency. As the model is being constructed, each node will have an equation associated with it. Units in the equations should match. If a stock has three other nodes as inputs then the three nodes should have the same units. Software tools will usually have a feature to check for unit consistency.
Sensitivity analysis is another check that needs to be done. The purpose is to see how sensitive the model is to changes to the input. Monte Carlo is the usual method to test for sensitivity and is again a feature that is regularly included in system dynamics software tools.
Sterman stated that an important test that is often missed is reality tests. These are done by testing extreme cases even though the cases will never occur. The purpose is to ensure that the model is following basic reality and by testing extreme conditions the outcome should be
obvious [10]. For example if an infectious disease model was created and the population was set to zero then the infected population should be zero, not a positive or negative value.
Policy formulation and evaluation
After testing has completed the model is ready to be deployed. In many cases system dynamics models are used as an environment to test ideas and scenarios. This type of usage is referred to as a flight simulator. In the business field different operational policies can be tested and evaluated before any are actually implemented.
3.2.4 Model Components
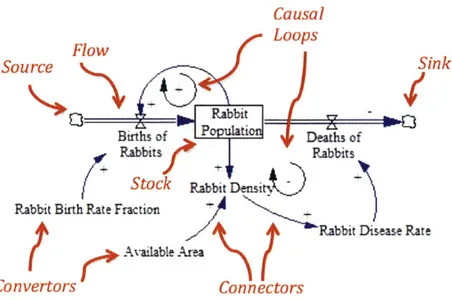
System Dynamics models are composed of stocks, flows, convertors, connectors, sources, and sinks. Each component will be briefly explained. The below figure is a simple rabbit population model. The components of the model are indicated in red text. The example model will be referenced in each component explanation.
Causal Flow Loops Source - Sink Br Pc ulaticn Deaths of Rabbits 1 Rabbits Stock Rabbit Dns t.)
Rabbit Birth Rat e Fraction
Rabbit Disease Rate
Convertors cunnectors
Figure 2 Rabbit Population Model I II Stocks
Stocks represent objects or ideas that can build up. A bathtub is a common example. Water can be added to the bathtub and the level of water indicates the stock of water. In the example model the Rabbit Population is stock. The rabbit population can increase or decease.
Flows
Flows are rates that affect the inflow or outflow of stocks. Using the bathtub example again, the rate at which the bathtub fills will be a flow and the rate at which the bathtub drains will be another flow. In the example model, Birth of Rabbits is an inflow and Deaths of Rabbits is an outflow.
Convertors
Convertors are variables that are neither stocks nor flows. They can be variables that are at the edge of the system boundary and only have an output. They can also be intermediate variables. In the example model Rabbit Birth Rate Fraction and Available Area and Rabbit Density are
convertors. Notice that Rabbit Birth Rate Fraction and Available Area only have outputs. These are the boundary variables. Rabbit Density is an intermediate variable since it has inputs and an output.
Connectors
Connectors connect convertors to other convertors or are connected from stocks or flows.
Source and Sinks
Source and sinks are stocks that are outside the boundary of the model. In the example model
Births of Rabbits comes from a source and Deaths of Rabbits goes to a sink.
Causal Loops
As explained previously, system dynamics models are made up of six components. The
connectors and flows define the relationships between the components. These relationships will
contain loops. There are two types of loops, positive or reinforcing loops and negative or
balancing loops. In the example model the Birth Rate of Rabbits will increase the stock of
rabbits. The increase in Rabbit Population will then increase the Birth Rate of Rabbits. Both are
reinforcing each other. On the other end the greater the Rabbit Population the greater the Density
of Rabbits, which will increase the Disease Rate among rabbits. This will increase the Death
Rate of Rabbits, which will decrease the Rabbit Population. This is a balancing loop since the
greater the population the larger the rate of rabbit deaths will occur.
3.2.5 Information on Creating Models
Model creation is not a straightforward process. According to Sterman a mixture of quantitative
and qualitative data is required to create a model [12]. Qualitative data often exist as a mental
model of the modeler. Converting qualitative data to a quantifiable expression requires
experience. When the modeler is not the domain expert and does not hold the qualitative data, domain experts will be required. With the inclusion of qualitative data, model creation becomes a nontrivial exercise. Expertise is required. However once a model has been created, using it and experimenting with values can be done by anyone with some tutorial.
3.2.6 Time
One difference between data mining and system dynamic models is that system dynamic models all have a time aspect. Simulations are executed with a predetermined time step. The time step is
repeated until a predetermined number of time steps have passed. The simulation will result in a time-series output. The stocks in the model will usually have a different value from the start of the simulations to the end of the simulation. In the example model the rabbit population will change over time. Data mining can deal with time series data, but the majority of data mining model have no relations to continuous time.
4 Top-Down Bottom-Up Framework Analysis
4.1 Overview
To create a software architecture that will implement top-down and bottom-up methodologies a framework of how the system is connected is first required. Instead of creating a framework from scratch a proposed framework produced by Allen Moulton, a research scientist at the MIT Sloan School of Management, will be analyzed. Once the analysis is completed and modifications to the framework made the software architecture can then be designed.
For this analysis, the end goal is to create an automated framework in which the system is able to execute with minimal intervention by the operator. The below figure is the proposed base
framework to be analyzed. Each part of the framework will be analyzed for feasibility and automation. The framework consists of two main modules, the top-down module in the upper right and the bottom-up module in the lower left. The top-down module will consist of a system
dynamics model. This will execute a simulation and produce a time-series output. The bottom-up module will consist of a data mining model to provide input to the system dynamics model.
Concept of
O
Combining Top-Down Bottom-Up Data AnalyAutomated support for model parameter calibration, recalibration and validation for
multiple locales & situations
-7
Bott
an
fro
erations for Technology Systems Architecture
Systems Models with Top-Down Holistic Theory-Based System Modeltics Example: Dissident and Insurgent Escalation
Conditions accumulate
Box 1 enabling event trigge
Interpretations of
Time-Varying Model
Behavior Estimates
0 Automated Support for
Box 2 Validation and Tracking
Model Forecasts
vs. Actual Outcomes
Box 3 Automated Support for
Comparing, Tracking & Balancing Effectiveness
of Multiple Models
_Q Box 4 Automated Support for
om-U Dat alyicsSensitivity Analysis to Infer
om-Up Data AnalyticsBeairMdsndDt
d Machine-Learning Behavior Modes and Data
m Multi-source Data Values to be Monitored
Figure 3 Pioposed Top-I)uoN n Bottom-[ p FUramewN ork 4.2 England Riots
An example that will be used throughout the section is the 2011 England riots in which a series of riots erupted throughout England over a period of five days. The origin of the riots is with the fatal shooting of Mark Duggan, who was unarmed, by police. An accurate account of the
shooting is still elusive, as facts of the incident have changed over time. A special police unit investigating gun crime in a black community stopped a mini cab that Duggan was in. Initial reports indicated that Duggan had exited the cab with a gun in hand, but later it was known that Duggan was unarmed when police fired upon him. The killing of an unarmed man brought protesters to the streets of Tottenham on August 6. The protest later developed into a riot where looting and arson occurred. Other riots emerged throughout England for the following five days [13].
20
-4.3 Forecasting
One of the functions of the framework is to monitor an ongoing event such as protests that can
lead to riots. This functionality will be referred to as the monitoring system. The proposed
monitoring system has a different use case than a typical system dynamics model. Although it is
possible to simulate at a yearly or greater interval, this monitoring system is focused to simulate
for shorter time periods such as days. weeks, or possibly months. The purpose of the monitoring
system is to monitor a currently evolving event such as protests or riots, which has a timescale
from hours to days. As the event under monitor continues, data regarding the event will be
gathered and become an input to the monitoring system, which can then execute a simulation to
generate a forecast of how the current event will progress. This process will be repeated at
intervals until the event had completed.
This system is analogous to hurricane weather forecasting. Climatologists gather atmospheric
data and conduct simulations to predict the path of a hurricane based on the theory of how
hurricanes develop. The forecast is reliable for the near future but as forecast goes beyond the
near future the forecast becomes less reliable as shown in the below figure. As time progresses.
they are able to collect further data and continuously update the forecast. The goal of the
monitoring framework is to do the same for events. Once an event has been identified data
regarding the event will be gathered and forecasts will be generated and regularly updated in an
automated fashion. 2 2AM Mon. AM Sun N
4.4 Framework Uses
As stated previously one of the functions of the framework is to monitor an ongoing event. The purpose of the monitoring framework is to produce a forecast so that authorities can best allocate resources for actions that can reduce the possibility of an event worsening such as a protest
evolving to a riot, or to prepare for the forecasted worsening event such as a riot. An additional use case is for simulating historical events. There are a number of uses for using historical events. One can be training sessions for actual events. Mock events can be created and be executed as if the event was occurring in real time. The second is to further improve the system and develop best practices.
4.5 Bottom-up Data Sources
Any data source that is accessible can be used for the bottom-up module. Social media sites such as Twitter, Facebook, and Google Plus are sources where the general public generates data. Of particular interest is Twitter, which allows users to post images or text message that are 140 characters or less. The users are any individual or organization that have created an account. Twitter is often the fist site where news is reported. Frequently news is posted to Twitter by individuals who are at the scene of an event. As of January 1 2014 Twitter has 645,750,000 active registered accounts [15]. The large user base provides a favorable probability that an event of interest will be covered through Twitter. The data that can be gathered from Twitter a user posts vary include posted message, location, time of post, author, author followers, and author prominence (how many accounts are following the author). Information that can be gained from the posted message can vary from personal opinion, location, keyword, ect.
During and before the England riots erupted a large volume of Twitter posts were generated. The posts included user's narrative of the government, for or against. Gathering these types of posts over a period of time allows monitoring the growth of particular narratives. User location is also useful. If a number of posts are coming from a particular location then it indicates that a
Another database that can be referenced is GDELT, which is an open database of events that occur throughout the world and covers over 300 categories staring [16]. The database covers over three decades starting from 1979 and is updated daily.
A formal description of GDELT is described in the following quote. "The Global Database of Events, Language, and Tone (GDELT) is an initiative to construct a catalog of human societal-scale behavior and beliefs across all countries of the world, connecting every person,
organization, location, count, theme, news source, and event across the planet into a single massive network that captures what's happening around the world, what its context is and who's involved, and how the world is feeling about it, every single day." [17]
GDELT records the event type, dates, locations, and prominent actors of an event. The resolution of the location may vary from country level down to the city level. The actors will not be an individual name but rather a classification such as resident, farmer, company, or even country names. The database include events such as protests, riots, military or police power, etc. GDELT has provided the complete database so that it can be downloaded and installed to a relational database. They also provide example SQL scripts to create the database tables and to import the data into a relational database.
4.6 Multiple Models
As stated previously the framework consists of a top-down module, which is implemented using a system dynamics model. In actuality the framework is able to support multiple top-down implementations and instantiations. For example two different system dynamics models may be placed in the top-down module. The modeler may have multiple ideas on how to model an event. Instead of having to decide on one method multiple models can be created to see which performs best. System dynamics is one implementation of a top-down module. Other implementations methods are also possible such as agent-based models. For each top-down instantiation a matching bottom-up instantiation will be required.
4.7 Description of Monitoring Framework
A brief explanation of each part of the proposed framework of figure 2 is provided below. To assist in identifying the portion under explanation a miniature version of figure 2 is provided with the portion under explanation highlighted. Further details of the framework will be discussed in the analysis section.
Bottom-Up Module
The bottom left box represents the bottom-up module. This box will gather data, clean, and process data. A data mining model will be at the core of the module.
Bottom-Up Outputs
As data is gathered it will be processed through the model in the data mining module. The output of the processed data will then be passed to the top down module.
Crowd Sourced Expert Opinion
Technica Arp,- &t Conct 0** wv
When monitoring an event it is advantageous to be able gain the opinion of experts in the domain. This output represents expert opinion that has been gathered by some means.
Monitor Data Streams
This is data that passes through the data analysis block. The data is cleaned, formatted and passed to the top-down block for its input. This data is not processed through the data mining model.
Top-Down Module
---
-
The upper right box is the top-down module. System dynamics models will be the main implementation method for this module. This module will execute a simulation and generate a time-series output.
Automated Support for Model Parameter Calibration (Box 1)
System dynamic models require calibration of parameters. When a data mining or system dynamic model is created many times they are created to a specific locale. For example a model of a riot in England may not have the same dynamics as a riot in the US. The purpose of this module is to automatically recalibrate the system dynamics model to different locales.
Automated Support for Validation and Tracking Model Forecasts vs. Actual Outcomes (Box2)
To observe how accurate the system is, the time-series forecasts generated from the system dynamics models will be compared against actual outcomes.
Automated Support for Comparing, Tracking & Balancing Multiple Models (Box 3)
A system dynamics model is one method to implement a top-down module. The framework though is not limited to one implementation and one model. Multiple models in parallel can be represented. This module will determine which of the model is performing the best.
Automated Support for Sensitivity Analysis (Box 4)
Once a system dynamics model is created it is useful to know how sensitive the output is to changes in the input. This module will automatically conduct sensitivity analysis on the system dynamics model.
4.8 Framework Data Flow
The basic data flow of the monitoring framework will be explained. The first step starts with the bottom-up module. Data will be gathered, cleaned, and processed through the data mining model. The output will be passed to the top-down module. The system dynamics model will then take the output data from the bottom-up module and start a simulation and generate a time-series forecast. This process will be repeated at a predetermined interval. At each interval the generated forecast will be compared with actual data to determine how accurate the model is behaving.
Multiple instances of this system is also possible. For example there may be four instances of a bottom-up and top-down module in parallel. The event that is being monitored will be the same, but there will be four different bottom-up and top-down models for each set. Each cycle will produce four forecasts and the model that is performing the best can be determined as the event evolves.
The figure below is a timing chart of the data flow. Each time step is split in two, "a" and "b", to clarify the order of execution within a time step. Actions that occur in the "a" time step are execute at the beginning of the time step, while actions that occur in the "b" time step execute after "a". For example time step tO, has tOa and tOb. Actions in tOa execute at the beginning of time step 0 and tOb executes after tOa and for the duration of the time step. Notice that the forecasts are generated by the TD module and at the start of a time step. Forecasts are generated using data from the previous time step. For example in time step tl a the TD module will generate a forecast for that time step and additional future time steps. The input data that the TD module used to generate the forecast was from the previous time step to.
Cycles Modules t < t< Ob tOa tOb tha t1b t2a t2b
Oa
Gather BU data for St t<O TD Generate forecast for to, 11 Gather BU data for to Compare to 2"d forecast wvith Cycle actual tO TD data Geierate forecast forti. t2. Gather BU data forti
Compare tl forecast , rd with Cycle wt actual t1 TD data Generate forecast for t12 t3. 14... hle 2 Frmew'or K Data Flo TimingL2 Chart4.9 Analysis
The parts of the framework will be analyzed for functionality and automation capability. The
order of analysis will be system dynamics model creation, top-down and bottom-up interface, box 2, box 3, box 1, and box 4. The connections between the modules and boxes will be
discussed throughout the section. The top-down module will first analyze model creation, which
6 29
will include generating a pool of potential variables, variable relationships, and bottom-up data interface.
4.9.1 System Dynamics Model Creation
The steps for creating a system dynamics model was briefly explained in section 2.
Unfortunately, creating system dynamics model is not an easy task. There is considerable skill and experience required as expressed in the below statement from Richardson.
"Understanding connections between complex model structure and behavior comes, if one is skillful and/or lucky, after a prolonged series of model tests of deepening sophistication and insight."[18]
One of the reasons that an experienced modeler is required is the source of the data used for modeling. Forrester stated that the largest pool of information used in creating a system dynamics model is the mental database that the modeler holds [19].
The mental model is the database that has traditionally been accessed first when considering possible variables. These variables may be different from one modeler to another since each will hold different mental models. However, statistical analysis and automated tools can be used to assist the designer.
One proposal to provide less variation in the pool of variables is to analyze historical data of similar events. Frequency analysis can be conducted on the words of the news articles. The resulting histogram will provide a list of words that were used in the news articles. The words with the highest counts can be the starting point for variable selection. Google and individual news websites can be a source of the news articles. Another database that can be referenced is GDELT where event dates can be found.
Knowing event dates will help against collecting false positive articles. One step above frequency analysis of words used in news articles to start variable selection is to use natural language processing to extract semantics. This will add additional words that were not included
in news articles. The Predictive Analysis Today website listed SAS Text Analytics, IBM Text Analytics, and SAP Text Analytics as the top three choices for natural language processing [20].
This process of querying databases and analyzing news articles for variable selection can be automated. This will be a useful tool for the system dynamics modeler as it can be used anytime a model needs to be created.
4.9.2 Variable Relationships
The next step after generating a pool of variables is to identify the relationships among the variables. This again relies on the modeler's mental model and experience. Although there are statistical methods, that can be automated, to help identify relationships the use case is limited. For example Medina-Borja and Pasupathy have shown that a machine learning decision tree algorithm can be used to reveal relationships [21]. This will help the modeler create flows and connections between variables. However, their method requires survey data results in which all participants answers the same set of questions. It is possible to automate an online survey but the more difficult task is to get people to participate in a survey.
4.9.3 Top-down Bottom-up Interface
The interface between the data mining block and the system dynamic model needs to be defined. The data mining block provides values to the system dynamic model. Therefore, it is first
necessary to know what the system dynamic model inputs are. Looking back at Sterman's system dynamics model process, the dynamic hypothesis step requires identifying endogenous, exogenous, and excluded variables. Endogenous variables are variables that are within the bounds of the system dynamic models. Within endogenous variable are three categories of variables. The first is boundary variables, which are convertors. These variables that only
provide an output are typically placed at the outskirts of a model since they do not take an input. The second is internal variables. These are variables that are conceptual variables that are difficult to measure such as quality of work. Lastly are output variables. These are the stocks in the model. Stocks are accumulations within a model, but it does not necessarily mean that stocks are measureable in the real world. For this framework stocks that are measureable in the real
world is required. Measureable output allows for comparison between generated data and actual data.
The boundary variables are the variables that will interface with the bottom-up module. Certain criteria need to be met for these variables. Data that is required for the boundary variables must be obtainable from the bottom-up module. Either the raw data is collected by the bottom-up module, cleaned, and processed through the data mining model or simply passed on. The
boundary variable should be available from the bottom-up module at every time step. The range of values the boundary value expects and what the data mining model can produce must match.
4.9.4 System Dynamics Output Variables
The system dynamics model will produce a time-series output. The output variable must be a measurable variable that can be compared with actual data. To verify if the developed system dynamics model behaves properly simulations with historical data can be used. When in
monitoring mode the forecast output will be compared with actual data. Therefore it is required that the chosen output variable of the system dynamics model also be collectable from the bottom-up module. The collected data should be the actual data that will be compared with the system dynamics output. The collected data should not require prediction or categorization through a data mining model since data mining models are rarely 100% accurate.
4.9.5 Automated Support for Validation and Tracking Model Forecasts vs. Actual Outcomes (Box 2)
As explained previously forecasts are generated at the beginning of a time step for the current time step and beyond. Referring to table 2 the forecast for time step ti is generated at the
beginning of the state using data from time step tO. The generated forecast is for the current time step tl, t2, and t3. How far in to the future a forecast is generated for is determined by the user of the system.
Table 2 also shows that before the current forecast is generated, a comparison of the previous forecast is conducted. At t0a the forecast for that time step is generated. At tOb the actual data for
that time step is collected. At ti a, which is the start of the time step all data from tO has been collected. It is not possible to compare the forecasted data with the actual data. Although at tOa, forecasts for tO to t3 were generated only the tO portion of the forecast can be compared since tl to t3 is in the future and actual data is yet to been generated.
The straightforward value comparison between the actual data and the forecast data may not be a sufficient comparison. All data will have some degree of measurement error included. The actual data that is collected by the bottom-up module will also include some measurement error. One possibility to determine if the actual data that includes some measurement error matches with the forecast is to use Markov Chain Monte Carlo (MCMC), which uses probability theory to
determine if the given forecast agrees with the data. Actual data for a number of time series along with the initial time step from the same number of forecasts maybe required before MCMC may be used. This is an area that will require further research in the future.
4.9.6 Feedback
Control theory uses feedback to help a system target a goal. The same feedback principle can be used to assist in the numerous models in the top-down module to correct the difference between the actual data and forecasts. The comparison of actual data and the forecast will provide the difference on how off target the forecast is. This difference will be fed back as an input to the top-down module.
The difference between the actual data and the forecast data is a basic form of feedback. There are a number of more advanced feedback methodologies that can be implemented. One popular feedback method used in tracking is a Kalman filter. The exact implementation is another area where future research can address.
4.9.7 Automated Support for Comparing, Tracking & Balancing Effectiveness of Multiple Models (Box 3)
The framework is able to support multiple models within the top-down module. Each of the models will produce a forecast. Each of the models forecasts will be compared with actual data.
Different types of system dynamic models can be checked as well as other types of models such as agent-based models. A Delphi model where domain experts are polled questions can also reside in the top-down module. The forecasts that they generate will not be a continuous time-series output but they will be polled the same question at every time step and their forecast can be checked against actual results. Using multiple models will allow for determining which model is best tracking with actual data. This information will be useful for future similar events.
4.9.8 Automated Support for Model Parameter Calibration, Recalibration and Validation for Multiple Locales & Situations (Box1)
When creating a system dynamics model the pattern of the output time series is initially more important than the exact values [22]. As the model gets more refined the exact values become more important and the model will need to be calibrated.
A system dynamics model is composed of a number of stocks, flows, and converters. Each node will have either a value or an equation associated with it. The value or equation will need to be calibrated for the model to be as accurate as possible. Calibration is done by identifying the proper coefficient values in the equations of the nodes in the model. As mentioned previously historical data is used to assist and verify models. The data from one locale may differ from other
locales. For example transit data will differ from the Los Angeles and New York City. Travel by automobile is more popular than public transportation in Los Angeles, where as New York City will have much more use of public transportation. Riot data from the US may differ greatly
compared to riot data from the UK. The cause of a riot may be due to a governmental policy, which will be different for each country. Therefore when a model is initially calibrated for one
location it may not behave properly for another locale.
Calibration is conducted in the model creation phase and done in an iterative fashion. To ease the iterative nature and recalibration of different locals the process can be automated.
4.9.9 Crowd Sourcing for Expert Opinion (Bottom-Up Output)
This arrow that is an output of the bottom-up module indicates that expert opinion has been mined electronically in some manner. There are two forms gathering expert opinion. The first is the Delphi method, which is a formal method of where domain experts are queried. Another source is the wisdom of the crowds who are not formal experts but in aggregate can provide expert level opinion. Twitter is an example of how the opinion of the crowd can be gathered. This arrow should be an input to the bottom-up module. The module is gathering data on events and crowd opinion data such as Twitter is one such data source.
4.9.10 Automated Support for Sensitivity Analysis to Infer Behavior Modes and Data Values to be Monitored (Box 4)
Sensitivity analysis is conducted at the model creation phase and can be conducted once the model has been completed to understand how changes on the input can vary the output. 50 Monte Carlo runs is recommended for sensitivity analysis [23]. Sensitivity analysis is a feature that is included in most system dynamics software tools. The output produced by many software tools will show bands where 90%, 95% and 100% of the output fell within.
With a completed model it is possible to identify which variables will affect the model the most. Ford and Flynn have shown that this can be determined when conducing sensitivity analysis. For each run the covariance between the output and input is calculated [24]. The output will show the covariance of each variable for each time step in the time series output. The covariance of
variables will usually change throughout the time-series. Variables that are closer to -1 or 1 are the more relevant variables.
Conducting sensitivity analysis and also calculating the covariance of the variables can be automated, however this is not executed in active monitoring mode, therefore this box will be removed from the framework.
4.9.11 Controller
There is one module that is missing from the framework, a controller module. The timing
diagram in table 2 show that coordination in the timing execution between the top-down module
and up module is required. The controller module will instruct the top-down and
bottom-up modules as well as the other boxes to execute at the correct time.
4.10 Framework Analysis Modifications
During the analysis there were two categories of activities that were identified. One category of
activities is during the model creation and preparation phase. The second is activities that occur during active monitoring of an event. The framework will be modified to reflect only activities
that occur during active monitoring. As a result box 1 and box 4 will be removed. This will
provide a simple framework and also result in a simple software architecture. The modified
Top Down & Bottom Up Monitor Framework
Combining top-Down Systems Models with Bottom-Up
Data Analytics
Controller
Feedback
rop-Down Holistic Theory-Based System Mode, Example: Dissident and Insurgent Escalation
O interpretations of
. Time-Varying Model
- Behavior Estimates
CI
Bottom-Up Data Analytics te Support for
Validation and Tracking Model Forecasts
vs. Actual Outcomes
Automated Support for
-Y * Comparing, Tracking &
Balancing Multiple Models on Effectiveness
F igure 5 Alodified Monitor Top-DoN n Bottom-(p Framework
4.11 Modifications
For this analysis, the framework has been simplified with the removal of box I and box 4. There are two outputs from the bottom-up module. The first is Monitored Data Stream/Time-Varying Exogenous Inputs. This is data that the bottom-up module collects from various databases each time step and is passed to the system dynamics model without any data mining model applied to it. The second is the data that has been passed through a data mining model, which includes a machine learning algorithm. Both types of data will be inputs for the top-down module. Another change is the direct feedback from what was formerly box 2. Previously the feedback was passed to box 1 and then to the system dynamics model. With the removal of box 1, feedback was connected directly to the system dynamics model input.
I
L.
4.12 Riot Example
An example of how the framework will function in the case of a potential riot situation similar to the England riots will be described. The process of creating a system dynamics model, the type
of data that the data mining model will gather, as well what type of machine learning models are needed will be described. Lastly the path of the data will be explained. At the end of the example a figure is provided with the details of the example within the framework diagram.
The premise of the example assumes that a police shooting resulting in a death has recently occurred and the decision to track the event has been made. The first task is to determine what the system dynamics model should forecast, which in this case is if a riot will erupt. Local
authorities will be able to determine what constitutes a riot. In general it is violent actions by a crowd that can lead to destruction of property and harm to the general public. This is binary output and does not provide information on whether the situation will worsen or not. Forecast data must be compared with actual data that does not pass through a data mining model. In this case there is no actual data that indicates the trend of a situation directly. To determine the trend of the situation the location-gathering rate variable will be used as a proxy. This is the rate at which people are gathering at a particular location.
The modeler now must create a model on how a riot will occur as well as gathering patterns. There are a number of causes of riots but the focus will be on those that deal with police
shootings and larger in scope government oppression. Determining the variables to be used is the next step in the model creation phase. Data mining of similar events in the past can be searched through GDELT and news articles. The found articles can be passed through a frequency counter of words to determine which are the most common. Using the words available and the
experience of the modeler, relationships between variables will be created. Also at this point the modeler will determine what types of data are available that the bottom-up module can access and what algorithms can be used to transform the data in way that it can be used as an input to the system dynamics model. This will be an iterative process and after some time the modeler will produce a system dynamics model that is sufficient.
For this example the produced system dynamics model requires the number of anti-government narratives, the number of pro-government narratives, and the inferred anti-government narrative infection rate from the bottom-up module. The actual data that will be used for comparison are riot occurrence and the location-gathering rate. These are the requirements for the data mining model. The data sources that will be used are Twitter and to a lesser extent news media sites such as CNN. The data included tweets that are relevant for this example are tweet text, time of tweet, author, location, and author followers.
To determine the two types of narratives from tweets a classification algorithm will be required. In this case a natural language processing algorithm will be used. An algorithm for each of the narratives will be trained to classify the narratives to an acceptable degree. Next is government narrative infection rate. The meaning of this variable is how fast the
anti-government narrative is spreading. This will require a regression algorithm. Twitter users have followers. It is assumed that a tweet author has a degree of influence on their followers. Bayesian theory may be used to determine the likelihood of followers agreeing with the author's narrative stance. This can be used develop the infection rate regression algorithm.
Lastly, actual data that will be compared with the forecast data must be gathered. The gathering rate can be calculated since tweets include location information. The
location-gathering rate can be calculated by identifying the number of tweets that are generated at a location by unique authors over a period of time. Determining if a riot occurred or not can also be determined through tweet content and be confirmed by news media sites.
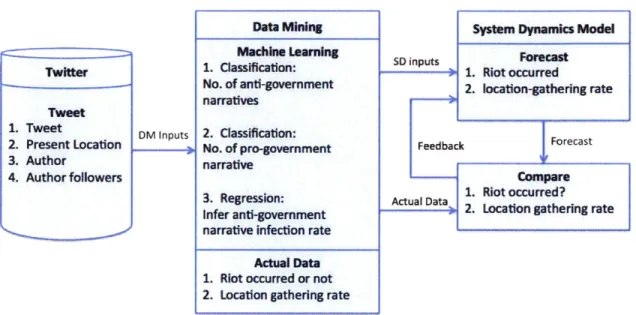
The figure below shows the details of the example within the framework diagram.
The data mining model will gather tweets from Twitter. Tweets will pass through the data mining model to determine if the context contain anti-government narratives or not. The same will be done for pro-government narratives. Second, the data mining regression model will determine the anti-government infection rate. Third, tweet content as well as news media will be check to identify if a riot has occurred or not. Lastly, the location-gathering rate will be
calculated. The results of the last two will be saved while the totals for each classification and anti-government infection rate will be passed to the system dynamics model. The system