Publisher’s version / Version de l'éditeur:
Vous avez des questions? Nous pouvons vous aider. Pour communiquer directement avec un auteur, consultez la première page de la revue dans laquelle son article a été publié afin de trouver ses coordonnées. Si vous n’arrivez pas à les repérer, communiquez avec nous à PublicationsArchive-ArchivesPublications@nrc-cnrc.gc.ca. Questions? Contact the NRC Publications Archive team at
PublicationsArchive-ArchivesPublications@nrc-cnrc.gc.ca. If you wish to email the authors directly, please see the first page of the publication for their contact information.
https://publications-cnrc.canada.ca/fra/droits
L’accès à ce site Web et l’utilisation de son contenu sont assujettis aux conditions présentées dans le site
LISEZ CES CONDITIONS ATTENTIVEMENT AVANT D’UTILISER CE SITE WEB.
Health Physics, 117, 3, pp. 242-247, 2019
READ THESE TERMS AND CONDITIONS CAREFULLY BEFORE USING THIS WEBSITE.
https://nrc-publications.canada.ca/eng/copyright
NRC Publications Archive Record / Notice des Archives des publications du CNRC : https://nrc-publications.canada.ca/eng/view/object/?id=e8deb8f8-7fae-435d-8634-5d4c4837b2d3 https://publications-cnrc.canada.ca/fra/voir/objet/?id=e8deb8f8-7fae-435d-8634-5d4c4837b2d3
NRC Publications Archive
Archives des publications du CNRC
This publication could be one of several versions: author’s original, accepted manuscript or the publisher’s version. / La version de cette publication peut être l’une des suivantes : la version prépublication de l’auteur, la version acceptée du manuscrit ou la version de l’éditeur.
For the publisher’s version, please access the DOI link below./ Pour consulter la version de l’éditeur, utilisez le lien DOI ci-dessous.
https://doi.org/10.1097/HP.0000000000001057
Access and use of this website and the material on it are subject to the Terms and Conditions set forth at
A comparative study of radon levels in federal buildings and
residential homes in Canada
Downloaded from ht tps: //journals. lww. com/ healt h-physics by BhDMf 5eP HK av1zE oum1t Q fN4a+ kJLhE ZgbsI Ho4X Mi0hCywCX 1A W nY Q p/ IlQ rHD3i3D0O dRyi7T vS Fl4Cf 3V C4/ O AV pDDa8K KG KV 0Y my+ 78= on 11/ 09/ 2020 Downloadedfrom https: //journals. lww.com/ health-physics byB hDMf5eP HKav1zE oum1tQ fN4a+ kJLhEZgbsI Ho4XMi0hCywCX 1AW nYQ p/IlQ rHD3i3D0OdRyi7T vSFl4Cf 3VC4/ OAV pDDa8KKG KV0Y my+78= on11/ 09/2020
Paper
A COMPARATIVE STUDY OF RADON LEVELS IN FEDERAL BUILDINGS
AND RESIDENTIAL HOMES IN CANADA
Jeffrey Whyte,
1,2Renato Falcomer,
1and Jing Chen
1Abstract—Shortly after revision of the Canadian radon guideline
from 800 to 200 Bq m−3, Health Canada established the Federal Building Testing Program in 2007 to demonstrate federal leader-ship in raising awareness about radon risk and the need for test-ing. By the end of 2017, more than 7,600 federal workplaces had been tested for radon. As is the case in all radon surveys, radon levels vary widely; federal building results ranged from below the detection limit to more than 2,500 Bq m−3in a few rooms of a few buildings. Weighted by the population of federal public ser-vants across Canada, the average radon distribution in federal workplaces has a geometric mean of 22.0 Bq m−3with a geometric standard deviation of 2.3. The population-weighted arithmetic mean is 34.3 Bq m−3, significantly lower than the population-weighted average radon concentration of 72.9 Bq m−3in residen-tial homes across Canada. On average, 2% of federal workplaces have radon concentrations above 200 Bq m−3, which is also signif-icantly lower than the 7% of residential homes that tested above 200 Bq m−3. This comparative study demonstrated clearly that ra-don education and awareness in Canada should focus more on residential testing and remediation actions to effectively reduce the burden of radon-induced lung cancer.
Health Phys. 117(3):242–247; 2019 Key words: radon
INTRODUCTION
RADON ISa naturally occurring radioactive gas generated by
the decay of uranium-bearing minerals in rocks and soils. Since radon is a gas, it can move freely through the soil, en-abling it to escape into the atmosphere or seep into homes and buildings. Epidemiological studies have confirmed that exposure to radon in workplaces and homes increases the risk of developing lung cancer. Exposure to indoor radon has been determined to be the second leading cause of lung cancer after tobacco smoking (WHO 2009).
In collaboration with provincial and territorial govern-ments, the Canadian guideline was lowered from 800 to 200 Bq m−3in June 2007 (Health Canada 2007). At about
the same time, Health Canada embarked on multiple cam-paigns to collect indoor radon measurements from work-places and residences.
The first and longest running campaign was the Fed-eral Building Testing Program. It was initiated in 2007 to gain a better understanding of the distribution of radon con-centrations in homes and workplaces across the country and to demonstrate federal leadership in raising awareness about radon risk and the need for testing. The program offered free radon testing for all buildings under the jurisdiction of the Government of Canada, thereby providing federal em-ployers and building managers with information to assess whether remediation was necessary. All federally owned properties were eligible to participate, including many dif-ferent types and sizes of workplaces as well as residential homes owned by federal departments. Between 2007 and 2017, the approximately 20,000 federally owned properties across Canada were tested. For the purposes of this study, only the results for workplaces (mainly office buildings) are reported and used in the analysis.
To better characterize Canadians’ exposure to radon in their homes, a national residential radon survey was launched in April 2009. Radon testing was performed in 2009–2010 and 2010–2011 during the fall/winter periods, and results were obtained from about 14,000 homes across Canada. Results of
1
Radiation Protection Bureau, Health Canada, Ottawa, Ontario, Canada;2Construction Research Centre, National Research Council, Ottawa, Ontario, Canada.
The authors declare no conflicts of interest.
For correspondence contact Jing Chen, Radiation Protection Bureau, Health Canada, 775 Brookfield Road, Ottawa K1A 1C1, Canada, or email at jing.chen2@canada.ca.
(Manuscript accepted 22 October 2018)
0017-9078/19/0
Copyright © 2019 CROWN. Published by Wolters Kluwer Health, Inc. on behalf of the Health Physics Society. This is an open-access article distributed under the terms of the Creative Commons Attribution-Non Commercial-No Derivatives License 4.0 (CCBY-NC-ND), where it is per-missible to download and share the work provided it is properly cited. The work cannot be changed in any way or used commercially without permis-sion from the Journal.
this 2 y residential radon survey were reported in 2012 (Health Canada 2012) and broken down by province and health region. Following the cross-Canada radon survey, a smaller survey of about 3,200 homes was conducted to quantify indoor radon and thoron concentrations separately. The study area included 33 census metropolitan areas, covering approximately 70% of the Canadian population (Chen et al. 2015).
Due to differences in building characteristics and con-struction requirements/standards, radon levels in workplaces can differ significantly from the levels in residential homes. In this study, measurements collected are summarized to compare radon distribution parameters for Canadian work-places and Canadian homes, and the implications are briefly discussed.
MATERIALS AND METHODS
Participation in the Federal Building Testing Program was voluntary. To test for radon in federally owned proper-ties, Health Canada provided long-term radon detectors and instructions on where to place them to building owners or their delegates. Health Canada also conducted all laboratory analyses. Each individual department or building manager was responsible for deploying detectors in the buildings and sending them back to Health Canada’s National Radon Laboratory for analysis (the uncertainty of detector analyses was checked annually and kept within 10%). All radon tests were conducted for at least 3 mo, generally in the fall/winter period. The results analyzed here are all from tests using
alpha track radon detectors. Test results were reported to property owners for action.
As mentioned, in this study only indoor workplaces, i.e., nonresidential federal properties, are considered in the statistical analysis. Federally owned indoor workplaces in-clude office buildings, laboratories, healthcare facilities, pen-itentiaries, bank buildings, schools, daycares, and others.
For some workplaces, especially large office buildings, multiple occupied spaces were tested in each building to ac-count for differences across the building footprint. When a test involved two or more measurements in a single build-ing, the average radon concentration was calculated and assigned as the representative radon concentration for that workplace. As well, some properties were tested more than once to confirm earlier results or to assess the effectiveness of remediation actions. When the data set contained multi-ple test results for a single address location, the most recent test results are considered in the current analysis.
Because more than 40% of federal public servants are employed in the National Capital Region (NCR), the NCR is treated as a special region excluded from the provinces of Ontario and Quebec in all analyses.
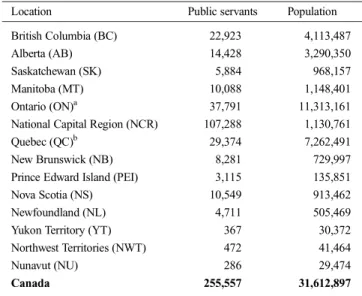
For calculating population-weighted radon distribution characteristics in federal workplaces, the annual total popu-lation in the federal public service by province was used (Statistics Canada 2018), as given in Table 1. The total pop-ulation of public servants includes indeterminate, term, and casual employees as well as students.
Table 1. Annual population in federal public service as of March 2015 (Statistics Canada 2018) and Canadian population from 2006 census (Statistics Canada 2010).
Location Public servants Population British Columbia (BC) 22,923 4,113,487 Alberta (AB) 14,428 3,290,350 Saskatchewan (SK) 5,884 968,157 Manitoba (MT) 10,088 1,148,401 Ontario (ON)a 37,791 11,313,161 National Capital Region (NCR) 107,288 1,130,761 Quebec (QC)b 29,374 7,262,491 New Brunswick (NB) 8,281 729,997 Prince Edward Island (PEI) 3,115 135,851 Nova Scotia (NS) 10,549 913,462 Newfoundland (NL) 4,711 505,469 Yukon Territory (YT) 367 30,372 Northwest Territories (NWT) 472 41,464 Nunavut (NU) 286 29,474 Canada 255,557 31,612,897 a
Ontario, excluding the National Capital Region. bQuebec, excluding the National Capital Region.
Table 2. Radon distribution characteristics (GM and GSD), average radon levels (AM), and percentage of buildings above 200 Bq m−3 in federal workplaces from 10 provinces, 2 territories, and the National Capital Region (GM is the geometric mean in Bq m−3, GSD is the geometric standard deviation, AM is the arithmetic mean in Bq m−3; location abbreviations from Table 1).
Location Employees Buildings tested GM GSD AM >200 Bq m−3(%) BC 22,923 1,272 17.3 2.5 32.9 2.0 AB 14,428 733 23.8 2.1 32.8 1.0 SK 5,884 342 40.0 2.8 70.8 8.2 MB 10,088 852 39.5 2.6 64.0 4.7 ONa 37,791 1,475 20.4 2.4 33.2 2.1 NCR 107,288 282 20.8 2.1 29.2 1.4 QCb 29,374 1,242 18.6 2.5 32.1 1.3 NB 8,281 418 32.6 2.7 58.8 4.8 PEI 3,115 51 17.3 2.1 24.6 2.0 NS 10,549 581 21.6 2.5 37.5 2.2 NL 4,711 265 22.6 2.3 34.7 0.8 YK 367 56 40.6 2.3 57.7 1.8 NT 472 37 20.8 2.4 29.3 0.0 NU 286 — — — — — Canada 255,557 7,606 22.0 2.3 34.3 2.0 a
Ontario, excluding the National Capital Region. b
Quebec, excluding the National Capital Region.
243 Radon levels in CanadacJ. WHYTE ET AL.
Data for radon levels in residential homes are taken from various surveys (Chen et al. 2008, 2015; Health Canada 2012). Detectors and the instructions for deploying them were sent to homeowners; the instructions followed the procedure outlined in Health Canada’s guide for radon measurements in residential dwellings (Health Canada 2008). All studies recruited participants during the summer so that testing could be done in fall/winter (October to March) for at least 3 mo. Alpha track detectors were used in all residential surveys considered here. During the past decade, three residential radon surveys were conducted in the NCR with a total of 330 homes tested for radon
(Chen et al. 2008, 2015; Health Canada 2012). The results of radon in NCR homes were pulled together for calculation of radon distribution parameters which then were compared to radon distribution characteristics in federal workplaces in the NCR.
To compare radon exposure in federal workplaces to that in residential homes, radon distribution characteristics of the cross-Canada radon survey were calculated for prov-inces and the NCR. As in the report Cross-Canada Survey of Radon Concentrations in Homes (Health Canada 2012), the population of the 2006 census, which was the most cur-rently available population estimate at the time the study
Fig. 1. Inverse cumulative probability distribution of radon concentration (CRn) in federal buildings within Saskatchewan (upper panel) and Prince Edward Island (lower panel).
was initiated in 2009, was used in the current analysis, as shown in Table 1.
RESULTS AND DISCUSSION
In the past 10 y, more than 7,600 federal workplaces were tested for radon. Radon distribution characteristics derived from these results are summarized in Table 2 by province, territory, and the NCR. As is the case in all radon surveys, radon levels in indoor workplaces vary widely; Table 2 presents a range from below the detection limit (DL ≈ 15 Bq m−3) to more than 2,500 Bq m−3 in a few
rooms of a few buildings. The average radon concentration, i.e., the arithmetic mean (AM) radon concentration, was highest in Saskatchewan at 71 Bq m−3and lowest in Prince
Edward Island at 25 Bq m−3. Percentages of buildings
above 200 Bq m−3varied from 0% in the Northwest
Terri-tories to 8.2% in Saskatchewan.
Generally speaking, radon levels follow a lognormal distribution, as demonstrated in many residential radon surveys including the cross-Canada radon survey in each province. Two examples of radon measurements in federal buildings are shown in Fig. 1: the radon distribution in (1) 306 federal buildings that tested above the DL in Saskatchewan (upper panel) and (2) 37 federal buildings that tested above the DL in Prince Edward Island (lower panel). Except for data points close to the DL at the bottom left corner and a few outliers with high radon concentra-tions, most data points fall on a nearly straight line implying that the data fit reasonably well a lognormal distribution
(R2 = 0.94 for buildings in Saskatchewan, R2 = 0.81 for buildings in Prince Edward Island).
The characteristic parameters of radon distributions in federal buildings were calculated. When calculating the averages, results below the detection limit were assigned a value of roughly half of the DL, i.e., 8 Bq m−3. Weighted
by the population of federal public servants across Canada, the average radon distribution in federal workplaces has a geometric mean (GM) of 22.0 Bq m−3 with a geometric
standard deviation (GSD) of 2.3. The population-weighted AM is 34.3 Bq m−3. On average, 2% of federal workplaces
have radon concentrations above 200 Bq m−3at which value
remediation is recommended. Since federal workplaces cover a variety of indoor workplaces across Canada from major cities to remote areas, the radon distribution charac-teristics derived from the federal workplace radon survey can be considered representative for indoor workplaces in Canada.
Radon distribution characteristics in residential homes are calculated based on three previous surveys (Chen et al. 2008, 2015; Health Canada 2012). Results are summarized in Table 3 by province, territory, and the NCR. More than 14,000 homes were tested for radon. Weighted by popula-tion, the average radon distribution in Canadian homes has a GM of 42.7 Bq m−3with a GSD of 2.8. The
population-weighted AM is 73 Bq m−3. On average, 7% of Canadian
homes have radon concentrations above 200 Bq m−3. Since
the cross-Canada residential radon survey covered all 123 health regions defined by the provincial ministries of health as administrative areas across Canada, the radon distribution characteristics derived from the above-mentioned residential radon surveys can be considered representative for radon in Canadian homes.
Table 3. Radon distribution characteristics (GM and GSD), average radon levels (AM), and percentage of homes above 200 Bq m−3in residential homes from 10 provinces, 3 territories, and the National Capital Region (Chen et al. 2008, 2015; Health Canada 2012). Location abbreviations from Table 1.
Location Population Homes tested GM GSD AM >200 Bq m−3(%) BC 4,113,487 1,817 24.2 2.2 40.3 3.9 AB 3,290,350 1,131 64.5 2.3 87.8 5.7 SK 968,157 1,206 89.2 2.4 127.8 15.7 MB 1,148,401 1,183 95.1 2.6 137.9 19.4 ONa 11,313,161 3,886 35.0 2.8 61.2 4.4 NCR 1,130,761 328 64.0 2.5 97.4 9.9 QCb 7,262,491 1,722 36.2 3.1 70.7 7.9 NB 729,997 830 67.6 3.7 154.6 20.6 PEI 135,851 113 23.7 2.9 45.7 3.5 NS 913,462 592 40.1 3.5 100.9 10.6 NL 505,469 713 32.4 3.1 63.8 5.1 YK 30,372 225 87.2 3.1 175.1 19.6 NT 41,464 185 38.6 3.0 69.5 5.4 NU 29,474 78 9.3 1.5 10.3 0.0 Canada 31,612,897 14,009 42.7 2.8 72.9 7.0 aOntario, excluding the National Capital Region.
b
Quebec, excluding the National Capital Region.
Table 4. Percentage of test results above 200 Bq m−3in federal workplaces and in Canadian homes (location abbreviations from Table 1).
Location Workplaces (%) Homes (%) Ratio workplace/homes
BC 2.0 3.9 0.52 AB 1.0 5.7 0.17 SK 8.2 15.7 0.52 MB 4.7 19.4 0.24 ONa 2.1 4.4 0.47 NCR 1.4 9.9 0.14 QCb 1.3 7.9 0.16 NB 4.8 20.6 0.23 PEI 2.0 3.5 0.56 NS 2.2 10.6 0.21 NL 0.8 5.1 0.15 YK 1.8 19.6 0.09 NT 0.0 5.4 0.00 Canada 2.0 7.0 0.27 a
Ontario, excluding the National Capital Region. b
Quebec, excluding the National Capital Region.
245 Radon levels in CanadacJ. WHYTE ET AL.
Comparing radon levels in federal workplaces with radon levels in residential homes, from Tables 2 and 3, the radon distribution parameters are consistently lower in workplaces than in homes. Significantly lower radon concentrations found in workplaces are likely due to higher standards for building construction, optimized building operation, and especially the higher ventilation rates employed in the majority of workplaces.
The number of test results above 200 Bq m−3is one of
the parameters frequently used to describe the potential ra-don distribution. Table 4 shows that the percentage of work-places having radon levels above 200 Bq m−3is significantly
lower than the percentage of homes above 200 Bq m−3in all
provinces and territories as well as in the NCR. In the province of New Brunswick, more than 20% of homes tested have radon concentrations above 200 Bq m−3
com-pared to less than 5% of federal workplaces. On average, the percentage of federal workplaces having radon above 200 Bq m−3is more than 70% lower than the percentage
of homes above 200 Bq m−3.
It is well known that an individual’s risk of radon-induced lung cancer increases with radon concentration and the duration of exposure. This comparative study shows that indoor radon concentrations are, on average, twice as high in homes as in workplaces. Since Canadians aged 15 y and older spend more than 70% of their time at home (Statistics Canada 2015), it is clear that residential exposure is the larger contributor to radon-induced lung cancer risk. Health Canada maintains that all indoor envi-ronments where people spend more than 4 h d−1should be
tested and remediated if levels exceed the Canadian guideline; however, these results underscore the impor-tant role of homeowners in protecting themselves and their families.
Much of the power to reduce the national burden of radon-induced lung cancer is within the jurisdiction of the Canadian homeowner. However, evidence indicates that homeowners are not exercising that power. While more Canadians in 2016 were aware of the risks of radon than ever before, testing rates remain low, at less than 6% of homeowners who had heard of radon (Statistics Canada 2016). In 2015, participants from the Health Canada resi-dential surveys whose homes had tested near or above the radon guideline were contacted to see if they had done anything to reduce their radon levels (Health Canada 2018). This follow-up study revealed that only about 29% of these people reported taking steps to reduce the ra-don levels in their homes. For those homeowners who tested above 800 Bq m−3, the mitigation rate was only
39%. These remediation rates are comparable to the rates in other countries, such as 15% in England (Zhang et al. 2011), 22% in Ireland (Dowdall et al. 2016), and 46% in Switzerland (Barazza et al. 2018). The Canadian National
Radon Program has worked hard over the past 10 y to ed-ucate Canadians about radon and encourage them to take action; however, there is clearly much more work to do.
CONCLUSION
From 2007 to 2017, more than 7,600 federally owned indoor workplaces were tested for radon. Due primarily to much higher ventilation rates employed in workplaces, as well as better construction and often optimized build-ing operation, the percentage of Canadian workplaces having radon levels above 200 Bq m−3 is estimated to
be 2%, significantly lower than the 7% of Canadian homes above 200 Bq m−3as shown in various residential
radon surveys.
People spend more time at home than in workplaces. This comparative study showed that most of the radon expo-sure received by an individual comes from home where ra-don levels, on average, are a factor of 2 higher than in the workplace. Because an individual’s risk of radon-induced lung cancer increases with radon concentration and the length of exposure time, it is important to further strengthen radon education and awareness activities within the Na-tional Radon Program, with the focus on residential homes to effectively reduce the health burden of radon-induced lung cancer in Canada.
Acknowledgments—The coauthors would like to acknowledge the contribution of the members of Health Canada’s National Radon Laboratory, specifically Deepti Bijlani, Joseph Kish, Paul Kutyma, Isa Mohammed, Ravi Pooran, Stephen Reid, Rodica Rogojan, Vincent Young, and the regional radiation specialists from various Health Canada regional offices.
REFERENCES
Barazza F, Murith C, Palacios M, Gfeller W, Christen E. A na-tional survey on radon remediation in Switzerland. J Radiol Protect 38:25–33; 2018.
Chen J, Tokonami S, Sorimachi A, Takahashi H, Falcomer R. Re-sults of simultaneous radon and thoron tests in Ottawa. Radiat Protect Dosim 130:253–256; 2008.
Chen J, Bergman L, Falcomer R, Whyte J. Results of simultaneous radon and thoron measurements in 33 metropolitan areas of Canada. Radiat Protect Dosim 163:210–216; 2015.
Dowdall A, Fenton D, Rafferty B. The rate of radon remediation in Ireland 2011–2015: establishing a base line rate for Ireland’s national radon control strategy. J Environ Radioact 162–163: 107–112; 2016.
Health Canada. Government of Canada radon guideline [online]. 2007. Available at
https://www.canada.ca/en/health-canada/services/envi ronmental-workplace-heal th/ radiation/radon/government-canada-radon-guideline.html.
Accessed 5 July 2018.
Health Canada. Guide for radon measurements in residential dwellings (homes) [online]. 2008. Available at https://www.
canada.ca/en/health-canada/services/environmental- workplace-health/reports-publications/radiation/guide-radon-measurements-residential-dwellings-homes.html.
Health Canada. Cross-Canada survey of radon concentrations in homes. Ottawa: Health Canada; 2012.
Health Canada. Public summary: residential radon mitigation ac-tions, follow-up study [online]. 2018. Available at https://
www.canada.ca/content/dam/hc-sc/documents/services/ publications/health-risks-safety/residential-radon- mitigation-actions-follow-up-study/27-1968-Public-Summary-Radon-EN2.pdf. Accessed 5 July 2018.
Statistics Canada. Population and dwelling counts, for Canada, provinces and territories, 2006 and 2001 censuses—100% data [online]. 2010. Available at https://www12.statcan.gc.ca/
census-recensement/2006/dp-pd/hlt/97-550/Index.cfm? TPL=P1C&Page=RETR&LANG=Eng&T=101. Accessed 5
July 2018.
Statistics Canada. Average time spent per day on various activities, for the population and participants aged 15 and over, by sex, Canada, 2010 [online]. 2015. Available at https://www150.
statcan.gc.ca/n1/pub/89-647-x/2011001/tbl/tbl11-eng.htm.
Accessed 27 July 2018.
Statistics Canada. Radon awareness in Canada [online]. 2016. Available at https://www150.statcan.gc.ca/n1/pub/16-508-x/
16-508-x2016002-eng.htm. Accessed 27 July 2018.
Statistics Canada. Population of the federal public service by prov-ince and tenure [online]. 2018. Available at https://www.
canada.ca/ en/t reasury-board-secretariat/ services/ innovation/human-resources-statistics/population-federal-public-service-geographic-province-tenure.html. Accessed 5
July 2018.
World Health Organization. WHO handbook on indoor radon. Geneva: WHO; 2009.
Zhang W, Chow Y, Meara J, Green M. Evaluation and equity audit of the domestic radon programme in England. Health Policy 102:81–88; 2011.
■■
247 Radon levels in CanadacJ. WHYTE ET AL.