HAL Id: hal-02395215
https://hal.archives-ouvertes.fr/hal-02395215
Submitted on 5 Dec 2019HAL is a multi-disciplinary open access
archive for the deposit and dissemination of sci-entific research documents, whether they are pub-lished or not. The documents may come from teaching and research institutions in France or abroad, or from public or private research centers.
L’archive ouverte pluridisciplinaire HAL, est destinée au dépôt et à la diffusion de documents scientifiques de niveau recherche, publiés ou non, émanant des établissements d’enseignement et de recherche français ou étrangers, des laboratoires publics ou privés.
A Quarter Century of Data Envelopment Analysis
Applied to the Transport Sector: A Bibliometric
Analysis
Laurent Cavaignac, Romain Petiot
To cite this version:
Laurent Cavaignac, Romain Petiot. A Quarter Century of Data Envelopment Analysis Applied to the Transport Sector: A Bibliometric Analysis. Socio-Economic Planning Sciences, Elsevier, 2016, �10.1016/j.seps.2016.11.003�. �hal-02395215�
1
A Quarter Century of Data Envelopment Analysis Applied
to the Transport Sector: A Bibliometric Analysis
1Revised version: November 2016
Laurent Cavaignaca,1, Romain Petiota,2,*
a Univ. Perpignan Via Domitia, Acteurs, Ressources et Territoires dans le Développement (ART-Dev),
UMR 5281, F-66860, Perpignan, France
* Corresponding author. IUT de Perpignan, Département GLT, chemin Passio Vella, BP79905, F-66962 PERPIGNAN Cedex 9
1 Tel.: +33 (0) 468 66 24 16; E-mail address: laurent.cavaignac@univ-perp.fr 2 Tel.: +33 (0) 468 66 24 44; E-mail address: rpetiot@univ-perp.fr
Laurent Cavaignac is an Associate Professor, Head of the Business Management Department at the Institute of Technology of Perpignan University. He is a member of the research group
ART-Dev (Acteurs, Ressources et Territoires dans le Développement). He has worked for the
French Ministry of Health and the Social Security System. His research interests are Efficiency and Productivity measures with emphasis on Data Envelopment Analysis and applications to the health and transport sectors. He has published in journals such as Economic Theory,
Economic Modelling or Journal of Productivity Analysis.
Romain Petiot is an Associate Professor in the Department of Transport and Logistic at the Institute of Technology of Perpignan University from the University of Perpignan Via Domitia (France). He is a member of the research group ART-Dev (Acteurs, Ressources et Territoires
dans le Développement). He received his Ph.D. degree in Transport Economics from the
University of Lyon 2 (France). He has published on economic behavior in uncertainty analysis applied to tourism economics and transport economics. His themes of recent research focus on the role of transport infrastructure in agglomeration economies and the productivity analysis of transport companies, especially location decisions in the productive efficiency of transport companies and logistics. He has published in journals such as Transportation Research B,
Transport Policy or Technovation.
1 We thank Michaela Stanickova and Kostas Triantis for their helpful comments during the 2015 EWEPA. We also
2
A Quarter Century of Data Envelopment Analysis Applied
to the Transport Sector: A Bibliometric Analysis
Revised version: November 2016
Abstract
This article is the first to present a comprehensive bibliometric analysis of 461 articles dealing with the application of Data Envelopment Analysis in the transport sector (1989-2016). It also provides a descriptive summary of the 35 most cited articles (scope, models and results) and a commented analysis of the most recent articles dealing with ports and airports. A Multiple Correspondence Analysis is used to characterize the main trends of research in this field. Finally, the article depicts directions which should be investigated by future analyses.
Keywords:
3
A Quarter Century of Data Envelopment Analysis Applied
to the Transport Sector: A Bibliometric Analysis
Revised version: November 2016
1. Introduction
The performance analysis of firms or business sectors naturally leads to productivity and efficiency measures [1, 2, 3]. These productivity measures allow determining the different efficiency gain sources for the firm, and, more precisely, what is the optimal production scale and what are the best management methods and organizations of production networks.
Two methods are mainly used to measure efficiency: Stochastic Frontier Analysis (SFA) and Data Envelopment Analysis (DEA). SFA was first introduced by Aigner et al. [4] and Meeusen and Van den Broeck [5]. It consists in estimating a parametric frontier econometric model. The DEA seminal article was published by Charnes et al. [6] in 1978. DEA is a nonparametric method implemented to measure the productive efficiency of Decision Making Units (DMUs). Its main advantage over SFA is that it does not require any parametric assumption on the production frontier. The envelope of the observed DMUs’ input and output levels is calculated by linear programming and can be considered as a best-practice frontier. By measuring the distance between a firm and the efficient frontier, one can then calculate the DMU’s efficiency. Today, many different DEA models (two-stage DEA, input/output oriented DEA, etc.) are used in the literature and additional statistical inference methods can strengthen results validity [7].
In Operational Research in Economics and in Management Science, the number of publications using the DEA method remarkably increased since the very first article. To illustrate, Gattoufi et al. [8] identify 490 journals having published at least one paper in the field. Emrouznejad et al. [9] register more than 7,000 works and 2,500 authors using DEA between 1978 and 2006. They note that about 360 articles per year were published after 2004 and conclude that DEA reached its maturity phase. More recently, Liu et al. [10] count 4,936 papers on DEA published between 1978 and 2010 in the ISI Web of Science database.
4 Until recently, the main economic sectors applying DEA were mostly the banking industry, education, health care and communication [11]. By way of illustration, the transport sector was never mentioned as a potential application field according to Seiford [12]. The sole transport sector publication cited in this 1978-1995 state-of-the-art is the work from Sexton et al. [13] on pupil transportation funding published in 1994. Moreover, the word "transport" never appears in the keywords list established from the most popular publications between 1978 and 2006 by Emrouznejad et al. [9]. Gattoufi et al. [8] are the first to identify the transport sector as a full division of the taxonomy of the application areas for the DEA method. However transportation appeared very recently as the fourth DEA application field according to Liu et al [11] who state that 53% of the referred articles were published during the period 2005-2009.
As for research work on productivity analysis in the transport sector, Oum et al. [14] do not even cite DEA in their 1992 paper while thirteen years later, DEA is considered as a well-established quantitative method to measure efficiency in transport on the same terms as cost functions estimation or total factor productivity analysis [15]. In more recent surveys, DEA in the transport sector appears considered as having the same academic recognition as the traditional econometric methods when applied to transit [16, 17], airports [18, 19], highways [20] or railways networks [21]. The DEA method not only allows the analysis of economies of scale and economies of scope [22]. It also permits to measure the magnitude of technological change, to guide management decisions such as prices setting, vehicle size choice investment, etc. Moreover, it represents a useful tool for policy makers to set market rules such as deregulation levels or optimal market size. The DEA framework also provides comparisons between firms, networks, geographical areas, or countries.
Adolphson et al. [23] can be considered as the first publication applying DEA to the transport sector. Since then, the yearly number of publications increased at a fast rate. Markovits-Somogyi [24] published a far from comprehensive literature review on the DEA method applied to the transport industry. This state-of-the-art shows that DEA is widely applied for the evaluation of transport activities and provides some methodological conclusions about the use of DEA in this field. However, this survey turns out to be incomplete since it registers only 32% of the articles present in our database over the same period of time.
In this paper, we intend to deliver a first comprehensive list of references of twenty-eight years of research in the field (1989-2016) and a bibliometric analysis. We
5 summarized information on the scope, models and results of the 35 most cited articles according to the transport mode. Moreover, we provide an analysis of the various DEA methods that are implemented for a sample of articles published in 2014 and focused on airports and ports efficiency specifically. We also analyze the inputs/outputs used and their underlying production models. Our goal, here, is to deliver an original contribution which analyzes the transport sectors which are studied and to determine academic research trends and directions which should be investigated by future analyses.
The article is organized as follows. Section two presents our methodology. Section three analyzes, on a univariate basis, the different variables characterizing the publication flow such as the number of publications, the journals, the authors, the geographical areas that are studied, the citations and the analyzed transport modes. In section four, a multiple correspondence analysis (MCA) is presented for a better understanding of the link between the previous variables. Section five summarizes the main results of the in-depth analysis of the ports and airports industry in 2014 and Section six gathers our concluding remarks.
2. Methodology
The following bibliographic analysis is based on articles published in academic refereed journals in English. We considered that the most widely spread and, consequently influential work, is written in English. This is why we excluded papers published in other languages though it may be possible to find significant contributions among them. We first listed all published articles with keywords related to DEA applied to transport economics using Scopus database, Google Scholar and Econlit. We used keywords such as DEA, Data Envelopment Analysis, efficiency, performance, productivity combined with keywords related with transport such as Transport, Transportation, Transport system, Air transport, Airport, Airline, Port, Seaport, Maritime, Bus, Transit, Urban transport, Road, Road haulage, Railroad, Railway. We then conducted a thorough analysis of the references quoted in each article. This provided a first articles database and a list of journals. Each of these journals summaries was then scanned to collect additional articles. In order to gather all significant contributions to the domain under study, we considered some chapters from handbooks and conference proceedings and we did not exclude meta-analyses and
6 surveys. We aimed at obtaining a comprehensive list. However, we may have left aside a few uncited papers. We focused on articles that use the DEA method and its refinements (NDEA, Super Efficiency DEA, bootstrap analysis, etc.) applied to the transportation fields (air, maritime, rail, road, transit and transports policy). The references research was conducted from April 2012 to November 2016.
For each paper, we registered the journal, the authors’ names, the number of authors, the authors’ institutions, the publication year, the transport “mode” (air, maritime, rail, road, transit or transport policy), the transport mode sub-categories (airlines, airports, ports, railway networks, railway companies, haulage companies, transport demand management (TDM2), shipping companies, mass-transit networks),
data regional area, data countries, number of intra-database citations.
We first analyzed each variable independently and then conducted a Multiple Correspondence Analysis (MCA) to study the multidimensional links between these variables and determine homogenous groups mainly based on transportation modes.
3. Monovariate Analysis
3.1. Number of publications
Overall, we identified 461 articles published between 1989 and 20163. The average
number amounts to 16.5 articles per year over the twenty-eight years. The highest number of annual publications is registered in 2016 (54 articles) as shown in Fig. 1.
2 TDM or transport policy are not actual transport modes but research fields that could not be classified among
the other transport mode categories.
3 A file listing the 461 references is available at
7
Fig. 1. Annual number of published articles using DEA in transport analysis (1992-2016).
Following Gattoufi et al. [25] work on DEA general literature, we estimated an exponential trend for the annual number of publications in our field4. The resulting
curve is shown in Fig. 1. In the transport sector, the average annual growth rate amounts to 18.5%. This result can be compared to that of Gattoufi et al. [25] who estimated an annual growth rate of 25.5% for the general DEA literature between 1981 and 2000.
4 For statistical analyses conveniences, we mainly focus on the period 1992-2016 during which articles are
8
Fig. 2. Annual cumulated share of published articles using DEA in transport analysis
(1992-2016).
As Fig. 2 shows, an increase in the number of published articles is observed in the early 2000s and widely accelerates since 2008. Using cumulated data (Fig. 2), three different time periods can be distinguished in terms of publication rhythm. Paralleling the product life cycle proposed by Emrouznejad et al. [9], we propose the following publication sequences:
The first period (1992-1998) displays an average of 3.4 publications per year, which corresponds to the seminal phase of the method in the transportation analysis field (average annual growth rate: 47% - Coefficient of Variation (CV): 2.98);
The second period (1999-2007) shows a more intense activity with an average of 11 publications per year, which corresponds to a dissemination phase of the DEA method in the transport sector although the production volume is still relatively variable (average annual growth rate: 122% - CV: 1.98);
The third period (2008-2016) reflects a sustained level of activity with an average of 37.4 publications per year, which corresponds to a phase of genuine growth of the use of the DEA method in the transportation area (average annual growth rate: 36% - CV: 2.55). The increase since 1992 has been so strong that half of
9 the articles has been published during the last quarter of the whole observed time period (2011-2016).
While globally decreasing, the coefficient of variation indicates that the annual number of publications still varies widely between two consecutive years. For instance, in 2010, the number of publications is almost twice as much as that of 2011.
3.2. Journals
The articles taken into account between 1989 and 2016 involve 127 different academic journals, 2 handbook chapters and one article is extracted from conference proceedings. According to Sarafoglou [26], an influential paper should be included in a bibliographic analysis regardless of media type. This is why we considered two chapters of a handbook and one conference paper which are both heavily cited. The striking fact is the high concentration level of publications in a limited number of journals (as illustrated in Fig. 3) as Emrouznejad et al. [9] and Gattoufi et al. [25] observed in general DEA literature. Indeed, we find that more than 1 publication out of 3 is published in a group of only five journals: Journal of Air Transport Management (JATM), Transportation Research Part E (TRE), Transportation Research Part A (TRA), International Journal of Transport Economics (IJTE) and Transport Policy (TP). Nevertheless, 67% of the journals still have published only one article dealing with DEA method applications in the transport sector.
10
Fig. 3. Cumulative frequency of articles per journals of published articles using DEA in
transport analysis (1989-2016).
Most of the 23 journals that published at least 5 articles using the DEA method in the transport sector are general transportation research academic journals as shown in Table 1: TRE (36 articles), TRA (30), IJTE (22), Transport Policy (19), Journal of Transport Economics and Policy (12), Transportation Planning and Technology (12), Transportation Research Part D (8), Transport Reviews (7), Journal of the Eastern Asia Society for Transportation Studies (6), Transportation (6) and Research in Transportation Economics (5). They represent 35.6% of all the 458 published articles. Four more sectorial journals have published at least 5 articles: JATM (56), Maritime Economics & Logistics (17), Maritime Policy & Management (14), International Journal of Shipping and Transport Logistics (13). They host 21.8% of all listed articles. Finally, nine generalist academic journals have published at least 5 articles in the period 1989-2016: European Journal of Operational Research (11), Accident Analysis and Prevention (7), Omega (7), Procedia – Social and Behavioral Sciences (7),
Socio-11 Economic Planning Sciences (7), Benchmarking (6), International Journal of Production Economics (5) and Journal of Productivity Analysis (5). These journals gather 12% of all published articles. The transportation literature that applies the DEA method is therefore strongly concentrated on a few academic vehicles and remains quite focused on its own sector (57.4%). Although some journals displaying a high potential of diffusion with regards to their Impact Factor5 (as Omega, IJPE, EJOR, TR
or TRE) seem interested in this research area, the average Impact Factor of the 23 most publishing journals in the field is rather low (1.5446 in 2015) which results in a small extra-sectorial diffusion. Indeed, half of the 10 most publishing journals display a 2015 Impact Factor or a 2015 SJR indicator6 below 1. Note that 6 of the 23 most
publishing journals in the field of this analysis appear in the "top 20" of the most influential journals in DEA literature defined by Liu et al. [10]. Also note that two transportation journals belong to this recent ranking (TRA and TRE are ranked 17th and 20th), which shows to which extent the DEA method tends to be influential in the transport sector. Following the recommendation of Sarafoglou [26], we distinguish between DEA research issued by Operational Research journals and by Economics journals. In our database, more than one third of the journals is Econlit listed. This result shows that transport economics tend to be more than a mere application sector for DEA and that transport economics questions are analyzed through DEA applications.
5 The Journal Impact Factor is a product of Thomson ISI (Institute for Scientific Information). The impact factor for a journal is
calculated based on a three-year period, and simply is the average number of times published papers are cited up to two years after publication. For example, the impact factor 2015 for a journal would be calculated as follows:
A = the number of times articles published in 2013-2014 were cited in indexed journals during 2013 B = the number of articles, journals, proceedings or notes published in 2013-2014
impact factor 2015 = A/B.
6 The SCImago Journal & Country Rank is a scientific indicator developed from the information contained in the Scopus®
database. It produces an indicator of the scientific influence of scholarly journals that accounts for both the number of citations received by a journal and the importance or prestige of the journals where such citations come from.
12 Table 1
Journals having published at least 5 articles using DEA in transport analysis (1989-2016).
3.3 Authors
703 different authors are involved in the 461 articles published from 1989 to 2016. The average number of authors per article is 2.45 (according to Emrouznejad et al. [9], it stood around 2 for the general DEA-related articles between 1978 and 2006). Note that 20.6% of the articles are written by one single author, 34.7% by two authors, 28.2% by three authors and 16.5% by four or more authors. These results are comparable to the findings put forward by Emrouznejad et al. [9].
The degree of collaboration can be measured using Subramanyam’s [27] formula7.
When applied to the three publication periods, it evidences the growing number of authors per article: we obtain 68% from 1989 to 1998, 71.7% from 1999 to 2007 and 82.5% from 2008 to 2016. The degree of collaboration in this research field constantly increases.
7 Subramanyam [26] computes the following collaboration index:
𝐶 = 𝑁𝑚
(𝑁𝑚+ 𝑁𝑠)
where 𝑁𝑚 is the number of multiple-authored papers published during a given period of time and 𝑁𝑠 is the number of single-authored publications during the same period.
Journals # articles IF2015 SJR indicator 2015
ECONLIT ERA ranking 2015
h index
2015
Journal of Air Transport Management 56 1.084 0.845 N B 46
Transportation Research Part E 36 2.279 2.095 Y B 67
Transportation Research Part A 30 1.994 1.810 Y A 82
International Journal of Transport Economics 22 0.5 0.24 Y C 16
Transport Policy 19 1.522 1.347 N A 56
Maritime Economics & Logistics 17 0.773 1.1 Y B 33
Maritime Policy & Management 14 1.22 1.5 Y C 40
International Journal of Shipping and Transport Logistics 13 1.493 0.82 N n/a 14
Journal of Transport Economics and Policy 12 0.592 0.63 Y A 40
Transportation Planning and Technology 12 0.706 0.49 N B 26
European Journal of Operational Research 11 2.679 2.595 Y A 181
Transportation Research Part D 8 1.864 1.144 Y B 58
Omega 7 3.962 3.771 Y A 90
Transport Reviews 7 2.452 1.63 N A 46
Accident Analysis and Prevention 7 2.070 1.109 N A* 88
Socio-Economic Planning Sciences 7 0.796 1.513 Y B 33
Procedia - Social and Behavioral Sciences 7 0.4 0.17 N n/a 22
Transportation 6 1.545 1.16 Y A 52
Benchmarking: An International Journal 6 n/a 0.56 N B 38
Journal of the Eastern Asia Society for Transportation Studies 6 n/a n/a N C n/a
International Journal of Production Economics 5 2.782 2.749 Y A 114
Journal of Productivity Analysis 5 0.973 0.85 Y A 54
13 However, the concentration of publications in the field on a limited number of authors is as remarkable as it was for journals. As an illustration, a quarter of the authors is involved in 61.4% of the articles. The five most productive authors contribute up to 16.3% of all published articles and a third of the articles involve only 16 different authors. Only three authors identified in the Emrouznejad et al. [9] "top 12" of the most productive authors in DEA (1978-2007) have contributed to the production of at least one article in the transportation research field between 1989 and 2016: Rajiv D. Banker, Abraham Charnes and Jati K. Sengupta. We can also add Boaz Golany who is listed in the "top 20" (1978-2001) established by Gattoufi et al. [25].
Moreover, as shown in table 2, the intra-base h-index and g-index (which puts more weight on the number of citations than the h-index) evidences the most influent authors in the field: Carlos P. Barros, Ming-Miin Yu, James Odeck, Rico Merkert, Peter Wanke, Kevin Cullinane, Tangfei Wang.
It thus clearly appears that the production of transportation literature using the DEA method is highly dependent on a few authors and consequently on their publication pace. Added to the fast growing number of publications and paralleling Emrouznejad et al. [9], this result leads to consider that the DEA method applied to the transport sector is not yet in its mature phase. The proof is the unstable publication pace between 2006 and 2016 (see for instance the ratio of 1 to 4 between the number of publications in 2007 and 2010). It therefore seems that the authors’ pool in this field is not wide enough to supply a smooth publication flow.
First of all, this concentration can be explained by the fact that the major part of the most productive authors in our database are mainly specialized in transport (more precisely, 6 out of the 10 most productive authors are rather specialized in transport economics, transport engineering or transportation science). As already seen for academic journals, the development of the DEA method in the transport sector somewhat suffers from its natural sectorial centering and from the relative lack of interest on the part of DEA specialists (set apart from a few authors who have deeply invested in the field such as Darold T. Barnum, Carlos P. Barros, Kristiaan Kerstens, Rui C. Marques, Nicolas Peypoch or Carl A. Scheraga).
14 Table 2
Authors involved in at least 5 articles using DEA in transport analysis (1989-2016)
As shown in table 2, 55% of the 20 most productive authors depend from European research institutions. Surprisingly, North American research institutions are only represented by one author and Asian institutions by five authors.
3.4. Geographical areas
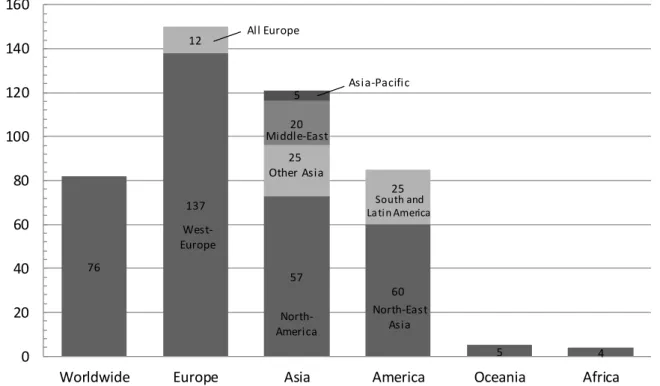
Confirming the previous result, one can note that some geographical areas are over-represented among the data as illustrated in Fig. 4. The geographical analysis reveals that the most frequent region is Europe which is concerned by one third of the 447 located articles8. Asia (27.1%) comes next with a strong domination of North-Eastern
countries such as China, Japan and Korea, followed by North and
8 Note that among the analyzed articles, 3 are meta-analyses based on other articles, 1 is a survey and 10 rely on numerical
simulations. Hence 447 articles use located data, 18.4% of which focus on worldwide data (at least two different regional areas).
Authors Nb of articles h index
intra-base
g index†† intra-base
Barros C.P. University of Lisbon Portugal 26 10 4
Yu M.M. National Taiwan Ocean University Taiwan 18 6 3
Odeck J. Norwegian University of Science and Technology Norway 11 5 2
Merkert R. University of Sydney Australia 10 3 2
Wanke P. Federal University of Rio de Janeiro Brazil 10 1 1
Cullinane K. University Og Gothenburg Sweden 9 8 5
Wang T. United Nations Economic and Social Commission for Asia and the Pacific Thailand 9 8 5
Peypoch N. University of Perpignan France 8 2 1
Lan L.W. Ta Hwa Institute of Technology Taiwan 8 1 1
Assaf A.G. University of Massachusetts-Amherst USA 7 4 2
Gutiérrez E. University of Seville Spain 7 3 2
Lin E.T.J. MingDao University Taiwan 7 3 2
Lozano S. University of Seville Spain 7 3 2
Chang Y.T. Inha University of Incheon Republic of Korea 7 2 1
Mancuso P. University of Roma Italia 6 4 3
Pels E. VU University Amsterdam Netherlands 6 4 2
Gitto S. University of Roma Italia 6 3 3
Marques R.C. Technical University of Lisbon Portugal 6 2 2 Hilmola O.P. Lappeenranta University of Technology Finland 6 2 1
Hermans E. Hasselt University Belgium 6 1 1
Wets G. Hasselt University Belgium 6 1 1
Song D.W. Heriot-Watt University UK 5 5 3
Nijkamp P. VU University Amsterdam Netherlands 5 4 2
Rietveld P. VU University Amsterdam Netherlands 5 4 2
Adler N. Hebrew University of Jerusalem Israel 5 3 3
Karlaftis M.G. National Technical University of Athens Greece 5 3 2
Min H. Bowling Green State University USA 5 3 1
Simões P. Technical University of Lisbon Portugal 5 2 2 Wu J. University of Science and Technology of China-Hefei China 5 2 2
Brijs T. Hasselt University Belgium 5 1 1
Chiou Y.C. National Chiao Tung University Taiwan 5 1 1
Li Y. Nanjing University of Finance ans Economics China 5 1 1
†† The g index is the maximum number g for which g articles gather g2 citations for each article, self-citations excluded. Current institution
15 America (19% of all articles) with a strong prevalence of data from North-America (13.4%). On a country by country basis, the bibliography shows that most articles using DEA in transport analysis between 1989 and 2016 are mainly concerned with US data (17.4% in our database) as shown in Emrouznejad, et al. [9]. Overall, more than half of the 447 articles deal with data coming from only 10 countries. These latter represent 72.9% of all country located papers: USA (55 articles), China (35), Spain (30), Taiwan (25), Italy (21), Norway (15), Brazil (14), India (13), UK (13) and Greece (10).
Fig. 4. Regional data distribution of articles using DEA in transport analysis (1989-2016).
This geographical concentration drives us to consider whether the analyzed data depend on the authors’ institutions location or not. To further analyze this link, we restricted our data base to 296 articles (64% of the data base). We excluded surveys, meta-analyses, numerical simulations and all papers studying 4 different regional areas or more. These 296 articles involve 486 different authors (which represent about 69% of the authors) and data from 40 different countries. As expected, the data show a strong positive correlation between data location and institutions location (ρ=0.9678, see Table 3). The τ Kendall rank correlation coefficient confirms this result. The H0 assumption that data location and institutions location are independent is strongly rejected (p<10-3). 67 118 51 59 4 1 12 18 15 6 5 0 20 40 60 80 100 120 140
Worldwide Europe America Asia Oceania Africa
Other Asia All Europe
South and Latin America Asia-Pacific Middle-East 76 137 57 60 5 4 12 25 25 20 5 0 20 40 60 80 100 120 140 160
Worldwide Europe Asia America Oceania Africa
Other Asia Asia-Pacific Middle-East All Europe South and La tin America North-America West-Europe North-East Asia
16 The correlation coefficient is 0.8693 when computed for the 99 articles resulting from the most productive authors (those having published more than 5 articles during the concerned period). This result suggests that more productive authors use more foreign data than others.
Table 3
Dependence test between author’s current institution location and data location (1989-2016)
To conclude, in the DEA applied to transport economics field, authors mainly publish work using data from their own institution area. It suggests that research in this field
may result more from opportunistic behavior due to data availability than from a rational answer to real political analysis questions.
Moreover, since only less than 20% of the studies concern worldwide data, it suggests that data unavailability at a worldwide level may prevent authors from conducting such more general comparative studies. International databases should be further developed so as to obtain homogenous data measuring inputs and outputs in the transport sector.
All articles with located data
Articles with located data
from most productive authors
Articles
296
99
Countries involved
44
27
ρ
0.9678
***0.8693
***S Kendall
792
134
τ observed
0.9485
***0.7522
***17
3.5. Articles impact
The citations analysis provides a general overview of the most influential works in the research field. We first focus on intra-base citations (461 articles) and we exclude self-citations as advised by Sarafoglou [26] who states that self-citations bias citations indexing.
The overall average number of citations per article reaches 7.19. 29% of the articles are not even cited once but 80% of these articles were published during the last four years of the time period. When excluding these recent articles (2013-2016), there is a 9% probability of not being cited for an article of the database. Moreover, when restraining the sample to articles which are cited at least once, the average citation number per paper is 10.13.
More generally, among the 20 most cited authors in the DEA literature [10], 6 have published at least one paper applied to the transport sector: José M. Pastor (4 articles), Finn R. Førsund (2), Rajiv D. Banker (1), Abraham Charnes (1), Boaz Golany (1), Srinivas Talluri (1).
Conversely, six of the most productive authors in the transport sector published papers applying DEA: Kevin Cullinane (9 articles), Peter Nijkamp (5), Eric Pels (6), Piet Rietveld (5), David Gillen (3), Bruno de Borger (2). This confirms the interest of DEA applied to the transport sector.
Note that the number of publications emanating from transport specialists using DEA is greater than that of DEA specialists applying the method to the transport sector.
18 Table 4
Most cited articles using DEA in transport analysis (1989-2016)
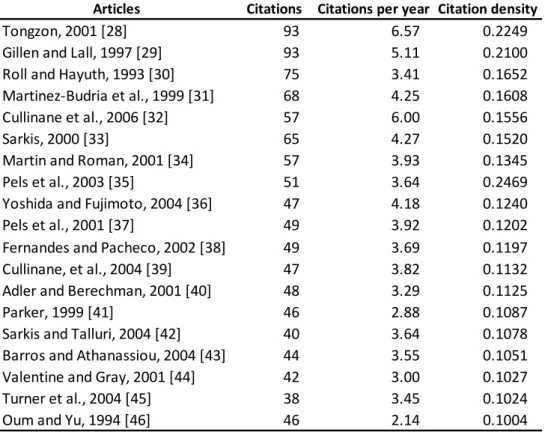
Table 4 presents the most cited articles in the database sorted by their citation density9. One should note that the top six most cited papers are quoted in more than
15% of the subsequent articles. More remarkably, Tongzon [28] Gillen and Lall [29] are cited by more than one article out of 5 and Roll and Hayuth [30], Martínez-Budria et al. [31], Cullinane et al. [32] and Sarkis [33] display a citation density greater than 0.15. On average, these most quoted articles are cited 5 times more in the general research literature according to Google Scholar. Therefore, we may consider these six articles written during the first half of the analyzed period of time as seminal papers in their fields. Moreover, one should note that 4 of these 6 articles focus on maritime transport, and more precisely on ports, and that 2 of these deal with air transport, and more precisely on airports.
9 Citations per year are obtained by dividing the number of citations by the number of years between the year following
publication and 2016. Citation density is computed using the number of citations divided by the number of articles in the database published between the year after publication and 2016. For instance, Tongzon [28] obtains a citation density of 0.225 which means that 22.5% of the articles published between 2002 and 2016 have cited this reference.
Articles Citations Citations per year Citation density
Tongzon, 2001 [28] 93 6.57 0.2249
Gillen and Lall, 1997 [29] 93 5.11 0.2100
Roll and Hayuth, 1993 [30] 75 3.41 0.1652
Martinez-Budria et al., 1999 [31] 68 4.25 0.1608
Cullinane et al., 2006 [32] 57 6.00 0.1556
Sarkis, 2000 [33] 65 4.27 0.1520
Martin and Roman, 2001 [34] 57 3.93 0.1345
Pels et al., 2003 [35] 51 3.64 0.2469
Yoshida and Fujimoto, 2004 [36] 47 4.18 0.1240
Pels et al., 2001 [37] 49 3.92 0.1202
Fernandes and Pacheco, 2002 [38] 49 3.69 0.1197
Cullinane, et al., 2004 [39] 47 3.82 0.1132
Adler and Berechman, 2001 [40] 48 3.29 0.1125
Parker, 1999 [41] 46 2.88 0.1087
Sarkis and Talluri, 2004 [42] 40 3.64 0.1078
Barros and Athanassiou, 2004 [43] 44 3.55 0.1051
Valentine and Gray, 2001 [44] 42 3.00 0.1027
Turner et al., 2004 [45] 38 3.45 0.1024
19
3.6. Transportation modes and sub-categories
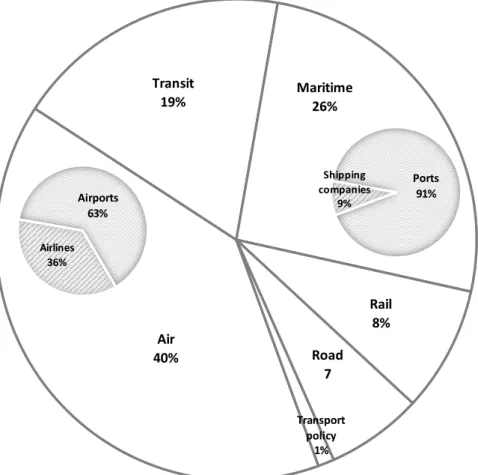
Fig. 5. Modal share of articles using DEA in transport analysis (1989-2016)
The main transportation mode is Air (184 articles - 39.7% of the database), followed by Maritime transport (119 articles - 25.7%) and Transit (86 articles - 18.6%). Rail and Road transports are less frequently analyzed with respectively 8.4% (39 articles) and 6.5% (30 articles). 5 articles (1.1%) deal with the whole transport systems. Among the two main sectors, facilities are overrepresented with 90.8% for ports and 63% for airports.
Our database contains a majority of articles (48.4%) focused on airports and ports facilities (respectively 25.1% and 23.3% of the whole database). Carriers are generally less studied. They only represent 35.9% of the Air transport and 8.4% of the Maritime transport (respectively only 14.3% and 2.9% of the whole database). These results show that authors mainly focus on transportation facilities organization and management. We observe an actual interest for airlines in our database. It may result
Air 40% Transit 19% Maritime26% Rail 8% Road 7 Transport policy 1% Shipping companies 9% Ports 91% Airlines 36% Airports 63%
20 from the need to assess the actual impact of recent market deregulation policies and from the DEA ability to answer such questions.
We also find that the number of articles focused on public transport companies in our database amounts to 18.6%. Less than one tenth of the articles analyzes railways transports (8.4%). Among these papers, more than seven out of ten focus on Railways companies’ efficiency. These articles are mainly based on European data and probably a consequence of ongoing market deregulation.
Finally, 6.5% of the articles deal with road activities dominated by safety road analyses (11 articles) and road transport systems efficiency (10 articles). There are a very few articles dealing with road haulage transportation (3 articles) and Travel Demand Management (6 articles). These categories may represent new fields for DEA applications to the transport sector. Only one article has focused on inland waterways transport and none has dealt with pipelines so far.
The previous analyses suggest that the different variables are linked. For instance, the most cited articles are mainly concerned with one single transportation mode. The transportation mode under analysis could depend on the geographical origin of the data or the journals. This is why we performed a Multiple Correspondence Analysis (MCA) that is presented hereafter.
4. Multivariate analysis: MCA
Since MCA requires a frequency of 5% for each modality, some of them were grouped to reach this minimum. The variables used in the MCA and their modalities are the following: Number of authors (1, 2, 3, 4 or more), publication period (1989 to 1998, 1999 to 2007, 2008 to 2016 according to the three time periods identified above), journal name (or for journals having published less than 7 papers, journal category: 1, 2 or 3 to 6 published papers), transport mode sub-categories (Airlines, Airports, Ports, Railways companies, Transit Companies, Railways, Networks and others), studied geographic area (Asia, Latin America, North America, Western Europe, Worldwide or Others), citation density (0, 0<Dens<0.05, 0.05<Dens<0.1, 0.1<Dens<0.3, 0.3 or more). The first factorial plane gathers a total corrected inertia of 35.8% as shown in Fig. 6.
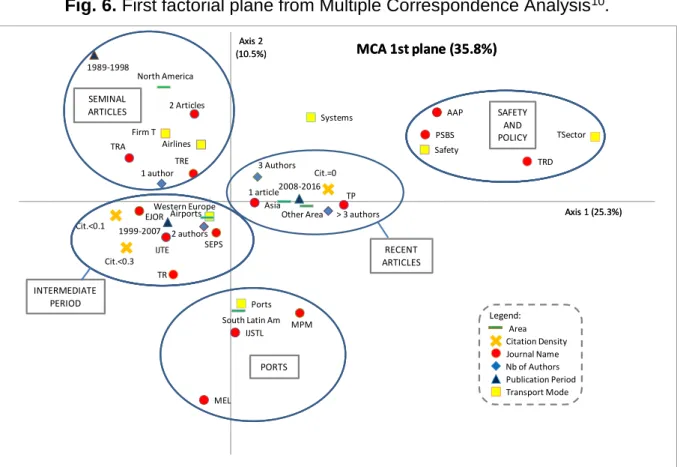
21 Fig. 6. First factorial plane from Multiple Correspondence Analysis10.
Figure 6 represents the significant points on the first factorial plane. Five groups clearly appear. The first three groups (Seminal Articles, Intermediate Period and Recent Articles) are strongly linked to a given time period. The last two groups (Ports and Safety/Policy) are mainly defined by the transport modes which are analyzed.
The first group (left and upper side of the graph, entitled “Seminal Articles”) gathers modalities which reflect the characteristics of articles published during the first time period (1989-1998). These articles are more frequently focused on firm transit or airlines in North America, written by one author and published in journals having published two articles or Transportation Research part A and E.
The second group (right under the first group, entitled “Intermediate Period”) concentrates the most cited articles, written by two authors during the period (1999-2007), which study more often airports from Western Europe and are frequently published in the European Journal of Operational Research, the International Journal of Transportation Economics, Socio-Economic Planning Sciences or Transport Reviews.
10 Detailed MCA results (coordinates, contributions…) are available from the authors upon request. 1 author 2 authors 3 Authors > 3 authors 2008-2016 1989-1998 1999-2007 AAP EJOR IJSTL IJTE MEL MPM 1 article 2 Articles PSBS SEPS TP TR TRA TRD TRE Airlines Airports Firm T Ports Safety Systems TSector Asia Other Area North America South Latin Am Western Europe Cit.<0.1 Cit.<0.3 Cit.=0 Area Citation Density Journal Name Nb of Authors Publication Period Transport Mode Axis 1 (25.3%) Axis 2 (10.5%) MCA 1st plane (35.8%) Axis 1 (25.3%) Axis 2 (10.5%) MCA 1st plane (35.8%) Legend: SEMINAL ARTICLES INTERMEDIATE PERIOD RECENT ARTICLES SAFETY AND POLICY PORTS
22 The third group (to the immediate right of the two previous ones, entitled “Recent Articles”) represents the characteristics of the articles published during the last time period (2008-2016). This group shows an orientation towards a great number of authors (3 and more than 3), Journals having published only one article in the field or Transport Policy, data from Asia or Other Areas and the lowest citation density.
The fourth group (bottom of the graph, entitled “Ports”) clearly is that of articles focused on ports. These articles mainly focus on South and Latin America data and are more often published in the International Journal of Shipping and Transport Logistics, Maritime Policy and Management and Maritime Economics and Logistics.
Group number five (upper right corner of the graph, entitled “Safety and Policy”) is also typically defined by its topics: Safety and Transport Sector Policy. There is no specific modality associated to these articles except the journals in which they are more often published: Accident Analysis and Prevention, Procedia - Social and Behavioral Sciences and Transportation Research part D. However, according to the MCA interpretation rules, these rather extreme points can still be characterized by the closest modalities located out of the group and more specifically that of the “Recent Articles” group. They are among the most recent publications, with a low citation rate, a greater number of authors and more data coming from Asia and Other Areas.
Eventually, one point can be singled out. The transport mode “Systems” is located rather far from the other points: It is less strongly related to other characteristics and cannot be specifically characterized as belonging to a group.
Additionally, the first axis can be interpreted as a temporal gradient. The oldest articles (1989-1998) are located on the negative side of the axis and are opposed to the most recent ones (2008-2016), on the positive side of the axis. The intermediate period articles (1999-2007) can be found between these two groups on the horizontal axis.
This first axis clearly reveals that the first regions which were studied by DEA applied to the transport sector were mainly North-America, followed by West Europe during the intermediate period. The last period articles have a broader focus since Asia and other regions (such as Africa or Middle-East) are studied. This result confirms a general trend in research which often starts in the US before extending to Europe, then to other continents. The intermediate period is characterized by the most highly cited articles (>0.1 and >0.3) while those who are not cited mainly belong to the more recent articles group (though the citation density is an index corrected from the publication date). One
23 can also note that the oldest papers in the database more frequently result from one sole author while the more recent ones more often result from a team work (three authors or more).
Table 5
Publication periods from 1989 to 2016 and their main characteristics.
5. Sample analysis of models and methods
The previous results are mainly bibliometric ones and can be completed by more in-depth analyses. For example, the DEA methods and the additional models that are implemented, the production functions (input/output), the returns to scale assumptions, the environmental variables and obviously the results, could be investigated. However, due to the size of our database, we decided to focus our analysis on specific samples. Firstly we provide, in appendix 1, five tables presenting the detailed main characteristics in terms of scope, methods and results for the mostly cited papers referred to in section 3.5 (see lists in table 6 to 10 hereafter). This appendix offers a detailed survey of the reference articles for each transport mode and subcategories.
Variable\Group Group 1 Group 2 Group 3
Period 1989-1998 1999-2007 2008-2016
Focus Firms and networks Airports Ports
North-America Western Europe Asia
South and Latin America Others
Reviews TRA IJTE, JATM IJSTL, MPM, TPT, TR
Authors Number 1 - >=4
Citations - Most cited Not cited
24 Table 6
10 most cited articles dealing with DEA applied to ports efficiency
Table 7
10 most cited articles dealing with DEA applied to airports efficiency
Table 8
10 most cited articles dealing with DEA applied to airlines efficiency
Articles Citations Citations
per year Citation density Citations density within topic Tongzon, 2001 [28] 92 6.57 0.22 0.88
Roll and Hayuth, 1993 [30] 75 3.41 0.17 0.70
Cullinane et al., 2006 [32] 54 6.00 0.16 0.64
Martinez-Budria et al., 1999 [31] 68 4.25 0.16 0.64
Cullinane, et al., 2004 [39] 42 3.82 0.11 0.45
Barros and Athanassiou, 2004 [43] 39 3.55 0.11 0.42
Turner et al., 2004 [45] 38 3.45 0.10 0.41
Valentine and Gray, 2001 [44] 42 3.00 0.10 0.40
Cullinane et al., 2005 [47] 30 3.00 0.08 0.34
Park and De, 2004 [48] 30 2.73 0.08 0.32
Articles Citations Citations
per year
Citation density
Citations density within topic
Gillen and Lall, 1997 [29] 92 5.11 0.21 0.80
Sarkis, 2000 [33] 64 4.27 0.15 0.58
Martin and Roman, 2001 [34] 55 3.93 0.13 0.52
Pels et al., 2001 [37] 51 3.64 0.12 0.48
Yoshida and Fujimoto, 2004 [36] 46 4.18 0.12 0.48
Pels et al., 2003 [35] 47 3.92 0.12 0.47
Fernandes and Pacheco, 2002 [38] 48 3.69 0.12 0.46
Adler and Berechman, 2001 [40] 46 3.29 0.11 0.43
Sarkis and Talluri, 2004 [42] 40 3.64 0.11 0.42
Parker, 1999 [41] 46 2.88 0.11 0.41
Articles Citations Citations
per year
Citation density
Citations density within topic
Barros and Peypoch, 2009 [49] 27 4.50 0.10 0.60
Schefczyk, 1993 [50] 31 1.41 0.07 0.48
Barbot et al., 2008 [51] 23 3.29 0.08 0.47
Scheraga, 2004 [52] 25 2.27 0.07 0.45
Merkert and Hensher, 2011 [53] 15 3.75 0.07 0.43
Tavassoli et al., 2014 [54] 5 5.00 0.05 0.38
Chiou and Chen, 2006 [55] 19 2.11 0.05 0.36
Greer, 2008 [56] 16 2.29 0.05 0.33
Ouelette et al., 2010 [57] 13 2.60 0.06 0.32
25 Table 9
10 most cited articles dealing with DEA applied to transit efficiency
Table 10
10 most cited articles dealing with DEA applied to railways efficiency
Secondly, we describe and analyze the input/output models implemented and the different types and advances of the DEA method that are applied. However, due to the size of our database, we conduct this analysis on a reduced sample of 22 articles published in 2014 on the airport and port sectors. A summary of the results is presented hereafter in table 11.
Articles Citations Citations
per year Citation density Citations density within topic Karlaftis, 2004 [59] 36 3.27 0.10 0.59 Chu et al., 1992 [60] 35 1.52 0.08 0.42 Viton, 1998 [61] 30 1.76 0.07 0.39
Cowie and Asenova, 1999 [62] 28 1.75 0.07 0.38
Kerstens, 1996 [63] 28 1.47 0.06 0.35
Viton, 1997 [64] 27 1.50 0.06 0.35
Boame, 2004 [65] 21 1.91 0.06 0.34
Lao and Lin, 2009 [66] 12 2.00 0.04 0.31
Odeck and Alkadi, 2001 [67] 21 1.50 0.05 0.30
Karlaftis and Tsamboulas, 2012 [68] 7 2.33 0.04 0.28
Articles Citations Citations
per year
Citation density
Citations density within topic
Oum and Yu, 1994 [46] 45 2.14 0.10 1.32
Coelli and Perelman, 1999 [69] 26 1.63 0.06 0.93
Yu, 2008 [70] 13 1.86 0.04 0.76 Yu and Lin, 2008 [71] 13 1.86 0.04 0.76 Graham, 2008 [72] 10 1.43 0.03 0.59 Cowie, 1999 [73] 15 0.94 0.04 0.54 Cantos et al., 1999 [74] 14 0.88 0.03 0.50 Kutlar et al., 2013 [75] 3 1.50 0.02 0.38
Chapin and Schmidt, 1999 [76] 10 0.63 0.02 0.38
26 Table 11
Main results of port and airport sectors analysis.
Five journals represented 73% of all these papers (16 out of 22): 6 in the JATM, 3 in TRA, 3 in PSBS, 2 in IJTE and 2 in TP.
The number of DMUs, inputs and outputs were far from obeying the rules which state that the number of DMUs should be greater or equal to twice the product of the number of inputs and the number of outputs [78] or that the number of DMUs should be at least three times the number of inputs and outputs together [79]. Indeed, only 7 papers obey to both rules over a given year of data. It is not utterly surprising if one considers that compliance with these rules is not imperative but rather allows for better credibility of the results. Indeed as stated by Cook et al. [80], when the number of DMUs is too low, a specific DEA model may be used to avoid a systematic efficiency of all DMUs. However, when the number of DMUs takes into account the number of years of data, only less than a quarter of the papers does not abide to the rules. But assuming that different observations over time for the same DMU are different DMUs comes down to denying technological progress. This assumption may be true over a short period of time but not in the long run.
More than half of the papers (54%) implemented CCR or BCC models (12 out of 22). This shows that these methods are still prominent. However five articles utilized distance functions, among which four used directional distance functions. One paper only used the traditional multiplicative DEA model. All other analyses were completed by the use of additional methods. Six articles computed Malmquist indices, one a
Variable Airports Ports Airports + Ports
# DMUs 28.1 16.4 22.3
# years 6.1 5.1 5.6
# inputs 4.1 4.3 4.2
# outputs 2.7 3 2.9
% of articles
Sample size rule respected over one year 6 1 32
Sample size rule respected over whole period 13 4 77
VRS assumption 7 3 45 CRS assumption 3 1 18 CRS/VRS assumption 5 3 36 Input oriented 6 4 45 Output oriented 5 3 36 # of articles Average
27 Luenberger index. This raises the question of the one year sample size and the compliance to the sample size rule. Two of these studies did not yearly abide to the rules which should lead to bad efficiency measures. When analyzing technological progress, the number of DMUs should comply with these rules on a yearly basis.
Thirteen articles implemented a second stage method. These methods mainly consisted in second stage regression analyses of efficiency (7 out of 12) and, more specifically two used Simar and Wilson bootstrapping regression analysis. The main variables used in the second-stage analyses were ownership form (4 times), area population (4 times), average aircraft size (3 times), hub status (2 times), and operating hours (2 times). This clearly shows that today’s trend consists in enriching efficiency analysis by measuring the impact of exogenous variables (either environmental variables or short-run fixed variables).
Most models used a VRS formalization (10) or both CRS/VRS (8) while only four assumed CRS. The frequent use of VRS in this field is clearly supported by the economic theory of ports and airports and the consequences of bad model specification when CRS assumptions are used in a VRS situation. Additionally, two articles focus on a fuzzy theory-based DEA model, one paper applies a dynamic inter-temporal DEA cost model and another uses a slacks-based DEA model.
The DEA models were more often input-oriented (45%) than output-oriented (36%). One paper was using the graph orientation and four were not really clear about the orientation but used slacks in both input and output directions. This result is quite surprising since it shows that the debate on which orientation should be chosen is still running. Must a transport facility be considered as having fixed inputs (or quasi-fixed inputs) and maximizing outputs or is it a DMU which minimizes inputs for a given demand level from transport companies?
This naturally leads to the input and output variables which were used in the analyses to model production. On average, 4.2 inputs are used to produce 2.9 outputs (respectively 4.1 and 4.3 inputs to produce 2.7 and 3 outputs in airport and port production models). Most studies did not take into account the intermediate consumptions which turns out to be a problem since inefficiencies may result from the omission of these inputs. The six studies which used intermediate consumption (27% of the papers – only 1 article in port context) used different measures of operational costs. None used any physical measure though DEA is particularly adapted to take them into account. Eight articles only used capital measures as inputs, ignoring
28 simultaneously labor and intermediate consumptions. Ten studies utilized the number of employees while four focused on personnel costs. The main variable of interest of the studies is capital which is measured financially for three studies while all others used physical measures. Various variables are used to incorporate physical capital. The most frequent ones are the number of runways (6), runway length (4), terminal area (5), number of boarding gates (4), and passenger or cargo terminal area (3 and 3) for the airports production models, and terminal area (5), number of cranes (5) and quay length (2) for the ports production models.
The most frequent outputs are different measures of the number of air transport movements (14), the number of passengers (12) and cargo traffic measured in volumes or tons (10) in the airports context, and container throughput (3), container handled (2) and ship calls (2) for ports. The question of which orientation should be chosen remains unanswered. Airports may be considered as answering demand from Airlines and ports should provide the adequate supply for shipping companies, thus minimizing variable inputs to face a given demand. However, since most studies chose fixed inputs, they should have used an output orientation, at least for short run analyses.
Moreover, we must add that three studies focused on bad externalities such as delays (2), noise (1) and air pollution (2). The transports sector has always been characterized by an economic theory of externalities. It is thus surprising that only a few articles deal with this topic. More papers should take these variables into account (either bad or good externalities). This should be one of the main focuses of DEA applied to the transport sector.
Overall, the results of these studies are quite contradictory. There is no clear result concerning returns to scale. This may stem from the differences in orientation or in returns to scale assumptions.
However, though we did not perform any statistical analysis due to our sample size, a few results appear frequently enough to be noted. International and private infrastructures tend to be more efficient. Aircraft size (independent from airport) and Low Cost Carriers increase efficiency. Economic growth appears twice as a factor to efficiency which suggests that airports efficiency strongly depends on demand. Moreover, externalities such as pollution seem to have an impact on the efficiency level. This last result tends to show that bad outputs should be included in the first stage DEA and not only in the second stage analysis.
29 6 Concluding remarks
The transport sector represents an annual volume of academic production relatively limited among fields of applied research using DEA. This sector represents less than 5% of all articles published annually dealing with the DEA method in general. However today, it appears that a dynamic is launched since almost 40 articles per year have been published during the 2008-2016 period. But the necessary distance is still too reduced to conclude that transportation research using DEA method has entered its mature phase.
One should also note that literature in DEA applied to the transport sector relies on a small number of authors and journals. A quarter of the authors represents more than 60% of all articles and 40% of the journals account for more than 80% of all publications. As for the analyzed geographic areas, more than one article out of 2 focuses on North-America or Europe. In all, one could deduce that transport and DEA literature is particularly concentrated and results from the work of a limited academic research network. The observed concentration may stem from data availability. The development of worldwide detailed and standardized databases could allow more authors to conduct more worldwide studies in the field. This could lead to a more general use of DEA applied to the transport sector and help research in this field to definitely reach its mature phase. Moreover the variability of the annual number of articles suggests that the number of researchers in this field is still too restraint to provide a stable publication flow.
The multivariate analysis reveals that the first use of DEA in the transport sector was initiated by a few authors with studies on efficiency of firms and networks in developed countries. This may result from the general deregulation policies implementing the contestable market theory [81]. These policies started to be applied in the transport industry during the 80’s, mainly in the airways, railways and mass transit sectors and more specifically in North-America and Western Europe. Today, the articles in the field are written by larger research teams and focus more on global analyses of emerging geographical areas. This probably results from these countries need to improve the efficiency of their ports which represents a key access to worldwide markets.
30 One should also note that the haulage industry and the transport demand management sector are only studied by a few papers though they should represent an interesting application field. More specifically, the question of urban transport congestion should be analyzed using specific input congestion DEA models [82, 83, 84].
This raises the question of the different DEA methods that can be used to analyze transport production. As showed in section five, an analysis of the different production models and DEA methods and their results by transportation mode would be an important additional output for researchers. In this paper, this analysis was restricted to a small sample since it requires a different article for each transportation mode. However, we intend to conduct this study for the most important transportation industries in our future research. Nonetheless, the present paper provides a sound and comprehensive database to conduct such studies.
In all, the transport sector represents a great opportunity of implementation of DEA new developments such as bootstrap methods, externalities analysis, etc [85].
31 References
[1] Debreu G. The coefficient of resource utilization. Econometrica, 1951;19(3):273-292. [2] Koopmans TC. An analysis of production as an efficient combination of activities. In: TC.
Koopmans (Eds). Activity analysis of production and allocation, Cowles commission for research in economics, Monograph, 13, Wiley, New-York, 1951:33-97.
[3] Farrell MJ. The Measurement of Productive Efficiency. Journal of Royal Statistical Society A, 1957;CXX(3):253-281.
[4] Aigner D, Lovell CAK, Schmidt P. Formulation and Estimation of Stochastic Frontier Production Function Models. Journal of Econometrics, 1977;6(1):21-37.
[5] Meeusen W, Van den Broeck J. Efficiency Estimation from Cobb-Douglas Production Functions with Composed Error. International Economic Review, 1977;18(2):435-444. [6] Charnes A, Cooper WW, Rhodes E. Measuring the efficiency of Decision Making Units.
European Journal of Operational Research, 1978;2(6):429-444.
[7] Simar L, Wilson PW. Sensitivity Analysis of Efficiency Scores: How to Bootstrap in Nonparametric Frontier Models. Management Science, 1998;44(1):49-61.
[8] Gattoufi S, Oral M, Reisman A. A taxonomy for data envelopment analysis.
Socio-Economic Planning Sciences, 2004a;38(2-3):141-158.
[9] Emrouznejad A, Parker B, Tavares G. Evaluation of research in efficiency and productivity: A survey and analysis of the first 30 years of scholarly literature in DEA, Socio-Economic
Planning Sciences, 2008;42(3):151-157.
[10] Liu JS, Lu LYY, Lu WM, Lin BJY. Data envelopment analysis 1978-2010: A citation-based literature survey. Omega, 2013;41(1):3-15.
[11] Liu JS, Lu LYY, Lu WM, Lin BJY. A survey of DEA applications. Omega, 2013;41(5):893-902.
[12] Seiford LM. Data Envelopment Analysis: The Evolution of the State of the Art (1978-1995).
Journal of Productivity Analysis, 1996;7(2-3):99-137.
[13] Sexton TR, Sleeper S, Taggart RE. Improving Pupil Transportation in North Carolina.
Interfaces, 1994;24(1):87-103.
[14] Oum TH, Tretheway MW, Waters II WG. Concepts, methods and purposes of productivity measurement in transportation. Transportation Research Part A, 1992;26(6):493–505. [15] Henscher D. Performance Evaluation Frameworks. In: Button K.J., Hensher, D.A. (Eds).
Handbook of Transport Strategy, Policy and Institutions, Handbooks in Transport, Volume
6, Elsevier, Oxford, 2005:83-95.
[16] De Borger B, & Kerstens K. The Performance of Bus-Transit Operators. In: Hensher DA, & Button KJ. (Eds). Handbook of Transport Modelling, Handbooks in Transport, Vol. 1, Second Edition, Elsevier, Oxford; Amsterdam, 2008:693-714.
[17] Gagnepain P, Ivaldi M, & Muller-Vibes C. The industrial organization of competition in local bus services. In: de Palma A, et al. (Eds). A Handbook of Transport Economics, Edward Elgar, Cheltenham; Northampton, 2011:744-762.
[18] Forsyth P. Models of Airport Performance. In: Hensher DA, & Button KJ. (Eds). Handbook
of Transport Modelling, Handbooks in Transport, Volume 1, Second Edition, Elsevier,
32 [19] Oum TH, Yamaguchi K, & Yoshida Y. Efficiency measurement theory and its application to airport benchmarking. In: de Palma A, et al. (Eds). A Handbook of Transport Economics, Edward Elgar, Cheltenham; Northampton, 2011:298-318.
[20] Rouse P, & Putterill M. Highway Performance. In: Hensher DA, & Button KJ. (Eds).
Handbook of Transport Modelling, Handbooks in Transport, Volume 1, Second Edition,
Elsevier, Oxford; Amsterdam, 2008:741-759.
[21] Nash C, & Smith A. Modelling Performance: Rail. In: Hensher DA, & Button KJ. (Eds).
Handbook of Transport Modelling, Handbooks in Transport, Volume 1, Second Edition,
Elsevier, Oxford; Amsterdam, 2008:665-691.
[22] Blauwens G, De Baere P, & Van de Voorde E. Transport Economics. Berchem, De Boeck, fifth edition, 2012:541.
[23] Adolphson DL, Cornia GC, Walters LC. Railroad Property Valuation Using Data Envelopment Analysis. Interfaces, 1989;19(3):18-26.
[24] Markovits-Somogyi R. Measuring efficiency in transport: the state of the art of applying data envelopment analysis. Transport, 2011;46(1):11-19.
[25] Gattoufi S, Oral M, Kumar A, Reisman A. Epistemology of data envelopment analysis and comparison with other fields of OR/MS for relevance to applications. Socio-Economic
Planning Sciences, 2004;38(2-3):123-140.
[26] Sarafoglou N. The Most Influential DEA Publications: A Comment on Seiford. Journal of
Productivity Analysis, 1998;9(3):279-281.
[27] Subramanyam K. Bibliometric Studies of Research Collaboration: A Review, Journal of
Information Science, 1983;6:33-38.
[28] Tongzon J. Efficiency measurements of selected Australian and other international ports using data envelopment analysis, Transportation Research Part A, 2001;35(2):107-122. [29] Gillen D, Lall A. Developing measures of airport productivity and performance: an
application of data envelopment analysis. Transportation Research E, 1997;33(4):261-273.
[30] Roll Y, Hayuth Y. Port performance comparison applying data envelopment analysis (DEA). Maritime Policy & Management, 1993;20(2):153-161.
[31] Martínez-Budría E, Díaz-Armas R, Navarro-Ibáñez M, Ravelo-Mesa T. A study of the efficiency of Spanish port authorities using Data Envelopment Analysis. International
Journal of Transport Economics, 1999;26(2):237-253.
[32] Cullinane, K., Wang, T.-F., Song D.-W. and Ji, P. (2006) The technical efficiency of container ports: Comparing data envelopment analysis and stochastic frontier analysis.
Transportation Research Part A 40(4), 354-374.
[33] Sarkis, J. (2000) An analysis of the operational efficiency of major airports in the United States. Journal of Operations Management 18(3), 335–351.
[34] Martín, J.C. and Román, C. An application of DEA to measure the efficiency of Spanish airports prior to privatization. Journal of Air Transport Management, 2001;7(3):149-157. [35] Pels, E., Nijkamp, P. and Rietveld, P. Inefficiencies and scale economies of European
airport operations. Transportation Research Part E, 2003;39(5):341-361.
[36] Yoshida, Y. and Fujimoto H. Japanese-airport benchmarking with the DEA and endogenous-weight TFP methods: testing the criticism of overinvestment in Japanese regional airports. Transportation Research Part E, 2004;40(6):533-546.