HAL Id: hal-01558815
https://hal-univ-rennes1.archives-ouvertes.fr/hal-01558815
Submitted on 12 Jul 2017
HAL is a multi-disciplinary open access
archive for the deposit and dissemination of sci-entific research documents, whether they are pub-lished or not. The documents may come from teaching and research institutions in France or abroad, or from public or private research centers.
L’archive ouverte pluridisciplinaire HAL, est destinée au dépôt et à la diffusion de documents scientifiques de niveau recherche, publiés ou non, émanant des établissements d’enseignement et de recherche français ou étrangers, des laboratoires publics ou privés.
From the Cover: MechanisticInsights in Cytotoxic and
Cholestatic Potential of the Endothelial Receptor
Antagonists Using HepaRG Cells
Matthew Gibson Burbank, Ahmad Sharanek, Audrey Burban, Hervé
Mialanne, Hélène Aerts, Christiane Guguen-Guillouzo, Richard John Weaver,
André Guillouzo
To cite this version:
Matthew Gibson Burbank, Ahmad Sharanek, Audrey Burban, Hervé Mialanne, Hélène Aerts, et al.. From the Cover: MechanisticInsights in Cytotoxic and Cholestatic Potential of the Endothelial Receptor Antagonists Using HepaRG Cells. Toxicological Sciences, Oxford University Press (OUP), 2017, 157 (2), pp.451-464. �10.1093/toxsci/kfx062�. �hal-01558815�
Mechanistic insights in cytotoxic and cholestatic potential of the endothelial receptor antagonists using HepaRG cells.
Matthew Gibson Burbank*, †, ‡, Ahmad Sharanek*,†, Audrey Burban*,†, Hervé
Mialanne‡, Hélène Aerts‡, Christiane Guguen-Guillouzo*,†, Richard John Weaver#,¶,| André Guillouzo*,†,¶,|
*
Inserm UMR 991, Foie, métabolismes et cancer, Rennes, France;
†
Université Rennes 1, Rennes, France;
‡
Biologie Servier, 45520, Gidy, France;
#
Institut de Recherches internationales Servier, Suresnes, 92150, France.
¶
Senior co-authors
E-mail addresses: matthew.burbank88@gmail.com (Matthew G. Burbank),
ahmad_sharanek@hotmail.com (Ahmad Sharanek), audrey.burban@univ-rennes1.fr (Audrey Burban), herve.mialanne@servier.com (Hervé Mialanne),
helene.aerts@servier.com (Hélène Aerts), christiane.guillouzo@univ-rennes1.fr (Christiane Guguen-Guillouzo), richard.weaver@servier.com (Richard J. Weaver), andre.guillouzo@univ-rennes1.fr (André Guillouzo)
|
Correspondence should be addressed at INSERM UMR 991, Université de Rennes 1, Faculté de Pharmacie, F-35043 Rennes cedex, France. Tel: (33).2.23.23.53.51; andre.guillouzo@univ-rennes1.fr (André Guillouzo) or atInstitut de Recherches internationales Servier, Suresnes, 92150, France. Tel: +33 (0)1 55 72 87 38; richard.weaver@servier.com (Richard J. Weaver)
Running title: ERA cytotoxic and cholestatic potential
Several endothelin receptor antagonists have been developed for the treatment of pulmonary arterial hypertension. Some of them have been related to clinical cases of hepatocellular injury (sitaxentan) and/or cholestasis (bosentan). We aimed to determine if ambrisentan and macitentan, in addition to bosentan and sitaxentan, could potentially cause liver damage in man by use of human HepaRG cells. Our results showed that like bosentan, macitentan induced cytotoxicity and cholestatic disorders characterized by bile canaliculi dilatation and impairment of myosin light chain kinase signaling. Macitentan also strongly inhibited taurocholic acid and carboxy-2',7'-dichlorofluorescein efflux while it had a much lower inhibitory effect on influx activity compared to bosentan and sitaxentan. Moreover, these three drugs caused decreased intracellular accumulation and parallel increased levels of total bile acids in culture media. In addition, all drugs except ambrisentan variably deregulated gene expression of bile acid transporters. By contrast, sitaxentan was hepatotoxic without causing cholestatic damage, likely via the formation of reactive metabolites and ambrisentan was not hepatotoxic. Together, our results show that some endothelin receptor antagonists can be hepatotoxic and that the recently marketed macitentan, structurally similar to bosentan, can also cause cholestatic alterations in HepaRG cells. The absence of currently known or suspected cases of cholestasis in patients suffering from pulmonary arterial hypertension treated with macitentan is rationalized by the lower therapeutic doses and Cmax, and longer receptor residence time compared to bosentan.
Keywords: endothelin receptor antagonists, cholestasis, hepatotoxicity, bile
Introduction
Pulmonary arterial hypertension (PAH) is a rare, progressive disorder characterized by hypertension in pulmonary arteries with an estimated prevalence of 15-50 cases per million annually (Peacock et al., 2007). The median survival for an untreated PAH patient with supportive care is 2.8 years after diagnosis and the overall prognosis remains guarded (D’Alonzo et al., 1991; Velayati et al., 2016). The pathogenesis of this disease is marked by enhanced synthesis of endothelin 1 (ET-1) and progressive proliferation and hypertrophy of smooth muscle cells in the pulmonary vasculature (Dupuis and Hoeper, 2008). The endothelin receptor antagonists (ERAs) are thought to offer appropriate treatment. They have the capacity to inhibit the binding of endothelin, a strong vasoconstrictive peptide, to its receptors on smooth muscle cells which results in a vasodilation in order to decrease the pulmonary vascular pressure (Humbert et al., 2004). ERAs have been shown to improve exercise tolerance and slow progression of disease in PAH patients (McLaughlin et al., 2011). Two ERAs are currently approved in the USA under the name of bosentan (BOS) in 2001 and ambrisentan (AMB) in 2007. Another agent, sitaxentan (SIT), was approved in 2006 in Europe but not in the USA. Finally, a new ERA, macitentan (MAC), received approval in 2013. These ERAs have been differently associated with liver injury. In 2010 SIT was removed from the market due to concerns about its liver toxicity (Galiè et al., 2011) and BOS was found to cause at least 3-fold upper limit of normal elevation of liver aminotransferases in about 16.8% of patients accompanied by elevated bilirubin in a small number of cases during clinical studies (Fattinger et al., 2001). By contrast, AMB did not appear to cause hepatotoxicity with long-term treatment (Ben-Yehuda et al., 2012). Although structurally similar to BOS, MAC has not been reported to cause elevation of liver
transaminases or bilirubin. There is no data indicating that it has superior therapeutic potency to AMB (Sood, 2014). The four ERAs differ in their level of action on the 2 different ET-1 receptors, ETA and ETB, which are G protein-coupled receptors whose
activation results in elevation of intracellular free calcium (Davenport and Battistini, 2002). While MAC and BOS are dual antagonists, AMB and SIT are selective of ETA
(Dupuis and Hoeper, 2008). AMB is a propionic acid and the three others are sulfonamides. BOS, MAC and SIT are direct inhibitors of the ATP binding cassettebile salt export pump (BSEP/ABCB11) as shown by using cells expressing human BSEP (Fattinger et al., 2001; Dawson et al., 2012; Lepist et al., 2014). By contrast, MAC and its active metabolite ACT-132577 (Sidharta et al., 2011) were reported to have no significant inhibitory effects on bile salt transportin vivo (Raja,
2010; Bolli et al., 2012). In vitro studies suggest that hepatic disposition of MAC is mainly driven by passive diffusion rather than OATP-mediated uptake (Bruderer et
al., 2012). Mechanisms of ERAs hepatotoxicity remain poorly understood. Recently,
we demonstrated that BOS and other cholestatic drugs cause alterations of bile canaliculi (BC) dynamics coupled with impairment of the RhoA/Rho-kinase/myosin light chain kinase (ROCK/MLCK) signaling pathway (Burbank et al., 2016; Sharanek
et al., 2016). Interestingly, ERAs act by reducing myosin-actin interactions and
myosin II contractile activity in smooth muscle and non-muscle cells through phosphorylation of the myosin-light-chain by both ROCK and Ca2+/calmodulin-dependent MLCK (Miao et al., 2002; Dupuis and Hoeper, 2008).
In the present work, we aimed to determine whether ERAs other than BOS are potentially cholestatic and to analyze the mechanisms involved in cytotoxic and cholestatic effects induced by the ERAs using human HepaRG cells. Our results showed that BOS and MAC shared in in vitro comparable cytotoxic and
cholestatic properties while SIT was only cytotoxic and AMB was not hepatotoxic.
Materials and methods
Reagents: Macitentan (MAC) and sitaxentan (SIT) were purchased from Alsachim
(St. Illkirch-Graffenstaden, France). Bosentan (BOS) was obtained from Sequoia Research Products (Pangbourne, U.K). Ambrisentan (AMB) was a gift from MSN Laboratories (Sanath Nagar, India). 1-Aminobenzotriazole (ABT) and methylthiazoletetrazolium (MTT) were purchased from Sigma (St. Quentin Fallavier, France). Calmodulin (CaM) was from Merck Chemicals (Fontenay sous Bois, France). Phalloidin fluoprobe was obtained from Interchim (Montluçon, France). [3 H]-Taurocholic acid ([3H]-TCA) was from Perkin Elmer (Boston, MA). Specific antibodies against phospho-myosin light chain 2 (ser19) (diluted 1:1000, catalog 3675) and HSC70 were provided by Cell Signaling Technology (Schuttersveld, The Netherlands). Anti-zona occludens protein 1 (ZO-1) antibody was obtained from BD Biosciences (Le Pont de Claix, France). Anti-MRP2 and anti-MRP3 antibodies were from Abcam (Cambridge, UK) and secondary antibodies from Invitrogen (Saint Aubin, France). Hoechst dye was from Promega (Madison, WI). Other chemicals were of the highest reagent grade.
Cell cultures and treatments: HepaRG cells were seeded at a density of 2.6×10⁴
cells/cm2 in Williams’ E medium supplemented with 2mm glutaMAX, 100U/ml penicillin, 100µg/ml streptomycin, 10% Hyclone bovine fetal calf serum, 5µg/ml insulin, and 50µM hydrocortisone hemisuccinate. At confluence, after 2 weeks, HepaRG cells were transferred to the same medium supplemented with 1.7% dimethyl sulfoxide (DMSO) for 2 additional weeks in order to obtain confluent
differentiated cultures containing nearly equal proportions of hepatocyte-like and progenitors/primitive biliary-like cells (Cerec et al., 2007). These differentiated hepatic cell cultures were used for analytical assays. For drug treatments, differentiated HepaRG cells were incubated in a medium containing 2% serum and 1% DMSO. The list and characteristics of the 4 tested compounds are displayed in Table 1 and supplemental Table 3.
Cell viability: Cytotoxicity of the test compounds was evaluated using the MTT
colorimetric assay. Briefly, cells were seeded in 24-well plates and exposed to various concentrations of each compound in triplicate for 24h. After medium removal, 100µl of serum-free medium containing MTT (0.5 mg/ml) was added to each well and incubated for 2 h at 37°C. The water-insoluble formazan was dissolved in 100µl DMSO and absorbance was measured at 550 nm (Aninat et al., 2006). IC20 values (the concentrations causing 20% cytotoxicity) were calculated from the concentration-responses curves.
Time-lapse cell imaging: Phase-contrast images of HepaRG cells were captured
every 10 min, using time-lapse phase-contrast videomicroscopy. The inverted microscope Zeiss Axiovert 200M was equipped with a thermostatic chamber (37°C and 5% CO2) to maintain the cells under normal culture conditions and an Axiocam
MRm camera with a 10x objective.
Determination of bile canalicular lumen surfaces
Bile canalicular lumen surfaces appeared bright (white) and the hepatocytes/biliary cells denser (black) using a phase-contrast microscope Zeiss Axiovert 200M. Brightness parameters were adjusted to eliminate non corresponding objects and analysis was performed on at least 4 images per each condition (well). White
canalicular lumen was then quantified using the image J software every 10min for 24h. Data obtained during the first 4h with all tested compounds are presented and BC quantification is expressed as percent of the control (Burbank et al., 2016).
MLCK implication
MLCK implication was estimated using calmodulin (CaM), a specific MLCK activator (Sharanek et al., 2016), at a 5µM final concentration either alone (control) or in co-treatment with the dilatators (i.e. BOS and MAC). BC alteration was quantified after both drug treatment and drug/CaM co-treatment as described above.
Immunolabelling
Cells were washed with warm phosphate buffered saline (PBS), fixed with 4% paraformaldehyde for 20 min at room temperature and then washed three times with cold PBS. After paraformaldehyde fixation, cells were permeabilized for 20 min with 0.3% Triton in PBS followed by 1-hour incubation in PBS containing 1% bovine serum albumin and 5% normal donkey serum. Cells were then incubated overnight with primary antibodies directed against ZO-1, the multidrug resistance associated protein 2 (MRP2/ABCC2) and the multidrug resistance-associated protein 3 (MRP3/ABCC3), and washed with cold PBS before 2-hour incubation with mouse or rabbit Alexa fluor 488 labeled secondary antibodies in the same buffer as described above. Cells were washed with cold PBS and incubated with rhodamine-phalloidin fluoprobe SR101 (200 U/ml) diluted at 1/100 for F-actin labeling for 20min (Pernelle et al., 2011). After washing with cold PBS, cells were incubated with Hoechst in PBS for 20 min for nuclei labeling. Immunofluorescence images were detected by Cellomics ArrayScan VTI HCS Reader (Thermo Fisher Scientific, Waltham, MA) (Bachour-El Azzi et al., 2015).
CDF excretion
After 2h of exposure to the drugs in serum-free medium, cells were incubated for 20 min at 37°C with 3 µM CDFDA, which is hydrolyzed by intracellular esterases to CDF, a substrate of MRP2. After washing, imaging was done using inverted microscope Zeiss Axiovert 200M and AxioCam MRm (Sharanek et al., 2014).
Taurocholic acid clearance
To evaluate taurocholic acid (TCA) clearance activity, cells were first exposed to 43.3nM [3H]-TCA for 30min to induce its intracellular accumulation, then washed with standard buffer and incubated with the test compounds for 2h in a standard buffer with Ca2+ and Mg2+. After incubation with test compounds, cells were washed and scraped in 0.5N NaOH and the remaining radiolabeled substrate was measured through scintillation counting to determine [3H]-TCA clearance (Anthérieu et al., 2013). TCA influx was estimated by determination of sodium-dependent intracellular accumulation of the radiolabeled [3H]-TCA substrate. Cells were treated with the 4 drugs for 2 or 24h followed by incubation with radiolabeled TCA for 30min. Cells were then washed with PBS and lysed with 0.1N NaOH. Accumulation of radiolabeled substrate was determined through scintillation counting (Anthérieu et al., 2013). [3 H]-TCA clearance was determined based on its accumulation in the cell layers (cells + BC) and calculated relative to the control using the following formula: [3H]-TCA clearance = ([3H]-TCA accumulation in (cells + BC)Control * 100) / ([3H]-TCA
Real-time quantitative polymerase chain reaction (RT-qPCR) analysis.
Total RNA was extracted from 106 HepaRG cells with the SV total RNA isolation system (Promega, Charbonnieres-les-Bains, France). RNAs were reverse- transcribed into cDNA and RT-qPCR was performed using a SYBR Green mix. Primer pair sequences are listed here: GAPDH (ID 2597), forward, 50-ttcaccaccatggagaaggc-30: reverse, 50-ggcatggactgtggtcatga-30; BSEP (ID 8647), forward, 50-tgatcctgatcaagggaagg-30: reverse, 50-tggttcctgggaaacaattc-30; NTCP (ID 6554), forward, 50-gggacatgaacctcagatt-30: reverse, 50-cgttggatttgaggacgat-30;
OATP-B (ID 6579), forward, 50-tgattggtatggggctatc-30: reverse, 50- catatcctagggctggtgt-30; MRP2 (ID 1244), forward, 50-tgagcaagtttgaaacgcacat-30: reverse, 50-agctcttctcctgccgtctct-30; MRP3 (ID 8714), forward, 50-gtccgcagaatggacttgat-30: reverse, 50- tcaccacttggggatcatt-30; MRP4 (ID 10257), forward, 50-gctcaggttgcctatgtgct-30: reverse, 50-cggttacaatttcctcctcca-30.
Western blotting analysis of p-MLC2
HepaRG cells were treated with the tested compounds for 1, 2 and 3h at 100µM where BC alteration occurred, then washed with cold PBS and finally re-suspended in cell lysis buffer supplemented with protease and phosphatase inhibitors (Roche, Mannheim, Germany). Aliquots containing equivalent total protein content, as determined by the Bradford procedure with bovine serum albumin as the standard, were subjected to sodium dodecyl sulfate/12% polyacrylamide gel electrophoresis, electrotransferred to immobilon-p membranes, and incubated overnight with primary
antibodies directed against p-MLC2 and HSC70. After using a horseradish peroxidase conjugated anti-mouse/rabbit antibody (Thermo-Fisher Scientific, Waltham, MA), membranes were incubated with a chemiluminescence reagent (Millipore, Billerica, MA) and bands were visualized and quantified by densitometry with fusion-CAPT software (Vilber Lourmat, Collégien, France).
Measurement of endogenous bile acid content
In order to avoid any bile acid (BA) contaminationfromthe serum, all treatments and washings were done in serum-free media. Both dried cell pellets and 1 ml medium samples were collected for BA analysis from HepaRG cell cultures exposed to different drug concentrations at various time points. BA content was measured using ultra high pressure liquid chromatography coupled with tandem mass spectrometry (UPLC–MS/MS). An Acquity UPLC BEH Waters column (Waters Corporation, Milford, MA.), thermostated at 65 °C, was used for chromatographic separation of BA. Mobile phases consisted of (A) (0.1% HCOOH in purified water) and (B) (0.05% triethylamine in acetonitrile) at 95:5 (v/v). BAs were eluted by increasing B/A ratio from 5 to 95 (v/v) for 14.5 min. Separation was achieved at a flow rate of 0.35 ml/min for 18 min. Mass spectra were obtained using an API4000 SCIEX (AB-Sciex, Framingham, MA). Data were acquired by Software Analyst (ABSCIEX) V 1.6.1; Software Masslynx (Waters) V 4.1 and Software Watson (Thermo-Fisher scientific) V 7.3.0.01. The amount of individual BAs in each medium sample was calculated as pmol/ml (nM) and in cell lysate samples as pmol and scaled per mg of proteins. Since basal primitive biliary cells do not express BAs metabolizing enzymes as well as BA transporters (Sharanek et al., 2014) they were neglected for calculation of BA synthesis. Only HepaRG hepatocytes were considered and estimated to represent
50% of total cells in HepaRG cell cultures (Cerec et al., 2007). Total CA represented the sum of (unconjugated CA + TCA + GCA) whereas total CDCA represented the sum of (unconjugated CDCA + TCDCA +GCDCA).
Statistical analysis
One-way Anova with multiple comparison test (graphpad prism 6.00) was performed to compare time-dependent MLC2 phosphorylation in different samples. Data were considered significantly different when *P < 0.05. One-way ANOVA with Bonferroni's multiple comparison test (GraphPad Prism 6.00) was performed to compare BAs data. Each value corresponded to the mean ± standard error of mean (SEM) of at least three independent experiments. Data were considered significantly different when *P < 0.05. The student t-test was also applied to compare values of cytotoxicity, TCA clearance and mRNA levels between treated and corresponding control cultures. Data were considered as significantly different when *P < 0.05. For the mRNA levels, data were also considered as significantly different with the 4h treatment when #P< 0.05. Each value corresponded to the mean ± standard error
(SEM) of three independent experiments.
Results
Cytotoxic potential of ERAs
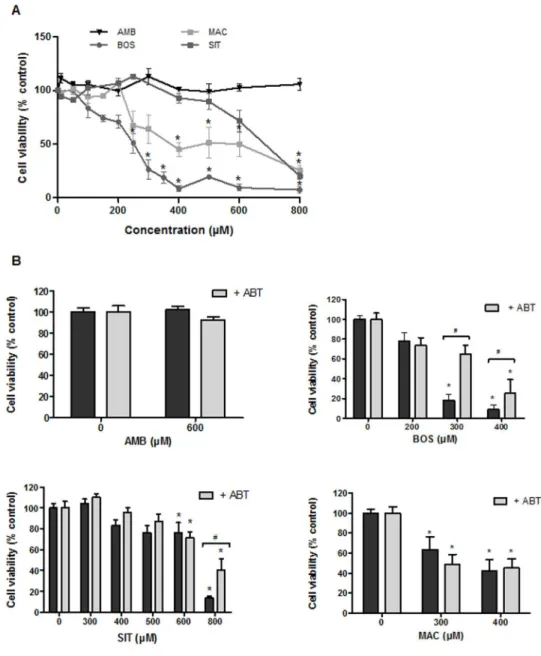
Preliminary experiments were performed to calculate IC20 values for the 4 drugs after a 24h treatment of HepaRG cells with a range of drug concentrations from 0 to 800µM using the MTT assay (Figure 1A). The most cytotoxic compound was BOS with an IC20 value of 120µM followed by MAC (230 µM) and SIT (580µM). AMB was not cytotoxic in the range of concentrations tested. In order to determine whether cytotoxicity was related to cytochrome P450-mediated formation of toxic metabolites
a set of cultures was co-treated with ERAs and 300µM 1-aminobenzotriazole (ABT), a non-selective inhibitor of human P450s, for 24h. Co-treatment with ABT markedly reduced SIT and BOS cytotoxicity at high concentrations (i.e. at 400µM and 800µM respectively) (Figure 1B) while it did not alter effects of MAC.
BOS and MAC caused morphological alterations of BC
We have previously shown that cholestatic drugs cause constriction or dilatation of BC after a short treatment of HepaRG cells (Burbank et al., 2016; Sharanek et al., 2016). In the present study, we analyzed effects of ERAs on BC dynamics over a 4h period using time-lapse videomicroscopy imaging.
MAC and BOS induced dilatation of BC, starting within the first hour whereas SIT and AMB did not affect BC dynamics (Figure 2A) (Supplemental videos). Interestingly, even at 400µM, corresponding to a cytotoxic concentration for both BOS and MAC, the two other ERAs, SIT and AMB, did not affect BC dynamics (Figure 2D) (Supplemental videos). At 600µM (i.e. around IC20 value), SIT caused some morphological alterations without any change in BC structures (Figure 2D). BC alterations caused by BOS and MAC were quantified by measuring the canalicular surface using the image J software every 10min for 180min BC dilatation was greater with MAC than with BOS (Figure 2B). Immunolocalization of the junctional zona occludens protein 1 (ZO-1) and pericanalicular F-actin did not evidence any obvious disruption of BC integrity associated with dilatation of the canalicular lumen at 2h or longer treatments (Figure 2C).
MLC2 and MLCK impairment
It has been postulated that dynamic movements of BC could be controlled by pericanalicular myosin activity (Sharanek et al., 2016). Treatment with BOS and
MAC, the two drugs that induced BC dilatation, showed a decrease with time in MLC2 phosphorylation while AMB and SIT were ineffective (Figure 3A, B). Since MLCK is coupled to ROCK and shares MLC2 as a common substrate, we evaluated whether MLCK also contributed to BC lumen alterations. MLCK implication in BC deformations was determined by the use of calmodulin (CaM), a specific MLCK activator. HepaRG cells were treated with CaM in the presence of dilatators (Burbank
et al., 2016; Sharanek et al., 2016) and BC alterations were quantified and compared
to treatment with the modulator alone as described above. Co-treatment with 5µM CaM partly counteracted dilatation induced by BOS and MAC while treatment with CaM 5µM alone did not cause any effect on BC (Figure 3C, D).
Bile acid profile changes
BA profiles were analyzed after treatment of HepaRG cells with 10, 50 and 100 µM of each drug for 4 or 24h in serum-free medium. Interestingly, a dose-dependent intracellular decrease and parallel accumulation in supernatants of total BAs were observed with MAC, BOS and SIT at both time points (Figure 4). AMB did not cause any effect. At 100 µM MAC showed a decrease in BA intracellular accumulation dropping from 15.7 (control value) to 5 and 2 pmol/mg proteins respectively while BA content increased in the supernatant from 25 to 64 nM and 34 to 78 nM after 4 and 24h treatment, respectively (Figure 4C). BOS exhibited approximately the same pattern, i.e. a decrease from 22 to 6 pmol/mg proteins in cellular layers and from 24 to 3 pmol/mg proteins after 4 and 24h respectively; in supernatants, values varied between 31 and 46 nM at 4h and 51 to 67 nM at 24h (Figure 4B). At 100 µM SIT showed a more important decrease in total BAs in cellular layers ranging from 15 to 4 pmol/mg proteins and 15 to 2 pmol/mg proteins after 4 and 24h, respectively. Concomitantly, BAs concentrations in the supernatant increased from 39 to 69 nM
and 54 to 78 nM at 4 and 24h of treatment with this drug (Figure 4D). Finally, AMB had no effect on BAs intracellular accumulation (around 19 pmol/mg proteins) and supernatant levels (between 33 and 70 nM) at all tested concentrations and at the two treatment time points (Figure 4A). Changes were also estimated as percentages in comparison with controls and individual BAs were measured. As shown in supplemental Tables 1 and 2, all individual BAs have the same tendency to decrease in cellular layers and to increase in supernatants.
Effects on taurocholic acid influx and canalicular efflux activities
To confirm whether ERA-induced BC deformations were associated with alterations of BA transport, influx and efflux activities were measured using [3 H]-TCA as a substrate. As shown in Figure 4E, G and H, AMB had no significant effect on either influx or efflux activities. MAC and BOS inhibited TCA efflux, starting at 10 (13-76x Cmax) and 50µM (7x Cmax) for MAC and BOS respectively, whereas SIT activated efflux activity at low concentration (10µM) and was ineffective at 50µM and higher concentrations (Figure 4E). These concentrations represent 0.5x and 2x Cmax. To confirm its greater activity at 10µM, SIT was also tested at 1, 5 and 20µM. Intermediate increased values were obtained confirming the concentration-dependent induction of TCA efflux by SIT, peaking at around 20µM (Figure 4F). TCA influx was inhibited by BOS and SIT; activity started to decrease with both drugs at 10µM after 2h treatment (Figure 4G). After 24h SIT and BOS still exerted an inhibitory effect starting at 10 and 50µM, respectively. MAC and AMB did not influence TCA influx (Figure 4H).
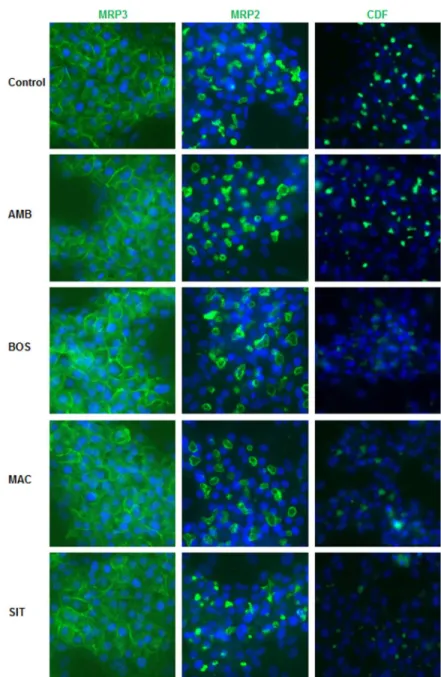
After 2h treatment, distribution of MRP3 protein was analyzed using immunolabeling (Figure 5). Compared to untreated cells, immunostaining intensity of MRP3 to the basolateral membrane of HepaRG cells was slightly increased with the 4 ERAs. Distribution of MRP2was also analyzed after 2h treatment with the 4 drugs using a specific antibody. Compared to untreated cells, immunostaining of MRP2 to the apical membrane of HepaRG cells was slightly decreased with BOS, MAC and SIT.
CDF canalicular accumulation
Fluorescent CDF, predominantly excreted by MRP2, was also visualized in BC of untreated and treated HepaRG cells. While AMB did not show any significant effect compared to control cells SIT, MAC and BOS exerted an inhibition of CDF accumulation in the BC (Figure 5).
Modulation of BA transporters gene expression
Genes encoding the major BA transporters are also deregulated by cholestatic drugs (Pauli-Magnus and Meier, 2006). Six major genes encoding either efflux (BSEP, MRP2, MRP3, MRP4) or uptake (NTCP, OATP-B) transporters were analyzed by RT-qPCR after 4, 8 or 24h treatment with 3 concentrations of each tested drug (i.e. 10, 50 and 100µM). Different patterns depending on the compound and the tested concentration were evidenced and are shown in Table 2 and supplemental Figures 1-3. AMB did not deregulate any of the transporters at the 3 concentrations used whatever the duration of treatment (4, 8 and 24h). By contrast, variable effects were observed with the 3 other drugs. BSEP was strongly repressed by BOS starting at 8h and by MAC only at high concentrations after 24h (Table 2 and supplemental Figure 2). NTCP was downregulated starting
at 24h for the two high concentrations (i.e. 50 and 100µM) of BOS, MAC and SIT.
MRP2 was upregulated with MAC and SIT at the two highest concentrations
(Table 2 and supplemental Figure 1). OATP-B and MRP3 were decreased only with BOS starting after 8h at the highest concentrations (Table 2 and Supplemental Figures 2 and 3) and MRP4 was not modulated by any of the drugs (Table 2 and Supplemental Figure 3).
Discussion
In the current work, we showed MAC shares similar cholestatic features with BOS while SIT exhibited only cytotoxic effects. By contrast, AMB showed no features of hepatotoxicity across the broad range of concentrations tested.
Cytotoxicity of SIT and BOS observed in in vitro are supported by reports on hepatocellular injury in treated patients (Fattinger et al., 2001; Lavelle et al., 2009; Galiè et al., 2011). SIT was found to induce hypertrophy and necrosis of centrilobular hepatocytes in dogs (Lin et al., 2012), and to cause severe liver injury with 8 deaths during clinical trials (Owen et al., 2012). Even though SIT was reported to inhibit BSEP activity in BSEP-expressing membrane vesicles (Morgan et al., 2013), no clinical reports had shown its cholestatic potential. These false positive results could be related to the lack of metabolism in the vesicles. Indeed, SIT undergoes several enzymatic reactions with the involvement of various CYPs, including CYP2C9 and CYP3A4, that lead to a reactive ortho-quinone metabolite which is able to form adducts with glutathione (Erve et al., 2013). Our data agree with the implication of reactive metabolites in the induction of hepatocellular injury. Indeed when CYP activities were inhibited by addition of the non-specific CYP
inhibitor ABT, toxicity was reduced. Importantly, SIT was approved for use in clinical trials at a daily dose of 100mg and 300mg/day and idiosyncratic hepatotoxicity is known to occur more frequently with drugs administered at > 50mg/day (de Abajo et al., 2004).
In the 5-year EARLY study, 16.8 % PAH patients treated with BOS showed elevation of transaminases superior to 3-fold the upper limit of normal, mostly within the first 6 months of treatment (Simonneau et al., 2014). BOS was found to cause toxicity in primary human hepatocytes; it is a strong PXR activator (Weiss et
al., 2013) and is mainly metabolized by CYP3A4 and CYP2C9 (Gatfield et al.,
2012) into 4 metabolites. As expected, co-treatment with ABT also reduced its toxicity (Matsunaga et al., 2016). Our data with HepaRG cells treated with ABT fully agrees with this study concluding that at least one BOS CYP-mediated metabolite is potentially hepatotoxic. Noticeably, since combined treatment with phosphodiesterase 5 inhibitors and other drugs is used for the treatment of PAH (Ghofrani et al., 2011) different interactions between BOS and other drugs could be expected to contribute to greater liver damage.
Contrary to BOS and SIT, AMB and MAC are not known to induce hepatocellular injury in man. In agreement with clinical data (Barst, 2007; Takatsuki et al., 2013), AMB was not toxic to HepaRG cells. It is mainly metabolized by UGTs; only 20% undergoes oxidative metabolism via CYP3A4 and to a lesser extent CYP3A5 and CYP2C19 (Croxtall and Keam, 2008). Noteworthy, AMB is used at 5mg/day, a very low concentration compared with other ERAs (Takatsuki et al., 2013; Chaumais et al., 2015). MAC was cytotoxic to HepaRG cells but at higher concentrations than BOS (IC20 values: 230 vs 120µM respectively) Moreover, MAC toxicity was not reduced by a co-treatment with ABT, supporting that its
toxicity was not CYP-mediated. In agreement, although MAC is mainly metabolized by CYP3A4 and to a small extent by CYP2C8, CYP2C9 and CYP2C19 (Chaumais et al., 2015) it is well established that at a clinical relevant concentration, drug-drug interactions do not occur with co-administered drugs that are also substrates of CYP3A4 (Sidharta et al., 2015).
In HepaRG cells, MAC and BOS caused deformation of BC and impairment of MLC2 phosphorylation that have previously been found to be characteristics of cholestatic drugs (Burbank et al., 2016; Sharanek et al., 2016) (Table 3). Contrary to the two other ERAs, AMB and SIT, which exhibit different chemical structures and are specific for ETA receptors, MAC and BOS share a similar chemical
structure (Supplemental Table 3) and reactivity with both ETA and ETB receptors.
MAC and BOS structures differ only by addition of the replacement of the sulfonamide moiety by a smaller alkyl-sulfamide group in the former, resulting in an increased lipophilicity (Chaumais et al., 2015).
Intrahepatic cholestasis is typically characterized by an inhibition of biliary efflux of BAs leading to their accumulation mostly in hepatocytes. As expected TCA and CDF efflux that reflects BSEP and MRP2 activity respectively, were inhibited by both BOS and MAC, supporting a strong inhibition of canalicular efflux. These results as well as inhibition of NTCP agreed with several previous studies (Hartman et al., 2010; Morgan et al., 2013; Lepist et al., 2014). However, some authors reported only weak inhibition if any, of BSEP with MAC (Treiber et al., 2007) and MRP2 with BOS (Hartman et al., 2010; Lepist et al., 2014). These discrepancies likely reflect use of different experimental conditions. Such inhibitions of efflux and influx transporters are not specific of cholestatic drugs (Pedersen et al., 2013; Köck et al., 2014). As observed earlier (Hartman et al.,
2010; Morgan et al., 2013; Kenna, 2014), SIT also inhibited TCA and CDF efflux activity in HepaRG cells. No BA accumulation was observed with any of the 4 ERAs in HepaRG cell cultures but on the contrary total BAs content was decreased in cellular layers after 4 and 24h treatment in a serum-free medium. A similar observation has been made by using sandwich-cultured human hepatocytes treated with these drugs (Lepist et al., 2014). The decrease in total BAs content in cellular layers after treatment with BOS, MAC and SIT could be related to MRP3 overexpression and consequently resulting in increased sinusoidal efflux. MRP3 has been reported to be upregulated as a result of an adaptive mechanism to the inhibition of MRP2 and BSEP efflux (Donner and Keppler, 2001), including in HepaRG cells KO in BSEP (Qiu et al., 2016). Noticeably, a 2.5-fold activation of TCA efflux after 2h with a low concentration of SIT (i.e. 10µM), which has been described for troglitazone, entacapone or diclofenac (Al-Attrache et al., 2016.; Burbank et al., 2016), was observed. An uncoupling effect between lipids and bile salt independent efflux at the MRP2 level has also been described in BOS-treated rats (Fouassier et al., 2002). Whether a similar effect can occur in treated patients and in cultured human hepatocytes remains unknown.
Only BOS has been reported to cause some cases of cholestasis in clinic. Several explanations can be advanced to support the absence of reported clinical cases of cholestasis with MAC: (i) the approval of this drug received only in 2013 and consequently the limited number of patients treated to-date; (ii) the different physico-chemical properties, pharmacokinetics and metabolism profiles; (iii) more likely conditions of administration to patients. BOS is dosed at 62.5mg twice a day for 4 weeks before using a dose of 125mg/day while MAC is active at 10mg/day
(Pulido et al., 2013) and has a lower Cmax in comparison with BOS; (iv) its 15-fold increased receptor residence time (t1/2) compared to BOS, that could explain at
least partly its therapeutic effects at lower dosages (Gatfield et al., 2012). Moreover, cholestatic features were obtained in vitro with BOS at lower concentrations (<100µM) than with MAC. Noteworthy, an association of BOS and the direct ROCK inhibitor fasudil has been tested. Indeed, fasudil has been successfully used to reverse PAH findings in animal models (Liu et al., 2011). However, no improvement of exercise capacity and pulmonary hemodynamics was evidenced after a 3-month treatment of PAH patients with fasudil (Fukumoto
et al., 2013). Moreover, our in vitro data showed that BOS-induced BC dilatation
was strongly enhanced by co-addition of fasudil in HepaRG cells, suggesting that the combination of the two drugs could result in enhanced cholestatic effects (Supplemental Figure 4).
In summary, our data demonstrate that the two ERAs, BOS and MAC, share some typical cholestatic features which could be attributed to their similar chemical structures. However, these two drugs differ by several properties, in particular lower daily therapeutic dosages and Cmax, and longer receptor residence time that could explain the absence of MAC toxicity presently reported in patients. In addition, our results support a relationship between SIT and BOS hepatotoxicity and the formation of CYP-mediated reactive metabolites. They also support the current recommendation to monitor liver enzymes at the initiation of MAC treatment and in the presence of clinical findings, and to discontinue therapy if patients develop sustained aminotransferase and bilirubin elevations (Monaco and Davila, 2016).
Supplementary Data Description
Supplemental Table 1: Drugs effects on BA disposition and profiles in HepaRG cell cultures incubated in serum-free medium.
Supplemental Table 2: Drugs effects on BA disposition and profiles in HepaRG cell cultures incubated in serum-free medium.
Supplemental Table 3: Chemical structures of the 4 ERAs.
Supplemental Figure. 1. Effects of the 4 drugs on transcript levels of the canalicular transporters BSEP and MRP2.
Supplemental Figure. 2. Effects of the 4 drugs on transcript levels of the influx soluble carrier NTCP and OATP-B.
Supplemental Figure. 3. Effects of the 4 drugs on transcript levels of the basolateral ATP binding cassette MRP3 and MRP4.
Supplemental Figure. 4. Effect of a combination between bosentan 100µM and fasudil 50µM on bile canaliculi dynamics in HepaRG cells.
Supplemental Video 1. Dilatation of BC in bosentan-treated HepaRG cells (0-4h) Supplemental Video 2. BC rhythmic dynamics movements in sitaxentan-treated HepaRG cells (0-4h)
Supplemental Video 3. Dilatation of BC in macitentan-treated HepaRG cells (0-4h) Supplemental Video 4. BC rhythmic dynamics movements in ambrisentan-treated HepaRG cells (0-4h)
Funding information: This work was supported by the European Community [Contract MIP-DILI-115336]. The MIP-DILI project has received support from the Innovative Medicines Initiative Joint Undertaking, resources of which are composed of financial contribution from the European Union's Seventh Framework Programme [FP7/20072013] and EFPIA companies’ in kind contribution. http://www.imi.europa.eu/. Matthew Burbank was financially supported ANRT (Association Nationale de la Recherche et de la Technologie) [n°2013/0112], and Ahmad Sharanek and Audrey Burban by the MIP-DILI project.
Acknowledgments: We are grateful to Remy Le Guevel from the ImPACcell
platform for imaging analysis.
References
Ahn LY, Kim SE, Yi S, Dingemanse J, Lim KS, Jang I-J, and Yu K-S (2014) Pharmacokinetic-pharmacodynamic relationships of macitentan, a new endothelin receptor antagonist, after multiple dosing in healthy Korean subjects. Am J Cardiovasc Drugs 14:377–385.
Al-Attrache H, Sharanek A, Burban A, Burbank M, Gicquel T, Abdel-Razzak Z, Guguen-Guillouzo C, Morel I, and Guillouzo A (2015) Differential sensitivity of metabolically competent and non-competent HepaRG cells to apoptosis induced by diclofenac combined or not with TNF-α. Toxicol Lett 58:71-85.
Aninat C, Piton A, Glaise D, Le Charpentier T, Langouët S, Morel F, Guguen-Guillouzo C, and Guguen-Guillouzo A (2006) Expression of cytochromes P450, conjugating enzymes and nuclear receptors in human hepatoma HepaRG cells. Drug Metab Dispos 34:75–83.
Anthérieu S, Bachour-El Azzi P, Dumont J, Abdel-Razzak Z, Guguen-Guillouzo C, Fromenty B, Robin M-A, and Guillouzo A (2013) Oxidative stress plays a major role in chlorpromazine-induced cholestasis in human HepaRG cells.
Hepatology 57:1518–1529.
Bachour-El Azzi P, Sharanek A, Burban A, Li R, Guével RL, Abdel-Razzak Z, Stieger B, Guguen-Guillouzo C, and Guillouzo A (2015) Comparative Localization and Functional Activity of the Main Hepatobiliary Transporters in HepaRG Cells and Primary Human Hepatocytes. Toxicol Sci 145:157–168.
Barst RJ (2007) A review of pulmonary arterial hypertension: role of ambrisentan.
Vasc Health Risk Manag 3:11–22.
Ben-Yehuda O, Pizzuti D, Brown A, Littman M, Gillies H, Henig N, and Peschel T (2012) Long-Term Hepatic Safety of Ambrisentan in Patients With Pulmonary Arterial Hypertension. J Am Coll Cardiol 60:80–81.
Bolli MH, Boss C, Binkert C, Buchmann S, Bur D, Hess P, Iglarz M, Meyer S, Rein J, Rey M, Treiber A, Clozel M, Fischli W, and Weller T (2012) The discovery of
N-[5-(4-bromophenyl)-6-[2-[(5-bromo-2-pyrimidinyl)oxy]ethoxy]-4-pyrimidinyl]-N’-propylsulfamide (Macitentan), an orally active, potent dual endothelin receptor antagonist. J Med Chem 55:7849–7861.
Bruderer S, Hopfgartner G, Seiberling M, Wank J, Sidharta PN, Treiber A, and Dingemanse J (2012) Absorption, distribution, metabolism, and excretion of macitentan, a dual endothelin receptor antagonist, in humans. Xenobiotica
42:901–910.
Burbank MG, Burban A, Sharanek A, Weaver RJ, Guguen-Guillouzo C, and Guillouzo A (2016) Early alterations of bile canaliculi dynamics and the ROCK/MLCK pathway are characteristics of drug-induced intrahepatic cholestasis. Drug Metab Dispos 44:1780-1793.
Cerec V, Glaise D, Garnier D, Morosan S, Turlin B, Drenou B, Gripon P, Kremsdorf D, Guguen-Guillouzo C, and Corlu A (2007) Transdifferentiation of hepatocyte-like cells from the human hepatoma HepaRG cell line through bipotent progenitor. Hepatology 45:957–967.
Chaumais M-C, Guignabert C, Savale L, Jaïs X, Boucly A, Montani D, Simonneau G, Humbert M, and Sitbon O (2015) Clinical pharmacology of endothelin receptor antagonists used in the treatment of pulmonary arterial hypertension. Am J
Cardiovasc Drugs 15:13–26.
Croxtall JD, and Keam SJ (2008) Ambrisentan. Drugs 68:2195–2204.
D’Alonzo GE, Barst RJ, Ayres SM, Bergofsky EH, Brundage BH, Detre KM, Fishman AP, Goldring RM, Groves BM, and Kernis JT (1991) Survival in patients with primary pulmonary hypertension. Results from a national prospective registry.
Ann Intern Med 115:343–349.
Davenport AP, and Battistini B (2002) Classification of endothelin receptors and antagonists in clinical development. Clin Sci 1979 103 Suppl 48:1S–3S.
Dawson S, Stahl S, Paul N, Barber J, and Kenna JG (2012) In vitro inhibition of the bile salt export pump correlates with risk of cholestatic drug-induced liver injury in humans. Drug Metab Dispos 40:130–138.
de Abajo FJ, Montero D, Madurga M, and García Rodríguez LA (2004) Acute and clinically relevant drug-induced liver injury: a population based case-control study. Br J Clin Pharmacol 58:71–80.
Dhaun N, Melville V, Kramer W, Stavros F, Coyne T, Swan S, Goddard J, and Webb DJ (2007) The pharmacokinetic profile of sitaxsentan, a selective endothelin receptor antagonist, in varying degrees of renal impairment. Br J Clin
Pharmacol 64:733–737.
Dhillon S, and Keating GM (2009) Bosentan: a review of its use in the management of mildly symptomatic pulmonary arterial hypertension. Am J Cardiovasc
Drugs 9:331–350.
Donner MG, and Keppler D (2001) Up-regulation of basolateral multidrug resistance protein 3 (Mrp3) in cholestatic rat liver. Hepatology 34:351–359.
Dupuis J, and Hoeper MM (2008) Endothelin receptor antagonists in pulmonary arterial hypertension. Eur Respir J 31:407–415.
Erve JCL, Gauby S, Maynard JW, Svensson MA, Tonn G, and Quinn KP (2013) Bioactivation of Sitaxentan in Liver Microsomes, Hepatocytes, and Expressed
Human P450s with Characterization of the Glutathione Conjugate by Liquid Chromatography Tandem Mass Spectrometry. Chem Res Toxicol 26:926– 936.
Fattinger K, Funk C, Pantze M, Weber C, Reichen J, Stieger B, and Meier PJ (2001) The endothelin antagonist bosentan inhibits the canalicular bile salt export pump: a potential mechanism for hepatic adverse reactions. Clin Pharmacol
Ther 69:223–231.
Fouassier L, Kinnman N, Lefèvre G, Lasnier E, Rey C, Poupon R, Elferink RPJO, and Housset C (2002) Contribution of mrp2 in alterations of canalicular bile formation by the endothelin antagonist bosentan. J Hepatol 37:184–191.
Fukumoto Y, Yamada N, Matsubara H, Mizoguchi M, Uchino K, Yao A, Kihara Y, Kawano M, Watanabe H, Takeda Y, Adachi T, Osanai S, Tanabe N, Inoue T, Kubo A, Ota Y, Fukuda K, Nakano T, and Shimokawa H (2013) Double-blind, placebo-controlled clinical trial with a rho-kinase inhibitor in pulmonary arterial hypertension. Circ J 77:2619–2625.
Galiè N, Hoeper MM, Gibbs JSR, and Simonneau G (2011) Liver toxicity of sitaxentan in pulmonary arterial hypertension. Eur Respir J 37:475–476.
Gatfield J, Grandjean CM, Sasse T, Clozel M, and Nayler O (2012) Slow Receptor Dissociation Kinetics Differentiate Macitentan from Other Endothelin Receptor Antagonists in Pulmonary Arterial Smooth Muscle Cells. PLOS One 7:e47662.
Ghofrani HA, Distler O, Gerhardt F, Gorenflo M, Grünig E, Haefeli WE, Held M, Hoeper MM, Kähler CM, Kaemmerer H, Klose H, Köllner V, Kopp B, Mebus S, Meyer A, Miera O, Pittrow D, Riemekasten G, Rosenkranz S, Schranz D,
Voswinckel R, and Olschewski H (2011) Treatment of pulmonary arterial hypertension (PAH): updated Recommendations of the Cologne Consensus Conference 2011. Int J Cardiol 154 Suppl 1:S20–33.
Hartman JC, Brouwer K, Mandagere A, Melvin L, and Gorczynski R (2010) Evaluation of the endothelin receptor antagonists ambrisentan, darusentan, bosentan, and sitaxsentan as substrates and inhibitors of hepatobiliary transporters in sandwich-cultured human hepatocytes. Can J Physiol
Pharmacol 88:682–691.
Humbert M, Sitbon O, and Simonneau G (2004) Treatment of pulmonary arterial hypertension. N Engl J Med 351:1425–1436.
Kenna JG (2014) Current Concepts in Drug-Induced Bile Salt Export Pump (BSEP) Interference. Curr Protoc Toxicol 61:23.7.1–15.
Köck K, Ferslew BC, Netterberg I, Yang K, Urban TJ, Swaan PW, Stewart PW, and Brouwer KLR (2014) Risk factors for development of cholestatic drug-induced liver injury: inhibition of hepatic basolateral bile acid transporters multidrug resistance-associated proteins 3 and 4. Drug Metab Dispos 42:665–674.
Lavelle A, Sugrue R, Lawler G, Mulligan N, Kelleher B, Murphy DM, and Gaine SP (2009) Sitaxentan-induced hepatic failure in two patients with pulmonary arterial hypertension. Eur Respir J 34:770–771.
Lepist E-I, Gillies H, Smith W, Hao J, Hubert C, Claire III RLS, Brouwer KR, and Ray AS (2014) Evaluation of the endothelin receptor antagonists ambrisentan, bosentan, macitentan, and sitaxsentan as hepatobiliary transporter inhibitors and substrates in sandwich-cultured human hepatocytes. PloS One 9:e87548.
Lin Y-L, Wu Y-C, Gau C-S, and Lin M-S (2012) Value of preapproval safety data in predicting postapproval hepatic safety and assessing the legitimacy of class warning. Ther Adv Drug Saf 3:13–24.
Liu A-J, Ling F, Wang D, Wang Q, Lü X-D, and Liu Y-L (2011) Fasudil inhibits platelet-derived growth factor-induced human pulmonary artery smooth muscle cell proliferation by up-regulation of p27kip1 via the ERK signal pathway. Chin Med J 124:3098–3104.
Mano Y, Usui T, and Kamimura H (2007) Effects of bosentan, an endothelin receptor antagonist, on bile salt export pump and multidrug resistance–associated protein 2. Biopharm Drug Dispos 28:13–18.
Matsunaga N, Kaneko N, Staub AY, Nakanishi T, Nunoya K, Imawaka H, and Tamai I (2016) Analysis of the Metabolic Pathway of Bosentan and of the Cytotoxicity of Bosentan Metabolites Based on a Quantitative Modeling of Metabolism and Transport in Sandwich-Cultured Human Hepatocytes. Drug Metab Dispos
44:16–27.
McLaughlin VV, Davis M, and Cornwell W (2011) Pulmonary arterial hypertension.
Curr Probl Cardiol 36:461–517.
Miao L, Dai Y, and Zhang J (2002) Mechanism of RhoA/Rho kinase activation in endothelin-1- induced contraction in rabbit basilar artery. Am J Physiol Heart
Circ Physiol 283:H983–989.
Monaco TJ, and Davila CD (2016) Safety, efficacy, and clinical utility of macitentan in the treatment of pulmonary arterial hypertension. Drug Des Devel Ther
Morgan RE, van Staden CJ, Chen Y, Kalyanaraman N, Kalanzi J, Dunn RT, Afshari CA, and Hamadeh HK (2013) A multifactorial approach to hepatobiliary transporter assessment enables improved therapeutic compound development. Toxicol Sci 136:216–241.
Owen K, Cross DM, Derzi M, Horsley E, and Stavros FL (2012) An overview of the preclinical toxicity and potential carcinogenicity of sitaxentan (Thelin®), a potent endothelin receptor antagonist developed for pulmonary arterial hypertension. Regul Toxicol Pharmacol 64:95–103.
Pauli-Magnus C, and Meier PJ (2006) Hepatobiliary transporters and drug-induced cholestasis. Hepatology 44:778–787.
Peacock AJ, Murphy NF, McMurray JJV, Caballero L, and Stewart S (2007) An epidemiological study of pulmonary arterial hypertension. Eur Respir J
30:104–109.
Pedersen JM, Matsson P, Bergström CAS, Hoogstraate J, Norén A, LeCluyse EL, and Artursson P (2013) Early identification of clinically relevant drug interactions with the human bile salt export pump (BSEP/ABCB11). Toxicol Sci
136:328–343.
Pernelle K, Le Guevel R, Glaise D, Stasio CG-D, Le Charpentier T, Bouaita B, Corlu A, and Guguen-Guillouzo C (2011) Automated detection of hepatotoxic compounds in human hepatocytes using HepaRG cells and image-based analysis of mitochondrial dysfunction with JC-1 dye. Toxicol Appl Pharmacol
254:256–266.
Z-C, Le Brun F-O, Mehta S, Mittelholzer CM, Perchenet L, Sastry BKS, Sitbon O, Souza R, Torbicki A, Zeng X, Rubin LJ, and Simonneau G (2013) Macitentan and Morbidity and Mortality in Pulmonary Arterial Hypertension. N
Engl J Med 369:809–818.
Qiu X, Zhang Y, Liu T, Shen H, Xiao Y, Bourner MJ, Pratt JR, Thompson DC, Marathe P, Humphreys WG, and Lai Y (2016) Disruption of BSEP Function in HepaRG Cells Alters Bile Acid Disposition and Is a Susceptive Factor to Drug-Induced Cholestatic Injury. Mol Pharm 13:1206–1216.
Raja SG (2010) Macitentan, a tissue-targeting endothelin receptor antagonist for the potential oral treatment of pulmonary arterial hypertension and idiopathic pulmonary fibrosis. Curr Opin Investig Drugs 2000 11:1066–1073.
Sharanek A, Azzi PB-E, Al-Attrache H, Savary CC, Humbert L, Rainteau D, Guguen-Guillouzo C, and Guguen-Guillouzo A (2014) Different dose-dependent mechanisms are involved in early cyclosporine a-induced cholestatic effects in hepaRG cells. Toxicol Sci 141:244–253.
Sharanek A, Burban A, Burbank M, Le Guevel R, Li R, Guillouzo A, and Guguen-Guillouzo C (2016) Rho-kinase/myosin light chain kinase pathway plays a key role in the impairment of bile canaliculi dynamics induced by cholestatic drugs.
Sci Rep 6:24709.
Sidharta PN, Krähenbühl S, and Dingemanse J (2015) Pharmacokinetic and pharmacodynamic evaluation of macitentan, a novel endothelin receptor antagonist for the treatment of pulmonary arterial hypertension. Expert Opin
Sidharta PN, van Giersbergen PLM, Halabi A, and Dingemanse J (2011) Macitentan: entry-into-humans study with a new endothelin receptor antagonist. Eur J Clin
Pharmacol 67:977–984.
Simonneau G, Galiè N, Jansa P, Meyer GMB, Al-Hiti H, Kusic-Pajic A, Lemarié J-C, Hoeper MM, and Rubin LJ (2014) Long-term results from the EARLY study of bosentan in WHO functional class II pulmonary arterial hypertension patients.
Int J Cardiol 172:332–339.
Sood N (2014) Macitentan for the treatment of pulmonary arterial hypertension.
Expert Opin Pharmacother 15:2733–2739.
Stavros F, Kramer WG, and Wilkins MR (2010) The effects of sitaxentan on sildenafil pharmacokinetics and pharmacodynamics in healthy subjects. Br J Clin
Pharmacol 69:23–26.
Takatsuki S, Rosenzweig EB, Zuckerman W, Brady D, Calderbank M, and Ivy DD (2013) Clinical safety, pharmacokinetics, and efficacy of ambrisentan therapy in children with pulmonary arterial hypertension. Pediatr Pulmonol 48:27–34.
Treiber A, Schneiter R, Hausler S, and Stieger B (2007) Bosentan Is a Substrate of Human OATP1B1 and OATP1B3: Inhibition of Hepatic Uptake as the Common Mechanism of Its Interactions with Cyclosporin A, Rifampicin, and Sildenafil. Drug Metab Dispos 35:1400–1407.
Velayati A, Valerio MG, Shen M, Tariq S, Lanier GM, and Aronow WS (2016) Update on pulmonary arterial hypertension pharmacotherapy. Postgrad Med 128:460– 473.
Weiss J, Theile D, Spalwisz A, Burhenne J, Riedel K-D, and Haefeli WE (2013) Influence of sildenafil and tadalafil on the enzyme- and transporter-inducing effects of bosentan and ambrisentan in LS180 cells. Biochem Pharmacol
85:265–273.
Legends to figures
Fig. 1. Cytotoxicity of tested 4 ERAs. HepaRG cells were treated with different
concentrations of the 4 ERAs in the absence (A) or presence (B) of ABT (300µM) for 24h. Cytotoxicity was measured by the MTT colorimetric assay. Each point is the mean +/- SEM of three independent experiments. Data were considered as significantly different from the cells treated only with ABT when #P < 0.05. Data were
Fig. 2. Effect of drugs on bile canaliculi dynamics. (A) Phase-contrast
micrographs of HepaRG cells exposed to 100µM of each drug at 3 different time-points. Arrows show BC dilatation. (B) BC surfaces of control and treated cells quantified on the basis of brightness parameters. White canalicular lumen was quantified using image-J software every 10 min. Data were expressed relative to untreated cells, arbitrarily set at 100%. Data represent the means ± SEM of three independent experiments. Dilatators at least transiently enlarged BC >125%. (C) F-actin localization using rhodamine-phalloidin fluoroprobe (red). Junctional ZO-1 immunolabeling (green) in control and treated cells. Nuclei stained using the Hoechst dye. Fluorescence appears white in black and white micrographs (D) Phase-contrast micrographs of HepaRG cells at 0 and 120min. Cells were exposed to different drug concentrations. Arrows show BC dilatation. Bar = 30 µM.
Fig. 3. Effects of drugs on MLC2 phosphorylation state and BC morphology. A)
Representative western blots of p-MLC2 compared to HSC70 at 1, 2 and 3h in
ERA-treated cells. (B) Graphical representation of MLC2
phosphorylation/dephosphorylation quantification using fusion-CAPT software. Data are expressed in arbitrary units (A.U) and represent means ± SEM of 3 independent experiments. One hour treatment was arbitrarily set at a fixed value of 2.5 for all drugs. Data were considered significantly different when *P < 0.05. (C, D) Cells treated with 100µM BOS or MAC +/- 5µM CaM for 2h. Phase-contrast images and BC surface quantification as described in Figure 2B. Arrows show BC dilatation. Bar = 30 µM.
Fig. 4. Drug effects on total BA disposition and TCA influx and clearance. (A-D)
BAs measured in supernatants (nM) and cell layers (pmol/mg proteins) after treatment with different drug concentrations for 4 and 24h and in corresponding controls. Data were normalized relative to the amount of proteins. (E) [3H]-TCA clearance in cells treated with different drug concentrations after 2h. (F) [3H]-TCA clearance with additional SIT concentrations after 2h. (G), (H) [3H]-TCA influx in treated cells at 2 and 24h. Values represent the sum of mean ± SEM of duplicate measurements in 3 independent experiments; *P <0.05 compared with values in corresponding controls.
Fig. 5. MRP3 and MRP2 distribution and MRP2 functional activity. Differentiated
HepaRG cells were fixed after 2h treatment and incubated with primary antibodies against MRP3 and MRP2 (green fluorescence). MRP2 activity was estimated using CDFDA. Efflux of fluorescent CDF, a substrate of MRP2, characterized by accumulation of green fluorescence into bile canaliculi, was evaluated in standard buffer. Nuclei stained using the Hoechst dye. Immunofluorescence images were obtained with a Cellomics ArrayScan VTI HCS Reader. Fluorescence appears white in black and white micrographs. Bar = 30 µm.
List of abbreviations:
ABT, 1-Aminobenzotriazole; AMB, ambrisentan; BA, bile acid; BC, bile canaliculi; BOS, bosentan; BSEP, bile salt export pump; CA, cholic acid; CaM, calmodulin; CDCA, chenodeoxycholic acid; CDFDA, 5 (and 6)-carboxy-2',7'-dichlorofluorescein diacetate; CYP, cytochrome P450; ERA, endothelin receptor antagonist; ETA,
endothelin A receptor; ETB, endothelin B receptor ; MAC, macitentan; MLC2, myosin
light chain subunit-2; MLCK, myosin light chain kinase; MTT,
methylthiazoletetrazolium; MRP 2,3,4, multidrug resistance-associated protein 2,3,4; OATP-B, organic anion transporting polypeptide; PAH, Pulmonary arterial
hypertension; ROCK, RhoA/Rho-kinase; RT-qPCR, real-time quantitative polymerase chain reaction; TCA, taurocholic acid; [3H]-TCA, [3H]-taurocholic acid; SIT,
sitaxentan; ZO-1, Zona-occludens protein 1.
Tables
Table 1. Characteristics of the 4 ERAs.
The list of compounds, their affinity to the 2 endothelin receptors, Cmax (µM), half-lives, dosing, clinical hepatic effects and some results obtained in vitro with either vesicles overexpressing human BA transporters (*) or liver cells (**) are displayed. Cmax values and in vitro results are from the literature (see references).
Compound Affinity Cmax Half life (t1/2) Dosi ng Clinical hepatic effects In vitro hepatic effects References Ambrisenta n Selective for ETA 2-3.2 15h 5 mg or 10 mg once a day No evidence of hepatotoxicity; better hepatic safety profile than for other ERAs. No modulation of MRP2, Pgp or BSEP** (Barst, 2007; Ben-Yehuda et al., 2012; Takatsuki et al., 2013) Bosentan Dual antagonis t (50xETA) 6.75 5h 62.5 mg then 125 mg twice a day Elevated transaminases ; increase in serum bile acids
BSEP and NTCP inhibition*;** ; substrate for OATP. NTCP and MRP2** (Fattinger et al., 2001; Mano et al., 2007; Treiber et al., 2007; Dhillon and Keating, 2009; Hartman et al., 2010) Livertox website Macitentan Dual antagonis t (100xEA) 0.13-0.75 16h 10 mg once a day Increased liver weight ; centrilobular hypertrophy BSEP and NTCP inhibition* ; hepatic disposition mainly driven by passive diffusion (Ahn et al., 2014; Lepist et al., 2014) Livertox website Sitaxentan Selective for ETA (6000xETA) 22 10h 100 mg once a day Elevated transaminases ; dose-related increase in liver weight (centrilobular hypertrophy and necrosis) NTCP and OATP transport Inhibition** ; CYP3A4 inhibition (Dhaun et al., 2007; Lavelle et al., 2009; Hartman et al., 2010; Stavros et al., 2010; Galiè et al., 2011; Erve et al., 2013; Chaumais et al., 2015)
Table 2. Effects of the 4 drugs on transcript levels of the basolateral transporters.
HepaRG cells were exposed to the 4 drugs at the indicated concentration (i.e. 10, 50 or 100µM) for 24h. mRNA levels were measured by RT-PCR analysis. All results are expressed relative to the levels found in control cells, arbitrarily set at a value of 1.
Bile acids transporters BSEP (ABCB1) NTCP (SLC10A1) OATP-B (SLC21A9) MRP2 (ABCC2) MRP3 (ABCC3) MRP4 (ABCC4) AMB 10 µM 0.88 ± 0.08 0.87± 0.07 1.03±0.13 1.00±0.12 0.99±0.09 1.04±0.06 50 µM 0.94±0.09 0.89±0.09 1.01±0.09 1.12±0.07 1.06±0.11 1.09±0.07 100 µM 1.00±0.1 0.99±0.11 0.97 ± 0.02 1.14±0.15 1.08±0.16 1.14±0.07 BOS 10 µM 0.59± 0.04* 0.82± 0.09 0.95±0.12 1.35±0.23 0.84±0.08 1.16±0.12 50 µM 0.23±0.04* 0.45±0.10* 0.50±0.10* 1.17±0.03 0.60±0.08* 1.01±0.11 100 µM 0.11±0.01* 0.23±0.06* 0.41±0.07* 0.99±0.16 0.62±0.09* 1.08±0.16 MAC 10 µM 0.73± 0.05 0.72± 0.06 1.07±0.12 1.49±0.18* 1.00±0.07 1.04±0.08 50 µM 0.69±0.18 0.50±0.06* 0.99±0.07 1.46±0.15* 0.98±0.08 1.13±0.09 100 µM 0.40±0.7* 0.22±0.05* 0.78±0.12 1.78±0.19* 0.89±0.23 1.34±0.06 SIT 10 µM 0.97±0.16 0.78±0.06 0.98±0.04 1.23±0.04 0.92±0.01 1.05±0.01 50 µM 0.88±0.10 0.50±0.04* 0.95±0.09 1.37±0.18 1.02±0.17 1.07±0.05 100 µM 0.91 ± 0.22 0.23± 0.05* 0.90±0.27 1.53±0.23 1.04±0.18 1.22±0.10
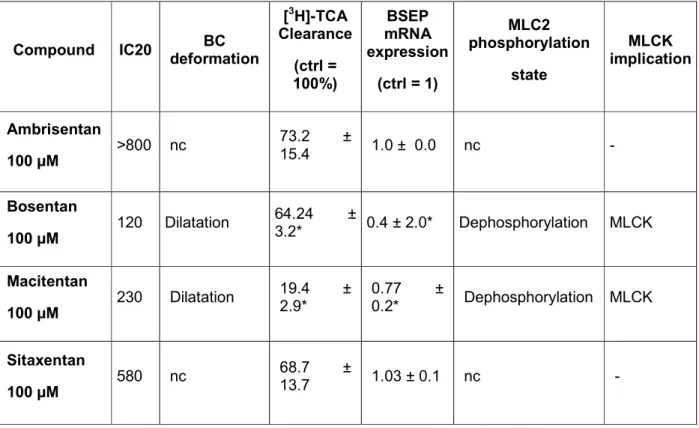
Table 3. Summary of the results on the 4 ERAs.
IC20 (µM), BC deformation (i.e. constriction or dilatation), [3H]-TCA clearance (control=100%), BSEP mRNA expression (control=1), MLC2 phosphorylation state and MLCK implication are summarized. BC, bile canaliculi; ROCK, Rho-kinase; MLCK, myosin light chain kinase; nc: no change.
Compound IC20 BC deformation [3H]-TCA Clearance (ctrl = 100%) BSEP mRNA expression (ctrl = 1) MLC2 phosphorylation state MLCK implication Ambrisentan 100 µM >800 nc 73.2 ± 15.4 1.0 ± 0.0 nc - Bosentan 100 µM 120 Dilatation 64.24 ± 3.2* 0.4 ± 2.0* Dephosphorylation MLCK Macitentan 100 µM 230 Dilatation 19.4 ± 2.9* 0.77 ± 0.2* Dephosphorylation MLCK Sitaxentan 100 µM 580 nc 68.7 ± 13.7 1.03 ± 0.1 nc -
Fig. 1. Cytotoxicity of tested 4 ERAs. HepaRG cells were treated with different concentrations of the 4 ERAs in the absence (A) or presence (B) of ABT (300µM) for 24h. Cytotoxicity was measured by the MTT colorimetric assay. Each point is the mean +/- SEM of three independent experiments. Data were considered
as significantly different from the cells treated only with ABT when #P < 0.05. Data were considered as significantly different from the control when *P < 0.05.
Fig. 2. Effect of drugs on bile canaliculi dynamics. (A) Phase-contrast micrographs of HepaRG cells exposed to 100µM of each drug at 3 different time-points. Arrows show BC dilatation. (B) BC surfaces of control and treated cells quantified on the basis of brightness parameters. White canalicular lumen was quantified using image-J software every 10 min. Data were expressed relative to untreated cells, arbitrarily set at 100%. Data represent the means ± SEM of three independent experiments. Dilatators at least transiently enlarged
BC >125%. (C) F-actin localization using rhodamine-phalloidin fluoroprobe (red). Junctional ZO-1 immunolabeling (green) in control and treated cells. Nuclei stained using the Hoechst dye. Fluorescence appears white in black and white micrographs (D) Phase-contrast micrographs of HepaRG cells at 0 and 120min. Cells were exposed to different drug concentrations. Arrows show BC dilatation. Bar = 30 µM.
Fig. 3. Effects of drugs on MLC2 phosphorylation state and BC morphology. A) Representative western blots of p-MLC2 compared to HSC70 at 1, 2 and 3h in ERA-treated cells. (B) Graphical representation of MLC2
phosphorylation/dephosphorylation quantification using fusion-CAPT software. Data are expressed in arbitrary units (A.U) and represent means ± SEM of 3 independent experiments. One hour treatment was
arbitrarily set at a fixed value of 2.5 for all drugs. Data were considered significantly different when *P < 0.05. (C, D) Cells treated with 100µM BOS or MAC +/- 5µM CaM for 2h. Phase-contrast images and BC
surface quantification as described in Figure 2B. Arrows show BC dilatation. Bar = 30 µM. 244x296mm (300 x 300 DPI)
Fig. 4. Drug effects on total BA disposition and TCA influx and clearance. (A-D) BAs measured in supernatants (nM) and cell layers (pmol/mg proteins) after treatment with different drug concentrations for 4 and 24h and in corresponding controls. Data were normalized relative to the amount of proteins. (E)
[3H]-TCA clearance in cells treated with different drug concentrations after 2h. (F) [3H]-[3H]-TCA clearance with additional SIT concentrations after 2h. (G), (H) [3H]-TCA influx in treated cells at 2 and 24h. Values represent the sum of mean ± SEM of duplicate measurements in 3 independent experiments; *P <0.05
compared with values in corresponding controls. 243x328mm (300 x 300 DPI)
Fig. 5. MRP3 and MRP2 distribution and MRP2 functional activity. Differentiated HepaRG cells were fixed after 2h treatment and incubated with primary antibodies against MRP3 and MRP2 (green fluorescence). MRP2 activity was estimated using CDFDA. Efflux of fluorescent CDF, a substrate of MRP2, characterized by
accumulation of green fluorescence into bile canaliculi, was evaluated in standard buffer. Nuclei stained using the Hoechst dye. Immunofluorescence images were obtained with a Cellomics ArrayScan VTI HCS
Reader. Fluorescence appears white in black and white micrographs. Bar = 30 µm. 191x292mm (300 x 300 DPI)