HAL Id: hal-00699837
https://hal.archives-ouvertes.fr/hal-00699837v2
Preprint submitted on 10 Sep 2012
HAL is a multi-disciplinary open access
archive for the deposit and dissemination of
sci-entific research documents, whether they are
pub-lished or not. The documents may come from
teaching and research institutions in France or
abroad, or from public or private research centers.
L’archive ouverte pluridisciplinaire HAL, est
destinée au dépôt et à la diffusion de documents
scientifiques de niveau recherche, publiés ou non,
émanant des établissements d’enseignement et de
recherche français ou étrangers, des laboratoires
publics ou privés.
accretion versus feedback at low and high z
Sébastien Peirani, Intae Jung, Joe Silk, Christophe Pichon
To cite this version:
Sébastien Peirani, Intae Jung, Joe Silk, Christophe Pichon. Evolution of the baryon fraction in the
Local Group: accretion versus feedback at low and high z. 2012. �hal-00699837v2�
Evolution of the baryon fraction in the Local Group:
accretion versus feedback at low and high z
S´
ebastien Peirani
1⋆, Intae Jung
1,2, Joseph Silk
1,3and Christophe Pichon
1,41Institut d’Astrophysique de Paris (UMR 7095: CNRS & UPMC), 98 bis Bd Arago, 75014 Paris, France
2Department of Astronomy, Yonsei University, Seoul 120-749, Korea
3Department of Physics, University of Oxford, Denys Wilkinson Building, Keble Road, Oxford OX1 3RH, UK
4Institut de Physique Th´eorique, Orme des Merisiers, batiment 774, CEA/Saclay F-91191 Gif-sur-Yvette, France.
10 September 2012
ABSTRACT
Using hydrodynamical zoom simulations in the standard ΛCDM cosmol-ogy, we investigate the evolution of the distribution of baryons (gas and stars) in a local group-type universe.
First, with standard star formation and supernova feedback prescriptions, we find that the mean baryonic fraction value estimated at the virial radius of the two main central objects (i.e. the Milky Way and Andromeda) is decreasing over time, and is 10-15% lower than the universal value, 0.166, at z = 0. This decrease is mainly due to the fact that the amount of accretion of dissipative gas onto the halo, especially at low redshift, is in general much lower than that of the dissipationless dark matter. Indeed, a significant part of the baryons does not collapse onto the haloes and remains in their outskirts, mainly in the form of warm-hot intergalactic medium (WHIM). Moreover, during the formation of each object, some dark matter and baryons are also expelled through merger events via tidal disruption. In contrast to baryons, expelled dark matter can be more efficiently re-accreted onto the halo, enhancing both the reduction of
fb inside Rv, and the increase of the mass of WHIM outside Rv. Varying the
efficiency of supernovae feedback at low redshift does not seem to significantly affect these trends.
Alternatively, when a significant fraction of the initial gas in the main objects is released at high redshifts by more powerful sources of feedback, such as AGN from intermediate mass black holes in lower mass galaxies, the baryonic
fraction at the virial radius can have a lower value (fb∼ 0.12) at low redshift.
Hence physical mechanisms able to drive the gas out of the virial radius at high redshifts will have a stronger impact on the deficit of baryons in the mass budget of Milky Way type-galaxies at present times than those that expel the gas in the longer, late phases of galaxy formation.
Key words: Galaxies: Local Group – Galaxies: haloes – Dark matter –
Methods: N-body simulations
1 INTRODUCTION
The distribution of galaxies in the Universe on large scales, as revealed by sky surveys such as the CFA Red-shift Survey (Geller & Huchra 1989), the 2DF Galaxy Redshift Survey (Colless et al. 2001) or the Sloan Dig-ital Sky Survey (Gott et al. 2005) is structured into a
⋆ E-mail: peirani@iap.fr
filamentary web in which the intersections correspond to the most massive objects (i.e. galaxy clusters, Bond et al. 1996). This specific distribution is now commonly and easily reproduced by cosmological hydrodynamical N-body simulations of the ΛCDM cosmology which also indicate that the distribution of dark matter, the dom-inant mass component of the Universe (Komatsu et al. 2011), follows the same trend. Indeed, since in the tradi-tional picture of galaxy formation, galaxies are supposed
to form when baryonic gas falls into the gravitational potential of their host dark matter halo, the distribution of dark matter is therefore expected to faithfully trace that of the baryons. However on galactic scales, obser-vations tend to suggest that the spatial distributions of dark matter and baryons (especially in the form of gas) may display some substantial differences. In particular, it has been shown that galaxies are missing most of their baryons, – most galaxies are severely baryons-depleted relative to the cosmological fraction (see for instance Bell et al. 2003; Hoekstra et al. 2005; McGaugh 2010).
This so-called “missing baryons problem” (see Bregman 2007 for a complete review), if real, calls for two alternative scenarios. Either a significant part of the gas never collapsed into the gravitational potential wells of protogalaxies in the first place, or some of the gas has been expelled by galaxy formation feedback pro-cesses such as supernova winds. Hence solving the miss-ing baryon problem may prove to be central in order to constrain galaxy formation models.
Past studies based on hydrodynamical simulations indicate that most of the “missing” baryons might lie in a gaseous phase (the so-called warm-hot intergalac-tic medium, hereafter WHIM) in the temperature range
105− 107 K and at moderate over-density (Cen &
Os-triker 1999; Dav´e et al. 2001; Cen & OsOs-triker 2006). Ac-cording to these studies, the WHIM is primarily shock-heated during the formation of large-scale structures, while feedback mechanisms associated with star for-mation should also have an additional impact on this phase during galaxy formation. For instance, for low mass systems, the cosmological UV-background is sup-posed to reduce both the star formation and baryon content (Thoul & Weinberg 1996; Bullock, Kravtsov & Weinberg 2000; Gnedin 2000; Somerville 2002; Ricotti, Gnedin & Shull 2002; Benson et al. 2002; Read, Pontzen & Viel 2006; Hoeft et al. 2006; Okamoto, Gao & The-uns 2008; Peirani 2010; Nickerson et al. 2011, Hambrick et al. 2011a). Supernova feedback is also expected to expel some gas, especially for low mass systems, as sug-gested by various numerical investigations (Scannapieco et al. 2008, 2009; Faucher-Gigu`ere, Kereˇs & Ma 2011 and references therein). Other mechanisms have been proposed, such as turbulence in the baryonic intergalac-tic medium (Zhu, Feng & Fang 2011) or pre-heating by pre-virialisation (Mo et al. 2005), although Crain et al. (2007) claimed that this process is unable to prevent the collapse of gas (instead, according to these authors, non-gravitational feedback is required in order to re-duce the efficiency of gas cooling and star formation in dwarf galaxies). Another less investigated potential mechanism, which may also affect the evolution of the distribution of baryons on small scales, is the effect of accretion and merger events (and in particular their as-sociated tidal disruption) that are expected to be fre-quent in the framework of the hierarchical model. For instance, in an early paper, Navarro & White (1993) have shown that during a merger involving dark matter and adiabatic gas, there is a transfer of energy between these two components that leads to a situation where the gas is less tightly bound. More recently, Sinha & Holley-Bockelmann (2010, 2011) found that a few
per-cent of gas can be driven into the intergalactic medium (IGM) by galaxy mergers, using either merger trees cal-culated from the Press-Schechter formalism or idealized simulations of mergers of galaxy clusters. Using hydro-dynamical simulations, Nickerson et al. (2011) have also concluded that tidal forces may cause significant mass loss from satellites of all masses.
In the present work, we make use of cosmological “zoom” simulations with an extended treatment of the physics of baryons to study the formation of Milky Way-like galaxies. Our aim is to characterise the relative role of supernova feedback to accretion and mergers in the evolution of the distribution of baryons for objects of such masses. We will also test scenarios in which a sig-nificant fraction of gas in progenitors is expelled at high redshift by more powerful sources of feedback, such as AGN associated with massive black holes. This will low us to quantify two distinct processes which may al-low us to address the so-called missing baryon problem, should it persist.
This paper is organised as follows. In section 2, we summarize the numerical modelling, and section 3 presents our main results on the evolution of the distri-bution of baryons in our simulated local group universes. We give our main conclusions in the last section.
2 NUMERICAL MODELLING
2.1 Initial conditions and simulation
The numerical methodology used in the present paper is described in detail in Peirani (2010) to which we refer the reader for more information. For the sake of clarity, we summarize the main steps below.
We analyse three cosmological zoom simulations for a ΛCDM universe using WMAP5 parameters
(Ko-matsu et al. 2009), namely ΩM = 0.274, ΩΛ = 0.726,
Ωb = 0.0456, H0 = 70.5 km/s/Mpc, n = 0.96 and
σ8= 0.812. Each simulation was performed in a periodic
box of side 100 h−1 Mpc with 2 × 20483 effective dark
matter and gas particles in the highest resolution region
(a sphere of 7 h−1 Mpc of radius). In this region of
in-terest, the mass resolution are mDM≈ 7.4 × 10⁶h−1M⊙
and mgas= mstars≈ 1.5 × 10⁶h−1M⊙. The
Plummer-equivalent force softening adopted for the high mass
res-olution particles were 1 and 0.5 h−1kpc for dark matter
and gas particles respectively and were kept constant in comoving units.
Initial conditions have been generated from the MPgrafic code (Prunet et al. 2008) and the simulations were performed using GADGET2 (Springel 2005), with added prescriptions for metal-dependent cooling, star formation (in this work we remind that the star forma-tion efficiency is c∗=0.02), feedback from Type Ia and II
supernovae (SN), UV background (starting at z = 8.5) and metal enrichment. The three simulations have com-mon initial conditions whose phases are consistent with the local group but essentially differ in the quantity of energy released by SN derived from star particles i (Ei).
As mentioned in Peirani (2010), we consider that a
frac-tion γ of this energy is deposited in the jth neighbour
gas particle by applying a radial kick to its velocity
with a magnitude ∆vj=p(2wjγEi/mj), where wj is
the weighting based on the smoothing kernel and mjis
the mass of gas particle j. The first simulation Sim1a
uses the standard value of γ = 0.1 while in the
sec-ond one, Sim1b, we have considered a higher efficiency
γ = 1.0 in order to investigate how our results would be affected. In the third simulation (Sim2), our aim is to study the effects of earlier high energy ejection to the ISM induced either by intermediate mass black holes or other high energy processes such as hypernovae events. Intermediate mass black holes are the likely missing link between Population III and the supermassive black holes in quasars and plausibly as part of the hierar-chy of structure formation. Hypernovae are likely to be more prevalent than normal supernovae in the earliest phases of star formation: for example, the Population III IMF is most likely top-heavy, and this may also be the norm for the precursors of spheroids, as evidenced for example by the radial distribution of SNe in disturbed (including recently merged) galaxies (Habergham, An-derson & James 2010) and the frequency of low mass x-ray binaries in ultracompact dwarf galaxies (Dabring-hausen et al. 2012). A higher frequency of hypernovae could plausibly provide an order-of-magnitude higher feedback efficiency than supernovae. The case of AGN is intriguing, as even higher feedback is required in deep potential wells, where supernovae are relatively ineffi-cient, in order to account for the correlation between black hole mass and spheroid velocity dispersion (Silk & Nusser 2010; Debuhr et al. 2012). Moreover, the recent detection of a massive gas outflow in a distant quasar (z = 6.4) strongly suggests that a strong quasar ac-tivity is already in place at very early times (Maiolino et al. 2012). For this purpose, a simple modelling was used in which a much higher efficiency (γ = 50) was considered during a very short (∆t ∼ 45 Myr) at ear-lier times (z ∼ 8.0) and γ = 0.1 otherwise. We also justify the choice of this high efficiency by simple ener-getics and momentum comparisons between supernovae
and AGN. For instance, for a 107M
⊙ black hole along
with its 1010M
⊙ in stars, the number of type II SNe
produced in star formation phase (∼ 150 M⊙ per SN
for a Chabrier IMF) is ∼ 7.107. Thus, the total SNe
energy injected is ∼ 1059ergs over a dynamical time,
say tdyn∼ 108yr, or 1043.5ergs/s. Since the Eddington
luminosity is LEddington∼ 1045ergs/s energetics favour
AGN. Furthermore, for supernovae momentum conser-vation starts at shell velocity ∼ 400 km/s. Since the
ejec-tion velocity is ∼ 2.104km/s, the momentum injected
is ∼ 2% of initial momentum namely ∼ 1048gm cm/s
or ∼ 1032.5dynes. For AGN, momentum injected is
LEddington/c or ∼ 1034.5dynes. Thus AGN injects 100
times more momentum flux than supernovae. Finally, there is another factor of 10-100 that favours AGN, the so-called mechanical advantage factor due to ram pressure on the expanding bubble as suggested by re-cent hydrodynamical simulations (Wagner, Bicknell & Umemura). Therefore the value of γ = 50 seems to be reasonable in order to account for the accumulation of the different potential sources of feedback at high red-shifts.
Table 1.Fractions γ of the energy released by supernovae
Sim1a Sim1b Sim2
γ 0.1 1.0 50 (8.1 ≥ z ≥ 7.7) 0.1 elsewhere
The feedback parameters are summarized in Table
1.
2.2 Physical properties of main galaxies
In each simulation, we analyse a pair of galaxies with physical characteristics similar to the Milky Way-Andromeda pair (MW-M31) and with similar galaxy
environments up to 7 h−1 Mpc. Some relevant physical
properties at the virial radius Rv at z = 0 of these
two objects from each simulation are summarized in
Table 2. Note that we keep the same definition of the
virial radius RV and virial mass MV used in Peirani
(2010) (see paragraph 2.3), namely RV is the radius
where the enclosed mean density MV/(4πR3V/3) is ∆c
times the critical density, and ρc(z) = 3H(z)2/8πG,
where H(z) = H0pΩM(1 + z)3+ ΩΛ. In the
cosmol-ogy adopted in the present study, ∆c = 97.6 at z = 0.
Furthermore, the baryonic fraction is defined as follow: fb≡
mbaryons
mbaryons+ mDM
, (1)
where mbaryonsand mDMrefer to the masses of baryons
(gas+stars) and dark matter respectively in the same specific region of the universe. When not specified in the text, we do not distinguish the cold and hot phases of
the gas in the estimate of fb. According to the adopted
cosmology, the universal fbvalue is:
hfbi ≡
Ωb
ΩM
≈ 0.166. (2)
The time evolution of the virial, dark matter (DM), gas and stellar masses of each object at the virial radius and for the three simulations is shown in Figure1. First, we notice that there is no particular difference between the evolution of dark matter halo masses (and hence
viral masses) between Sim1a and Sim1b. However, the
baryonic compositions are quite different. Indeed, stellar
masses are significantly reduced inSim1b due to higher
amounts of energy released by the SN. The mass of the
gas component is therefore higher inSim1b, as expected.
ForSim2, the stellar masses are even more reduced. This
is mainly due to the fact that a significant fraction of the gas has been expelled at high redshifts.
Indeed, while the DM masses are quite similar
be-tween the 3 runs, the virial masses for objects inSim2
tend to be lower at high redshift, which indicate that a fraction of gas expelled at high z does not recollapse at
some later stage. Interestingly,Halo2 undergoes a minor
merger event at z ≃ 0.1, which corresponds for instance to a sudden variation in the evolution of its stellar mass. This same accretion event takes place at z ≃ 0.2 inSim2.
Moreover, we can also identify clearly in Sim2 another
minor merger event at z ≃ 0.05 that has not occurred
(yet?) inSim1a andSim1b. This explains why the dark
Table 2.Physical properties of the 2 main central objects of each simulation derived at the virial radius Rvand z = 0.
Halo1 Halo2
Sim1a Sim1b Sim2 Sim1a Sim1b Sim2
(γ = 0.1) (γ = 1.0) (γ = 0.1) (γ = 1.0) mDM(×1011h−1M⊙) 7.58 7.58 7.23 7.43 7.40 8.17 mgas(×1011h−1M⊙) 0.30 0.44 0.27 0.38 0.44 0.45 mstars(×1011h−1M⊙) 1.08 0.93 0.71 0.84 0.78 0.68 Mv(×1011h−1M⊙) 8.96 8.95 8.21 8.65 8.62 9.30 Rv(Mpc) 0.282 0.282 0.274 0.279 0.279 0.286 fb 0.154 0.153 0.119 0.141 0.141 0.121 2 4 6 8 10 12 0.0 0.2 0.4 0.6 0.8 1.0 10+11 8 5 2 1 0.5 0.2 0 Stellar mass 2 4 6 8 10 12 0.0 0.2 0.4 0.6 0.8 1.0 10+11 8 5 2 1 0.5 0.2 0 Stellar mass 2 4 6 8 10 12 0. 1. 2. 3. 4. 5. 6. 10+10 8 5 2 1 0.5 0.2 0 Gas mass 2 4 6 8 10 12 0. 1. 2. 3. 4. 5. 6. 10+10 8 5 2 1 0.5 0.2 0 Gas mass 2 4 6 8 10 12 0. 2. 4. 6. 8. 10+11 8 5 2 1 0.5 0.2 0 DM mass Halo 1 Halo 2 Time (Gyr) z 2 4 6 8 10 12 0. 2. 4. 6. 8. 10+11 8 5 2 1 0.5 0.2 0 DM mass 2 4 6 8 10 12 0.0 0.2 0.4 0.6 0.8 1.0 10+12 8 5 2 1 0.5 0.2 0 Virial mass Sim1a Sim1b Sim2 2 4 6 8 10 12 0.0 0.2 0.4 0.6 0.8 1.0 10+12 8 5 2 1 0.5 0.2 0 Virial mass Mass ( M ) h −1
Figure 1.The evolution of the virial dark matter (DM), gas
and stellar mass for Halo1 (first column) and Halo2 (second column) as a function of the time or redshift from Sim1a (green curves), Sim1b (red curves) and Sim2 (blue curves). In the stellar mass panels (fourth line) we also show in dashed lines the evolution of the stellar mass inside the galaxy radius
defined as Rgal= 0.1 RV. Note that Halo1 undergoes several
major merger episodes while Halo2 grows through smooth accretion. Moreover, different feedback process prescriptions
lead to different baryon mass contents inside Rv.
2 4 6 8 10 12 0 5 10 15 20 25 30 8 5 2 1 0.5 0.2 0 Halo1 Sim1a Sim1b Sim2 2 4 6 8 10 12 0 5 10 15 20 25 30 8 5 2 1 0.5 0.2 0 Halo2 z Time (Gyr) SFR (M /yr)
Figure 2.The evolution of the star formation rate (SFR)
for Halo1 (left panel) and Halo2 (right panel) as labelled.
higher in Sim2 thanSim1a orSim1b. This also suggests
that small perturbations in the properties of haloes at earlier times can have some significant impact on the whole accretion history (see for instance, Thiebaut et al. 2008). It is also worth mentioning that although the two main central objects have the same virial mass at z = 0, they have undergone different mass accretion histories.
Indeed, while Halo2 grows regularly through smooth
mass accretion, the evolution of the mass of Halo1 is
more sporadic thanks to several major merger events. It is therefore instructive to see to which extent these two different mass evolutions could affect the evolution of the distribution of baryons in the vicinity of these two objects.
It is also worth studying how the stellar masses found in the different simulations are related to the
mass of their host dark matter haloes. From Table2, the
mass of dark matter haloes varies from 1.02×10¹²M
⊙to
1.09 × 10¹²M
⊙while according to observational and
nu-merical analysis, the expected stellar mass range inside
those haloes is M∗≃ [2.5 − 3.5] × 1010M⊙ (Guo et al.
2010; Moster et al. 2010; Brook et al. 2012b). In order to make a suitable comparison, instead of considering the
stellar mass inside the virial radius Rv, we define the
galaxy radius as Rgal= 0.1 Rv and all stars inside this
radius contribute to the galaxy stellar mass M∗. By
do-ing this, we only select stars which belong to the central main galaxy while excluding stars of accreted satellites inside Rv. In Figure1, the evolution of each stellar mass
inside Rgal is shown in dashed line. One can see that
at z = 0, galaxy stellar mass ranges are M∗,Sim1a ≃
[1.1 − 1.2] × 1011M ⊙, M∗,Sim1b≃ [9.9 − 1.1] × 10 11M ⊙ and M∗,Sim2 ≃ [7.0 − 7.4] × 10 11M
⊙ for Sim1a, Sim1b
and Sim2 respectively. Thus, each simulation tends to
produce too many stars in the central region of haloes
and the trend is more severe in Sim1a and Sim1b
rel-ative to Sim2. This problem was already pointed out
from other hydrodynamical simulations which indicate that low feedbacks may result in more than an order-of-magnitude too many stars (see for instance Piontek & Steinmetz 2011; Brook et al. 2012b). As a first conclu-sion, stronger and earlier feedbacks seem to be required in order to improve the stellar mass-halo mass relation (also recently suggested by Stinson et al. 2012) and, in the present study, one probably also needs the action of additional sources of feedback in the late phase of galaxy formation such as AGN to get even closer to the expected galaxy stellar masses. Moreover the fact that our model leads to too high central stellar masses sug-gests that the effect of all different sources of feedback has been underestimated. Thus in the following, bary-onic fraction values found in our simulations may be slightly overestimated.
Finally, Figure2shows the evolution of the star for-mation rate (SFR) for each object and simulation. At
z = 0, SFR values are around [1−5] M⊙/yr which is
con-sistent with observational values derived by Robitaille & Whitney (2010) using Spitzer data. Note that these cosmic evolutions are similar for the two haloes: at high redshifts (z ≥ 2) the lower the SN efficiency the higher the stellar mass. And the higher the mass of formed stars at high redshift, the higher the subsequent SN feedback. This explains why, at low redshifts, a higher fraction of stars is produced inSim2 relative toSim1a andSim1b.
3 THE BARYON FRACTION IN THE LG
3.1 Spatial distribution in the simulated LG
Fig.3shows the projected distribution of baryons in our
LG type universes derived fromSim1b andSim2 and at
four specific epochs (i.e. z = 5, 2, 0.5 and 0). We clearly see that the evolution of the distributions of baryons and dark matter do not follow the same trend. Indeed, the regions of the universe in red and dark blue correspond to regions where the baryonic fraction is lower than the universal value. And those specific regions are mainly located around the forming protogalaxies or galaxies at each redshift, while in the very inner part of dark matter
haloes, fb is higher. This is an expected result: due to
cooling, the gas collapses to the center of haloes where stars can be formed. However, note that the size of these “red” cavities increases over time which suggests that the fraction of gas that has collapsed to the center of the halo is not immediately replaced by some fresh gas from its vicinity.
Note also, at high and low redshift, the existence of relative high baryon content regions which are located either in the filaments or beyond the virial radii. Such anisotropic distribution seems to be more pronounced inSim2 relative toSim1b. If the high baryon fractions in filaments can be understood by the dissipative nature
of gas, allowing it to cool to the dense filaments, it is crucial to characterise the mechanisms that drive high baryon content regions beyond the virial radii.
3.2 Cosmic evolution offb
3.2.1 The effects of feedback at low redshift
Let us first only consider the role of supernovae feedback in the evolution of the mass budget of Milky Way-type
galaxies. We therefore focus on bothSim1a andSim1b in
this sub-section.
The cosmic evolution of the baryonic fraction fb
estimated at the virial radius for the two main haloes
is shown in Figure4. In each of these two simulations,
they follow the same trend. At high redshift, fbis close
to the universal value and sometimes is slightly higher. Cold flows provides gas to form stars. Note that the virial radius is estimated according to the local density, which is dominated by the newly formed stars. Since the resolution in these simulations is limited, especially for low mass systems, the virial radius may be underesti-mated, and subsequently this baryonic fraction may be in fact overestimated at high redshifts.
From z ∼ 3, fbis decreasing with cosmic time until
it reaches the values of ∼ 0.15 and ∼ 0.14 at z = 0 for
Halo1 andHalo2 respectively. These latter values are
quite close to the universal value which is not surprising since similar trends have been already found from other hydrodynamical simulations using weak or no
super-novae feedback, for objects with a mass of 1012h−1M
⊙
at z = 0 (Crain et al. 2007; Faucher-Gigu`ere, Kereˇs & Ma 2011). More interestingly, no particular differences are seen in the evolution of fbbetweenSim1a andSim1b.
This suggests that higher SN feedback can reduce the star formation rate (and therefore the final stellar mass) but is rather inefficient in expelling the gas outside the virial radius at high and low redshifts for massive galax-ies. This results are in agreement with Stinson et al. (2011) who show that increased feedback in haloes of such mass scale affects the star formation more than baryon content in the circumgalactic medium (CGM). Moreover, they show that higher feedback models can account for sufficient OVI and HI gas in the CGM com-patible with the observed distributions. Therefore, in the present scenario, the relatively small differences in the baryon fraction between Sim1a and Sim1b could make supernovae feedback prescriptions difficult to dis-tinguish and one probably needs to focus on stellar mass and/or properties of the intergalactic medium in order to have better constraints (see also Dav´e, Oppenheimer & Sivanandam 2008; Shen, Wadsley & Stinson 2010; Stinson et al. 2011,2012; Scannapieco et al. 2012; Brook et al. 2012b). In particular, it seems that higher feed-back of Sim1b compared to Sim1a may be necessary in reproducing values closer to the correct stellar masses and properties of intergalactic medium as we will see in section 3.3.
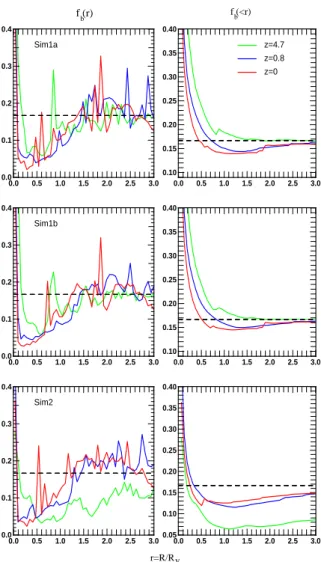
We have also studied the distribution of the inte-gral fb(< R) and differential fb(R) as respect to the
radius R at three different redshifts z = 4.7, 0.8 and
0 <f > 2<f >b b z=5 z=5 z=2 z=0.5 z=0 z=0 z=0.5 z=2 150 kpc 100 kpc 250 kpc 300 kpc 300 kpc 250 kpc 150 kpc 100 kpc Halo2 halo1
Figure 3.The projected baryonic fraction at z = 5 (first column) z = 2 (second column), z = 0.5 (third column) and z = 0
(fourth column) from Sim1b (first line) and Sim2 (second line). Dashed circles show virial radii. High fbvalue regions are clearly
visible around galaxies (or proto-galaxies) and in the filaments. This trend seems to be more pronounced in Sim2 although the difference between the two simulations is vanishing at low redshift.
2 4 6 8 10 12 0.05 0.10 0.15 0.20 8 5 2 1 0.5 0.2 0 Halo1 Sim1a Sim1b Sim2 Time (Gyr) fb z 2 4 6 8 10 12 0.06 0.08 0.10 0.12 0.14 0.16 0.18 8 5 2 1 0.5 0.2 0 Halo2 Time (Gyr) fb z Sim1a Sim1b Sim2
Figure 4.The evolution of the baryonic fraction fb estimated at the virial radius for Halo1 (left panel) and Halo2 (right
panel) as a function of cosmic time. In each panel, red, green and blue lines correspond to values derived from Sim1a, Sim1b and
Sim2 respectively. The horizontal dashed line corresponds to the universal fraction. Note that the early feedback model induces
a lower (fb∼0.12) baryon fraction at present time.
similar trends are obtained forHalo1. At the center of
each halo, fb is high due to the presence of the galaxy.
At larger radii, R & 3Rv, fb(< R) tends towards the
universal value as expected. Interestingly, for high red-shifts (z > 4.7), fb(< R) converges to the universal
value from above, while this is not the case at lower red-shifts, which suggest, as mentioned above, that the gas infall is not recurrently replaced by some fresh gas from
the outskirt of the haloes. Also, an excess of baryons at (1.5 − 2.5)Rv can be clearly seen in the variations of
the differential fb(R) for different cosmic times, which
correspond to regions in yellow in Fig.3around haloes.
Similar plots were recently derived from observations using Chandra and Suzaku facilities for an isolated el-liptical galaxy with a ∼ Milky way mass (Humphrey et al. 2011) and a fossil group (Humphrey et al. 2012).
0.0 0.5 1.0 1.5 2.0 2.5 3.0 0.10 0.15 0.20 0.25 0.30 0.35 0.40 z=4.7 z=0.8 z=0 0.0 0.5 1.0 1.5 2.0 2.5 3.0 0.10 0.15 0.20 0.25 0.30 0.35 0.40 0.0 0.5 1.0 1.5 2.0 2.5 3.0 0.05 0.10 0.15 0.20 0.25 0.30 0.35 0.40 0.0 0.5 1.0 1.5 2.0 2.5 3.0 0.0 0.1 0.2 0.3 0.4 Sim1a 0.0 0.5 1.0 1.5 2.0 2.5 3.0 0.0 0.1 0.2 0.3 0.4 Sim1b 0.0 0.5 1.0 1.5 2.0 2.5 3.0 0.0 0.1 0.2 0.3 0.4 Sim2 f (<r)b f (r)b r=R/Rv
Figure 5.Distributions of the differential baryonic fraction,
fb(R) (first column), and the integral baryonic fraction fb(<
R) (second column) with respect to the radius, R, for Halo2 and for three different redshifts, namely z = 4.7 (green lines), z = 0.8 (blues lines) and z = 0 (red lines).
3.2.2 The effects of feedback at high redshift
InSim2 however, due to earlier and important eviction
of gas from other potential sources of feedback (AGN,
hypernovae,...) fb reaches its lowest value fb ∼ 0.05
at z ∼ 6, then increases until z ∼ 1.5 and becomes
nearly constant (fb ∼ 0.12) until the present time.
This strongly suggests that sources of feedback acting at high redshift, even for a very short period, can have a stronger impact on the final mass budget of massive galaxies than those acting in the later and longer phases
of galaxy formation. One can also notice from Figure2
that the gas outflow taking place at high redshift lead to the quenching of the star formation during a few million years (5 ≤ z ≤ 8). This is in nice agreement with con-clusions of Valiante, Schneider & Maiolino (2012) using semi-analytical models of the formation and evolution of high-redshift quasars. Indeed, according to their model, the observed outflow of a distant quasar at z = 6.4 is dominated by quasar feedback which “has considerably depleted the gas content of the host galaxy, leading to
a down-turn in the star formation rate at z < 7 − 8”.
Nevertheless, future observational proofs of star forma-tion quenching at these redshifts are required in order to confirm such statements.
3.2.3 The role of accretion of matter
The time evolution of the baryonic fraction inside the virial radius depends on the competition between the
evolution of the mass that arrives within Rv, and the
mass that leaves Rv. It raises the following question: are
the low values of fbfound at z = 0 due to the fact that
more baryons have been expelled out of the virial radius or because more dark matter has been accreted inside
Rv? To answer this question, instead of studying the
evolution of the mass that enter or leave the virial radius at each subsequent step, we focused on the location at a given redshift z of all particles that have been accreted up to this specific redshift. To do this, we have first identified all the particles that have been accreted at each snapshot of the simulation from z ∼ 8 to “z”. Then, we have computed the fraction of those particles that are inside or outside Rvat the considered redshift.
By doing this, the interpretation of our findings will be easier since each accreted particle contributes only once in the final result. Indeed, certain particles can be accreted, ejected and accreted again during the whole evolution of these haloes.
Figure6 shows the evolution of the total accreted
DM and baryon mass from z ∼ 8 to a given redshift, z, for both haloes, and for bothSim1b andSim2 (results
derived from Sim1a are not shown since they are
sim-ilar to those fromSim1b). We also plot the fraction of
these accreted particles that are located inside or
out-side Rv at this given redshift z. First, we look at the
evolution relative to Halo1. One can see that a higher
fraction of dark matter mass has been accreted from z = 8 to z = 0 relative to the baryon component (solid lines). Moreover, a similar fraction of dark matter and baryons are located outside the virial radius at z = 0. That means that the fraction of baryons released
dur-ing the formation of Halo1 is not higher than that of
dark matter, which demonstrate that the low value of
fbat z = 0 follows from the fact that more dark
mat-ter particles has been accreted over cosmic time. This can be understood given the difference in nature be-tween the dissipative gas and the non-dissipative dark matter. In particular, the gas component can be shock-heated at the virial radius which considerably affects and slows down its further accretion on to the halo as already shown in hydrodynamical simulations using no
feedback (see for instance O˜norbe et al. 2007). In
con-trast, especially after an important episode of accretion or merger event, the dark matter component can “damp out” its orbital motion until it completely relaxes. For
Halo2 the same trends are observed but the mass of
baryons outside the virial radius turns out to be higher that that of dark matter. However this does not neces-sarily mean that a higher fraction of baryons has been expelled through physical mechanisms such as feedback or merger events. Indeed, if we represent the fraction of baryons and DM released from z ∼ 0.6 to z = 0 (see
2 4 6 8 10 12 0. 2. 4. 6. 8. 10+11 8 5 2 1 0.5 0.2 0 Sim1b 2 4 6 8 10 12 0. 2. 4. 6. 8. 10+11 8 5 2 1 0.5 0.2 0 Sim1b 2 4 6 8 10 12 0. 2. 4. 6. 8. 10+11 8 5 2 1 0.5 0.2 0 Sim2 2 4 6 8 10 12 0. 2. 4. 6. 8. 10+11 8 5 2 1 0.5 0.2 0 Sim2 Time (Gyr) Halo 2 Halo 1 z Mass ( M ) h −1
Figure 6.The evolutions of the total dark matter mass (solid
black line) and baryon mass (solid grey line) that was ac-creted from z ∼ 8 to a given redshift z (see the main text for more details) for Halo1 (first column) and Halo2 (column 2), derived from Sim1b (first line) and Sim2 (second line). In each panel, the corresponding fractions of mass of DM (black
color) and baryons (grey color) that are inside Rv (dashed
lines) or outside Rv(dotted line) is represented. The
dotted-dashed black and grey lines represent respectively the
frac-tion of DM and baryons outside Rv, corresponding to
par-ticles accreted from z ∼ 0.6 to a given redshift z . Note that the baryon mass evolutions have been multiplied by
(ΩM−Ωb)/Ωb to facilitate a direct comparison with DM
mass evolutions.
Figure6), one can see that same amounts of mass have
been expelled at z = 0 by the two components. It im-plies in fact that a significant fraction of dark matter which has been expelled between z = 8 and z ∼ 0.6 has been re-accreted between z ∼ 0.6 and z = 0. This is not the case for baryons which are generally heated through the expelling process and therefore remain out-side the virial radius afterwards. In order to illustrate
this, Figure7presents the evolution of the distribution
of baryons and dark matter forHalo1. From z = 2.6,
the main progenitor undergoes two mergers with mass ratios of 1:1.8 and 1:5. Here, we have selected all par-ticles inside the virial radius of each of the 3 objects. Note that the orbits of the two mergers are quite radial. After the two merger events, the spatial distributions of baryons and dark matter are quite different. Most of the dark matter particles are located inside the virial ra-dius, though a small part has been expelled in the same orbital direction. The baryons tends to either collapse toward the center or are expelled all around. This phe-nomenon is observed at z = 0 where a non-negligible part of baryons have been expelled and remain outside
the virial radius. Figure7 also shows the evolution of
the mass of DM and baryons located outside the virial radius. In the case of the dark matter component, there
are 3 distinct phases. First, from the beginning of the experiment until t = 3 Gyr, both satellites are accreted
inside Rv. Then in the second phase (from t = 3 to
t ∼ 4.5 Gyr) some of the dark matter is expelled via tidal disruption. Finally from t ∼ 4.5 Gyr some of the dark matter particles are re-accreted. Note that evo-lution from t ∼ 10 Gyr is probably due to the effect of another merger event. However, the baryon compo-nent follows the two first phases but not the third one: once baryons are expelled, most of them remain out-side the virial radius. In this specific example, we found that 2.1% and 5.8% of dark matter and baryon masses respectively are released at z = 0 from the three main objects. This is in good agreement with results obtained from idealized simulations (Sinha & Holley-Bockelmann 2009). It is also interesting to see that due to mergers, unbound gas diffuses far away from the galaxy; thus mergers represent a potential mechanism for enriching the IGM with metals. Note that this enrichment must occur early, as in our model, to avoid disruption of the cold and weakly enriched Lyman alpha forest. It is also worth mentioning that during a merger event, gas can be expelled via both tidal disruption and outflows from feedback due to the merger driven starburst. However, since there is no significant difference in the evolution of
fbwithin the virial radius between Sim1a and Sim1b,
this suggests that supernovae feedbacks have a lower contribution relative to tidal disruption for Milky Way mass galaxies. As observed in the evolution of the dark matter component, tidal disruption should guarantee es-cape whereas a starburst driven outflow is much more problematic (see for instance Powell, Slyz and Devriendt 2011).
Finally, it is interesting to point out that Halo1
undergoes major merger events between z ∼ 0.8 and z ∼ 0.5, leading to important mass outflows from z ∼
0.5 and z = 0. In particular, Figure6 indicates that
more dark matter particles are released than baryons after the merger events. Most of this dark matter is
not yet re-accreted, which explains why Halo1 tends
to have values of fb higher than Halo2 at z = 0. This
also explains why in Figure3the high fb value regions
aroundHalo1 seem to be less pronounced in comparison
to those aroundHalo2.
Thus, the evolution of the mean baryonic fraction value fbat the virial radius is essentially governed by the
relative efficiency at which the dark matter and baryons are accreted. Indeed, the evolution of the accreted mass of both dark matter and baryons follows two different regimes: a rapid growth at high redshifts (z ≥ 1.5) and a slower one at lower redshifts. These evolutions are
di-rectly related to the total mass evolutions in Figure6
which also presents these two regimes. This behaviour compares well to the evolution of individual dark matter haloes (see for instance Wechsler et al. 2002; Vitvitska et al. 2002, Peirani, Mohayaee & Pacheco 2004, McBride et al. 2009 and Tillson, Miller & Devriendt 2011), in-dicating a fast growth of the mass for z > 1.5 − 2.0, followed by a phase where the accretion rate is slower. Hydrodynamical simulations have also suggested that galaxy formation presents two phases: a rapid early phase (z ≥ 1.5) during which stars mainly form within
z=1.9 z=0 0.180 0.185 0.190 4 6 8 1 0 12 0.1 0.2 0.3 0.4 fb(<Rv) fb(>Rv) Dark matter Baryons z=2.6 z=1.4 4 6 8 10 12 10+10 1 2 5 2 1 0. 5 0.2 0 DM Baryons Ma ss(> Rv ) (h −1 M ) fb
Time (Gyr) Time (Gyr)
z z 2 1 0.5 0.2 0 0.5 z=1.4 z=2.6 z=1.9 z=0
Figure 7.An illustration of the evolution of the distribution
of baryons and dark matter during and after given merger events. Panels at z = 0 is 1 × 1 Mpc across while the other ones are 0.3 × 0.3 Mpc across. The white dashed lines repre-sent the virial radii. In the lower panels, we show the evolu-tion of the mass of baryons and DM outside the virial radius of the host halo (left panel) and the evolution of the baryonic fraction estimated from these 3 haloes inside and outside the virial radius (right panel). One can see that a non
negligi-ble number of DM particles are re-accreted inside Rv(from
t ∼ 4.5 to t ∼ 10 Gyr) which is not the case for baryons. As a result, the final values of fb(< Rv) and fb(> Rv) are
respectively lower and higher than initial ones.
the galaxy from infalling cold gas (Katz et al. 2003; Kereˇs et al. 2005; Ocvirk, Pichon & Teyssier 2008; Dekel et al. 2009) and a second one (z ≤ 1.5) during which stars are accreted (Oser et al. 2010; Hirschmann et al. 2012). This latter phase is dominated by the accretion of diffuse matter and small satellites (Fakhouri & Ma 2010; Genel et al. 2010; Wang et al. 2011; van de Voort et al.
2011). Hence the high fbvalues at high redshift derived
from Sim1a and Sim1b can be explained by the
accre-tion of high gas-to-dark matter ratio from dense region such as filament via cold flows. But at lower redshift,
fbis decreasing due to the accretion of low gas-to-dark
matter ratio material, in particular from the diffuse re-gion. Indeed, we found that the baryonic fraction of the
diffuse accreted matter (namely fb∼ 0.11 − 0.14) is on
the average much lower than the universal value: as the haloes become more massive, the temperature at the virial radius increases and the gas is shock-heated and this process slows down its accretion onto the halo. For
Sim2, fb reaches its lowest value (fb ∼ 0.05) at z ∼ 5
right after some significant expulsion of gas. After that,
there is a short phase where fb increases because the
accreted matter has a higher baryonic content (but not necessarily higher than the universal value). Then, in
the late phase of evolution of each halo, fbtends to be
constant (fb∼ 0.12) because the average accreted
mat-ter tends to have the same baryonic fraction value as the mean value inside virial radii.
3.3 Properties of the IGM
The WHIM has proven to be difficult to detect and represents a serious candidate for the missing baryons. It is therefore instructive to estimate the fraction of the WHIM in our simulated local universes. For this purpose, we have divided the Inter-Galactic Medium (IGM) into four components: (1) stars, (2) cold gas
(T < 105K), (3) WHIM (105K < T < 107K) and
hot gas (T > 107K). Figure8 shows the time
evolu-tion of three baryon components (stars, cold gas and WHIM) within a sphere centred on the local Universe-type haloes and of comoving radius 1.5 Mpc/h. The
evolution of the hot gas (T ≥ 107K) is not shown
in Figure8 since this component represents less than
1% of the total baryon mass budget in our selected re-gion, as expected since we are not in a cluster envi-ronment. It shows that the WHIM represents ∼ 30% of the baryon budget at z = 0, in good agreement with past work based on hydrodynamical simulations (Cen & Ostriker 1999; Dav´e et al. 2001; Cen & Ostriker 2006; Rasera & Teyssier 2006; Tornatore et al. 2010) when AGN feedback is not taken into account. We also found that the warm and hot gas becomes the domi-nant baryonic component at large radii (R > 150 kpc) from each main halo, in good agreement with previous observational analysis of massive galaxies (Humphrey et al. 2011, 2012) or with previous numerical simula-tions (van de Voort et al. 2011; van de Voort & Schaye 2012). However, when the contribution of the WHIM is not taken into account in the estimation of the bary-onic fraction at the virial radius, namely when only the
cold gas (T ≤ 105K) and stars are considered, f
bvalues
obtained at z = 0 only decrease by ∼ 15%. This fol-lows from the fact that stellar masses obtained in our
experiments have a large contribution in the final fb
values and thus we probably need the additional effect of AGN feedback to regulate the SFR and also increase the mass of WHIM inside the virial radius. Nevertheless,
the distribution of baryonic fraction seen in Figure3is
significantly affected when the WHIM is not taken into
account. Indeed, Figure9shows that in this latter case,
the baryonic fraction is lower than 0.5hFbi in the direct
vicinity of the virial radius.
Outside the virial radii, our analysis in the previ-ous section has suggested that the IGM is composed of gas that either never collapses onto haloes or is released by mechanisms such as feedback or merger events. But
what are the relative proportions? From Figure6we can
estimate that & 20% of the total accreted baryons is
expelled from z = 8 to z = 0 for Halo1 and Halo2,
2 4 6 8 10 12 0 20 40 60 80 1008 5 2 1 0.5 0.2 0 Time (Gyr) Ma ss fra ct io n Z Sim 1 Sim 2 Sim 3 T<105 K 105 K<T<107 K Stars
Figure 8. The evolution of the IGM components within
a sphere centred on the local Universe type haloes and of
comoving radius 1.5 Mpc/h: cold gas (T < 105K, dashed
lines), WHIM (105K < T < 107K, solid lines) and stars
(dotted lines). Green, red and blue lines correspond to Sim1a,
Sim1b and Sim2 respectively. bf The evolution of the hot gas
(T ≥ 107K) is not shown since this component represents
less than 1% of the total baryon mass budget in the selected region.
agreement with Sinha & Holley-Bockelmann (2010) who found from semi-analytic techniques that up to ∼ 25% of gas can be unbind over the course of galaxy assem-bly. From our analysis, we found that the gas that has been released after being accreted on to haloes is mainly
located between Rv and 2Rv at z = 0. If we focus
on Halo1 which is quite isolated, we found that the
gas component between Rvand 2Rvconsists of 55.9%,
58.6% and 60.5% of gas that has been expelled from Halo1 fromSim1a,Sim1b andSim2 respectively. In other
words ∼ 40% of this gas has never collapsed ontoHalo1.
It is also worth mentioning that & 95% of the gas that has been released through merger events or feedback is in the form of WHIM at z = 0 but only ∼ 65% in the case the gas that has never collapsed into the halo. Hence, the gas that has been ejected through different mechanisms during the galaxy formation and evolution significantly increases the mass of the WHIM.
4 DISCUSSION AND CONCLUSIONS
In this paper, we have analysed hydrodynamical sim-ulations with an extensive treatment of the physics of baryons in order to study the evolution of the distribu-tion of baryons in a local group-type object. In particu-lar, we have investigated the impact of i) supernova feed-back, ii) more powerful sources of feedback at high red-shift such as AGN from intermediate mass black holes or hypernovae and iii) accretion/ejection and merger
Figure 9.The projected baryonic fraction at z = 0 derived
from Sim1a when the WHIM is not taken into account in the estimation of fb.
events in the evolution of the mass content of Milky-Way type galaxies.
First, when no high early feedback is considered as is the case in Sim1a and Sim1b, we found that the
evo-lution of the mean baryonic fraction value fb estimated
at the virial radius of the two main central objects is essentially governed by the relative efficiency at which dark matter and baryons are accreted. Indeed, in the first and early phase of galaxy formation (the cold mode of accretion z ≥ 1.5) during which stars mainly form within the galaxy from infalling cold gas (Katz et al. 2003; Kereˇs et al. 2005; Ocvirk, Pichon & Teyssier 2008; Dekel et al. 2009) fbis in general higher than the
univer-sal value. But in the second phase (the hot mode of ac-cretion), dominated by the accretion of diffuse matter or small satellites, fbtends to decrease and is 10-15% lower
than the universal value, 0.166, at z = 0. This decrease is not due to the fact that more baryons (relative to DM) are expelled beyond the virial radius by physical mech-anisms such as feedback or merger events. Rather this essentially follows from the relative nature of dissipative gas and non-dissipative dark matter. Specifically, the gas component can be shock-heated at the virial radius, which considerably slows down its further accretion into the halo (see for instance O˜norbe et al. 2007). However, shock-heating will presumably not be a large factor in low mass galaxies, but as mentioned in the introduc-tion, feedbacks such as UV-background and supernovae winds are supposed to play a major role in the effec-tive reduction of the baryon content of these galaxies. Additionally, we found that accretion and particularly merger events can release a fraction of both dark matter and baryons. But again, dark matter that has been ex-pelled can be re-accreted more efficiently than the
corre-sponding baryons, hereby enhancing the decrease of fb
inside the virial radius. Consequently, our simulations c
suggest that the gas located beyond the virial radius is mainly in the form of WHIM that comes from either gas that never collapsed prior to the formation of the proto-galaxy (∼ 40%) or gas expelled by feedback and merger processes (∼ 60%).
Our comparison of Sim1a and Sim1b also suggest
that globally increasing somewhat the efficiency of su-pernovae does not significantly affect the evolution of
fbinside the virial radius. In other words, standard SN
feedback is not powerful enough to expel the baryons out of the gravitational potential of dark matter haloes of such mass scales. This also means that, if future
ob-servations indicate that fb inside the virial radius of
Milky Way mass galaxy at z = 0 is relatively close to the universal value, then in order to make clear a dis-tinction between the different feedback models, the stel-lar mass and the properties of the intergalactic medium may provide better constraints than baryon fractions, as suggested by recent numerical works (Dav´e, Oppen-heimer & Sivanandam 2008; Shen, Wadsley & Stinson 2010; Stinson et al. 2011,2012; Scannapieco et al. 2012; Brook et al. 2012b). But at high redshift the situation is quite different since haloes are less massive and thus feedback mechanisms have a more effective contribu-tion. Indeed for our other scenario (for which a higher fraction of gas is expelled at high redshift (z ∼ 8) by more powerful source of feedback such as AGN from in-termediate mass black holes or hypernovae implemented inSim2) the accretion of gas is strongly affected at high redshift, and drives the mean baryonic value inside the virial radius to a lower values at z = 0. This is one im-portant conclusion of this paper: to get a low value of
fb at present time, physical mechanisms able to expel
the gas at high redshift will have a stronger impact on the deficit of baryons in the mass budget of Milky Way type-galaxy today than those that expel the gas in the longer, late phases of galaxy formation. Thus, if future observations favour a relatively low value of fbat z = 0,
then this “high redshift feedback” scenario is the most probable.
However, it this worth mentioning that the effective contribution of non-gravitational heating such as
galac-tic winds from supernovae in the evolution of fb within
the virial radius of Milky Way type galaxy is still a con-troversial and a debated topic in the recent literature. From our modelling and experiments, we found that in-creasing the efficiency of supernova feedback leads to the reduction of the stellar mass but has no particular impact on the evolution of fb(< Rv) for system of such
mass scales (cf Powell, Slyz & Devriendt 2011). Such statements were also advocated by Anderson & Breg-man (2010) from observational constraints on the den-sity of hot gas around the Milky Way. Moreover, using cosmological simulations, Faucher-Gigu`ere, Kereˇs & Ma (2011) have investigated the net baryonic accretion rates
through RV. Although the net baryonic accretion rate
is sensitive to galactic outflows, especially for low mass systems, the baryon mass fractions at z = 0 for objects
with a mass higher than 1012M
⊙ and for different SN
feedback prescriptions have similar values to those de-rived in the present study. However, other hydrodynam-ical simulations from Scannapieco et al. (2008, 2009)
using higher SFR efficiency (c∗ = 0.1) found that at
z = 0, the baryon fractions inside the virial radius are ≤ 0.10 within the virial radius “indicating that a signif-icant amount of baryons has been lost through winds”.
AGN feedback is supposed to play an important role in the formation of massive objects such as giant el-lipticals in galaxy groups (Tabor & Binney 1993; Ciotti & Ostriker 1997; Silk & Rees 1998). From previous nu-merical studies, the inclusion of AGN is expected to re-duce the stellar mass (see for instance Sijacki et al. 2007; Dubois et al. 2010, 2012; Hambrick et al. 2011b) and also increase the mass of WHIM (Cen & Ostriker 2005; Tor-natore et al. 2010; Durier & Pacheco 2011; Roncarelli et al. 2012). Our study does not include the effect of AGN feedback at low redshift, but we think that such sporadic events will not have a major contribution in the baryonic fraction value inside the virial radius at present time. In-deed, from observationally motivated constraints, AGN and SN at low to moderate redshift seem not to produce the expected correlations with the baryonic Tully-Fisher relationship (Anderson & Bregman 2010). Moreover, as mentioned above, observations of massive objects re-ported by Humphrey et al. (2011, 2012) seem to sug-gest that AGN feedback has no particular impact on the baryonic fraction values within the virial radius. Also, recent hydrodynamical simulations show that AGN and SN feedback may mutually weaken one another’s effect by up to an order of magnitude in haloes in the mass range of 1011.25− 1012.5M
⊙(Booth & Schaye 2012). At
high redshift, the effects of galactic winds on the IGM are also controversial. In the present paper, our sim-ple minded modelling indicates that galactic winds can expel some gas outside the virial radius and affect sig-nificantly the evolution of the baryon content of massive galaxies. Similar conclusions have been recently drawn by Roncarelli et al. (2012) from hydrodynamical simu-lations suggesting that galactic winds acting at earlier epochs can prevent the IGM to collapse in dense struc-tures. Also, as mentioned above, semi-analytical model from Valiante, Schneider & Maiolino (2012) indicates that the observed outflow of a distant quasar at z = 6.4 (Maiolino et al. 2012) is expected to have considerably depleted the gas content of the host galaxy. However, simulations conducted by Di Matteo et al. (2011) or Shen et al. (2012) found that galactic outflows at high redshift may not be very effective at stopping the cold gas from penetrating the central regions.
In summary, our study indicates that in order to
reach lower fb values at z = 0 for Milky Way type
galaxies, the eviction of cold gas by feedbacks during the first phase of galaxy formation at high redshifts proves to be crucial. Our study also suggests that these high redshift feedback mechanisms more efficiently re-duce galaxy stellar mass in the central part of haloes and thus show better agreement to galaxy observable such as the stellar mass-halo mass relation. Moreover, efficient high redshift feedback processes seem also to be required in order to slow down the growth of galaxies at high redshift and thus to reproduce the observed num-ber density evolution as recently pointed out by Wein-mann et al. (2012). The presence of strong early feed-backs is also motivated in disk galaxy formation theory.
Indeed, it has been suggested that early outflows could eject low angular momentum gas allowing disk galax-ies to form (Binney, Gerhard and Silk (2001). Such hy-pothesis was confirmed by hydrodynamical simulations which show that outflows can indeed remove preferen-tially low angular momentum material which can be re-accreted latter with higher angular momentum and forms a disk (Brook et al. 2011, 2012a). If such state-ments are correct, numerical and observational efforts have to be focused towards characterising the respec-tive role of each feedback process on the IGM at high redshift. In particular, are the baryons expelled from protogalaxies or do they never collapse into the gravi-tational potential well of these objects? In the present paper, we only focus on the first mechanism, but it is not excluded that processes such as photoionization play a major role especially at high redshifts for low mass sys-tems. In this regard, it is interesting to compare our results with those of Guedes et al. (2011) who have studied the formation of late-type spirals from the ERIS simulation. Specifically, they claimed that the collapse of baryons is heavily suppressed at high redshift by the UV background. And it is particularly instructive to see that from their highest mass resolution simulation, the evolution of the baryonic fraction (see their Figure 6 in Guedes et al. 2011) is very similar to those we obtained
from Sim2. They also found a similar value at z = 0
namely fb ∼ 0.7 < fb >. Our simulations do include
UV background but our mass resolution may be too small to account for this process properly.
More detailed and well-resolved hydrodynamical simulations are required to investigate the evolution of the mass content of galaxies at high and low redshifts. But in order to achieve this goal, one must first improve the constraints of the expected energy injection to the IGM from SN, AGN, UV background (etc...) via obser-vations.
Acknowledgements
I. J. acknowledges support from the Global Internship program by the National Research Foundation of Ko-rea (NRF). We warmly thank the referee for an in-sightful review that considerably improved the qual-ity of the original manuscript. We warmly thank D. Le Borgne, J. Devriendt, Y. Dubois, R. Gavazzi, T. Kimm, G. Mamon, J.A. de Freitas Pacheco and T. Sousbie for interesting discussions. We also thank D. Munro for freely distributing his Yorick programming language (available at http://yorick.sourceforge.net/) which was used during the course of this work. This work was carried within the framework of the Horizon project (http://www.projet-horizon.fr).
REFERENCES
Anderson, M. E., & Bregman, J. N. 2010, ApJ, 714, 320 Bell, E. F., McIntosh, D. H., Katz, N., & Weinberg, M. D.
2003, ApJS, 149, 289
Benson, A. J., Frenk, C. S., Lacey, C. G., Baugh, C. M., & Cole, S. 2002, MNRAS, 333, 177
Bregman, J. N. 2007, ARA&A, 45, 221
Brook, C. B., Governato, F., Roˇskar, R., et al. 2011, MNRAS, 415, 1051
Brook, C. B., Stinson, G., Gibson, B. K., et al. 2011, MN-RAS, 419, 771
Brook, C. B., Stinson, G., Gibson, B. K., Wadsley, J., & Quinn, T. 2012b, MNRAS, 424, 1275
Bond, J. R., Kofman, L., Pogosyan, D., 1996, Nature, 380, 603
Booth, C. M., & Schaye, J. 2012, arXiv:1203.3802
Bullock, J. S., Kravtsov, A. V., & Weinberg, D. H. 2000, ApJ, 539, 517
Cen, R., & Ostriker, J. P. 1999, ApJ, 514, 1 Cen, R., & Ostriker, J. P. 2006, ApJ, 650, 560 Ciotti, L., & Ostriker, J. P. 1997, ApJL, 487, L105
Colless, M., Dalton, G., Maddox, S., et al. 2001, MNRAS, 328, 1039
Crain, R. A., Eke, V. R., Frenk, C. S., et al. 2007, MNRAS, 377, 41
Dabringhausen, J., Kroupa, P., Pflamm-Altenburg, J., & Mieske, S. 2012, ApJ, 747, 72
Dav´e, R., Cen, R., Ostriker, J. P., et al. 2001, ApJ, 552, 473
Debuhr, J., Quataert, E., & Ma, C.-P. 2012, MNRAS, 420, 2221
Dav´e, R., Oppenheimer, B. D., & Sivanandam, S. 2008,
MN-RAS, 391, 110
Dekel, A., Birnboim, Y., Engel, G., et al. 2009, Nature, 457, 451
Di Matteo, T., Khandai, N., DeGraf, C., et al. 2012, ApJL, 745, L29
Dubois, Y., Devriendt, J., Slyz, A., & Teyssier, R. 2010, MN-RAS, 409, 985
Dubois, Y., Devriendt, J., Slyz, A., & Teyssier, R. 2012, MN-RAS, 420, 2662
Durier, F., & de Freitas Pacheco, J. A. 2011, International Journal of Modern Physics E, 20, 44
Fakhouri, O., & Ma, C.-P. 2010, MNRAS, 401, 2245
Faucher-Gigu`ere, C.-A., Kereˇs, D., & Ma, C.-P. 2011,
MN-RAS, 417, 2982
Geller, M. J., & Huchra, J. P. 1989, Science, 246, 897 Genel, S., Bouch´e, N., Naab, T., Sternberg, A., & Genzel, R.
2010, ApJ, 719, 229
Gnedin, N. Y. 2000, ApJ, 542, 535
Gott, J. R., III, Juri´c, M., Schlegel, D., et al. 2005, ApJ, 624, 463
Guedes, J., Callegari, S., Madau, P., & Mayer, L. 2011, ApJ, 742, 76
Guo, Q., White, S., Li, C., & Boylan-Kolchin, M. 2010, MN-RAS, 404, 1111
Habergham, S. M., Anderson, J. P., & James, P. A. 2010, ApJ, 717, 342
Hambrick, D. C., Ostriker, J. P., Johansson, P. H., & Naab, T. 2011a, MNRAS, 413, 2421
Hambrick, D. C., Ostriker, J. P., Naab, T., & Johansson, P. H. 2011b, ApJ, 738, 16
Hirschmann, M., Naab, T., Somerville, R. S., Burkert, A., & Oser, L. 2012, MNRAS, 419, 3200
Hoeft, M., Yepes, G., Gottl¨ober, S., & Springel, V. 2006,
MNRAS, 371, 401
Hoekstra, H., Hsieh, B. C., Yee, H. K. C., Lin, H., & Glad-ders, M. D. 2005, ApJ, 635, 73
Humphrey, P. J., Buote, D. A., Canizares, C. R., Fabian, A. C., & Miller, J. M. 2011, ApJ, 729, 53
Humphrey, P. J., Buote, D. A., Brighenti, F., et al. 2012, ApJ, 748, 11
Katz, N., Keres, D., Dave, R., & Weinberg, D. H. 2003, The IGM/Galaxy Connection. The Distribution of Baryons at z=0, 281, 185
Kereˇs, D., Katz, N., Weinberg, D. H., & Dav´e, R. 2005, MN-RAS, 363, 2
Komatsu, E., Dunkley, J., Nolta, M. R., et al. 2009, ApJS, 180, 330
Komatsu, E., Smith, K. M., Dunkley, J., et al. 2011, ApJS, 192, 18
Maiolino, R., Gallerani, S., Neri, R., et al. 2012, MNRAS, 425, L66
McBride, J., Fakhouri, O., & Ma, C.-P. 2009, MNRAS, 398, 1858
McGaugh, S. S., Schombert, J. M., de Blok, W. J. G., & Zagursky, M. J. 2010, ApJL, 708, L14
Mo, H. J., Yang, X., van den Bosch, F. C., & Katz, N. 2005, MNRAS, 363, 1155
Moster, B. P., Somerville, R. S., Maulbetsch, C., et al. 2010, ApJ, 710, 903
Navarro, J. F., & White, S. D. M. 1993, MNRAS, 265, 271 Nickerson, S., Stinson, G., Couchman, H. M. P., Bailin, J.,
& Wadsley, J. 2011, MNRAS, 415, 257
Ocvirk, P., Pichon, C., & Teyssier, R. 2008, MNRAS, 390, 1326
Okamoto, T., Gao, L., & Theuns, T. 2008, MNRAS, 390, 920 O˜norbe, J., Dom´ınguez-Tenreiro, R., S´aiz, A., & Serna, A.
2007, MNRAS, 376, 39
Oser, L., Ostriker, J. P., Naab, T., Johansson, P. H., & Burk-ert, A. 2010, ApJ, 725, 2312
Peirani, S., Mohayaee, R., & de Freitas Pacheco, J. A. 2004, MNRAS, 348, 921
Peirani, S. 2010, MNRAS, 407, 1487
Piontek, F., & Steinmetz, M. 2011, MNRAS, 410, 2625 Powell, L. C., Slyz, A., & Devriendt, J. 2011, MNRAS, 660 Prunet, S., Pichon, C., Aubert, D., Pogosyan, D., Teyssier,
R., & Gottloeber, S. 2008, ApJS, 178, 179 Rasera, Y., & Teyssier, R. 2006, A&A, 445, 1
Read, J. I., Pontzen, A. P., & Viel, M. 2006, MNRAS, 371, 885
Ricotti, M., Gnedin, N. Y., & Shull, J. M. 2002, ApJ, 575, 49
Robitaille, T. P., & Whitney, B. A. 2010, ApJL, 710, L11 Roncarelli, M., Cappelluti, N., Borgani, S., Branchini, E., &
Moscardini, L. 2012, MNRAS, 424, 1012
Scannapieco, C., Tissera, P. B., White, S. D. M., & Springel, V. 2008, MNRAS, 389, 1137
Scannapieco, C., White, S. D. M., Springel, V., & Tissera, P. B. 2009, MNRAS, 396, 696
Scannapieco, C., Wadepuhl, M., Parry, O. H., et al. 2012, MNRAS, 423, 1726
Shen, S., Wadsley, J., & Stinson, G. 2010, MNRAS, 407, 1581 Shen, S., Madau, P., Guedes, J., Mayer, L., & Prochaska,
J. X. 2012, arXiv:1205.0270
Sijacki, D., Springel, V., Di Matteo, T., & Hernquist, L. 2007, MNRAS, 380, 877
Silk, J., & Rees, M. J. 1998, A&A, 331, L1
Binney, J., Gerhard, O., & Silk, J. 2001, MNRAS, 321, 471 Silk, J., & Nusser, A. 2010, ApJ, 725, 556
Sinha, M., & Holley-Bockelmann, K. 2010, MNRAS, 405, L31 Sinha, M., & Holley-Bockelmann, K. 2009, MNRAS, 397, 190 Somerville, R. S. 2002, ApJL, 572, L23
Springel, V. 2005, MNRAS, 364, 1105
Stinson, G. S., Brook, C., Prochaska, J. X., et al. 2012, MN-RAS, 425, 1270
Stinson, G., Brook, C., Macci`o, A. V., et al. 2012,
arXiv:1208.0002
Tabor, G., & Binney, J. 1993, MNRAS, 263, 323
Thi´ebaut, J., Pichon, C., Sousbie, T., Prunet, S., &
Pogosyan, D. 2008, MNRAS, 387, 397
Thoul, A. A., & Weinberg, D. H. 1996, ApJ, 465, 608
Tillson, H., Miller, L., & Devriendt, J. 2011, MNRAS, 417, 666
Tornatore, L., Borgani, S., Viel, M., & Springel, V. 2010, MNRAS, 402, 1911
Valiante, R., Schneider, R., & Maiolino, R. 2012,
arXiv:1205.3488
van de Voort, F., Schaye, J., Booth, C. M., Haas, M. R., & Dalla Vecchia, C. 2011, MNRAS, 414, 2458
van de Voort, F., & Schaye, J. 2012, MNRAS, 2882 Vitvitska M. , Klypin A. , Kravtsov A. V. , Wechsler R. H.
, Primack J. R.& Bullock J. S. , 2002, ApJ 581, 799 Wagner, A. Y., Bicknell, G. V., & Umemura, M. 2012,
arXiv:1205.0542
Wang, J., Navarro, J. F., Frenk, C. S., et al. 2011, MNRAS, 413, 1373
Wechsler, R. H., Bullock, J. S., Primack, J. R., Kravtsov, A. V., & Dekel, A. 2002, ApJ, 568, 52
Weinmann, S. M., Pasquali, A., Oppenheimer, B. D., et al. 2012, arXiv:1204.4184