HAL Id: inserm-00177029
https://www.hal.inserm.fr/inserm-00177029
Submitted on 1 Feb 2008HAL is a multi-disciplinary open access archive for the deposit and dissemination of sci-entific research documents, whether they are pub-lished or not. The documents may come from teaching and research institutions in France or abroad, or from public or private research centers.
L’archive ouverte pluridisciplinaire HAL, est destinée au dépôt et à la diffusion de documents scientifiques de niveau recherche, publiés ou non, émanant des établissements d’enseignement et de recherche français ou étrangers, des laboratoires publics ou privés.
Advanced survival models for risk-factor analysis in
scrapie.
Fabien Corbière, Francis Barillet, Olivier Andréoletti, Francis Fidelle,
Nathalie Laphitz-Bordet, François Schelcher, Pierre Joly
To cite this version:
Fabien Corbière, Francis Barillet, Olivier Andréoletti, Francis Fidelle, Nathalie Laphitz-Bordet, et al.. Advanced survival models for risk-factor analysis in scrapie.: PrP genotype influence on scrapie infection risk and incubation period.. Journal of General Virology, Microbiology Society, 2007, 88 (Pt 2), pp.696-705. �10.1099/vir.0.81981-0�. �inserm-00177029�
Advanced survival models for risk factors analysis in scrapie.
12
Fabien CORBIERE1,5*, Francis BARILLET2, Olivier ANDREOLETTI1, Francis
3
FIDELLE3, Nathalie LAPHITZ-BORDET4, François SCHELCHER1, Pierre JOLY5
4 5
1 – UMR Interactions Hôtes Agents Pathogènes, Ecole Nationale Vétérinaire de Toulouse, 23 6
chemin des Capelles, 31076 Toulouse Cedex, France 7
2 - Station d’amélioration des animaux, Institut National de la Recherche Agronomique, BP 8
27, 31326 Castanet-Tolosan cedex, France 9
3 – Centre Départemental d’Elevage Ovin, quartier Ahetzia 64130 ORDIARP, France 10
4 – Direction Départementale des Services Vétérinaires, cours Lyautey, 64000 PAU, France 11
5 – EMI 0338 (Biostatistique), Institut de Santé Publique Et Développement, Université 12
Victor Segalen Bordeaux 2, 146 rue Léo Saignat, 33076 Bordeaux Cedex, France 13 14 * Corresponding author: 15 Fabien Corbière, 16
EMI 0338 Biostatistique, Institut de Santé Publique Et Développement, 17
Université Victor Segalen Bordeaux 2 18
146 rue Léo Saignat, 33076 Bordeaux Cedex, France 19
(fabien.corbiere@isped.u-bordeaux2.fr) Tel (33) 5 57 57 45 79; Fax (33) 5 56 24 00 81
20 21
Running title: PrP genotype influence on scrapie infection risk and incubation period.
22
Number of words in the summary: 227 23
Number of words in the main text: 4985 24
Number of tables: 6 - Number of figures: 2 25
HAL author manuscript inserm-00177029, version 1
HAL author manuscript
Summary
26
Because of the confounding effects of long incubation duration and flock management, 27
accurate epidemiological studies of scrapie outbreaks are difficult to carry out. In this study, 28
641 Manech Red Faced sheep from 6 scrapie affected field flocks in Pyrenees Atlantiques, 29
France, were monitored for clinical scrapie over a 6 to 9 year period. Over this period, 170 30
scrapie clinical cases were recorded and half of the culled animals were submitted for post 31
mortem TSE diagnosis to assess their infectious status. Collected data were analyzed using a 32
“mixture cure model” approach, which allowed for the discriminating effect of PRP genotype 33
and flock origin on incidence and incubation period. Simulations were performed to evaluate 34
the applicability of such a statistical model to the collected data. As expected, ARR 35
heterozygote sheep were less at risk of becoming infected than ARQ/ARQ individuals and 36
had a delayed age at clinical onset. Conversely, when compared to ARQ/ARQ, the VRQ 37
haplotype was associated with an increased infection risk, but not a shorter incubation period. 38
Considering the flock effect, we observed that a high incidence rate was not associated with 39
shorter incubation periods and that incubation period could be significantly different in flocks 40
harboring similar infection risks. These results strongly support that other parameters like the 41
nature of the agent or flock management could interfere with epidemiological dynamics of the 42
infection in scrapie affected flocks. 43
44
Introduction
45
Transmissible spongiform encephalopathies (TSE) are neurodegenerative disorders occurring 46
primarily in sheep (scrapie), cattle (bovine spongiform encephalopathy - BSE), or humans 47
(Creutzfeldt-Jakob disease - CJD). They all share similar characteristics including long 48
incubation periods, a progressive pattern of disease and a clinical course resulting in death 49
(Fraser, 1976). Under natural conditions, it is considered that scrapie infection in sheep occurs 50
mainly after an early oral contamination (around birth) (Andreoletti et al., 2000; Heggebo et 51
al., 2000). Scrapie clinical onset generally occurs between 2 and 7 years (Detwiler & Baylis, 52
2003). 53
In prion diseases, the accumulation of an abnormal isoform (PrPsc) of a normal cellular 54
protein (PrPc) in tissues from infected individuals is currently considered as a disease 55
hallmark. Most of the diagnostic tests currently available are based on biochemical detection 56
of the abnormal protein (McKinley et al., 1983; Race et al., 2001). However post-mortem 57
tests, as carried out in the current European surveillance program (rapid test on the obex), are 58
reliable only for detection of infected animals in the second half of incubation period. 59
Because of long TSE incubation periods, data analysis is difficult without reference to flock 60
demography and management. Indeed infected individuals could be culled or die from other 61
causes before the clinical onset (intercurrent diseases – economical reasons). In this situation 62
no reliable information about their infectious status will be available (Begara-McGorum et al., 63
2000; Ryder et al., 2001; Thorgeirsdottir et al., 2002; Billinis et al., 2004). 64
Evaluation of genetic and environmental risk factors in scrapie have been conducted mainly 65
using case-control designs in which a set of affected animals is compared to their healthy 66
flock-mates or to a reference population (Hunter et al., 1997; Thorgeirsdottir et al., 1999; 67
Tranulis et al., 1999; O'Doherty et al., 2002; Acin et al., 2004; Baylis et al., 2004; Billinis et 68
al., 2004; Tongue et al., 2006). Such approaches revealed that TSE susceptibility in sheep is 69
controlled mainly by polymorphisms at codons 136 (T,V,A), 154 (R,H) and 171 (R,Q,H,K) of 70
the PRP gene (Clouscard et al., 1995; Hunter et al., 1996). V136R154Q171/VRQ, ARQ/VRQ 71
and ARQ/ARQ animals are usually considered the most susceptible to scrapie, whereas 72
homozygous or heterozygous AHQ and heterozygous ARR animals only show a marginal 73
susceptibility, ARR/ARR sheep being considered to be fully clinically resistant (Detwiler & 74
Baylis, 2003). 75
Surveys based on long term individual monitoring of an exposed population are less subject to 76
sampling bias (Tongue et al., 2006). Consequently, they should be considered as more 77
relevant than case-control or cross-sectional studies for an accurate evaluation of the effect of 78
environmental or genetic factors on infection rate and incubation period. 79
‘Cure models’ are part of the mixture models family (Bohning & Seidel, 2003). In ‘mixture 80
cure models’ it is considered that the studied population is a mixture of susceptible (i.e. that 81
may undergo the event of interest) and non-susceptible individuals (i.e. that will never 82
undergo the event of interest) (Farewell, 1982). Unlike classical survival analysis, they allow 83
a separate estimation of covariate effects on the incidence and incubation length. Cure models 84
also allow the estimation of the proportion of healthy (or conversely infected) individuals in a 85
population, including individuals that did not last the total length of the study (Lam et al., 86
2005) 87
In this study we propose a model based on ‘mixture cure models’ approach for scrapie 88
epidemiological analysis. Robustness and reliability boundaries of the model were assessed 89
by simulations before analyzing data collected over 6 to 9 years in 6 naturally scrapie affected 90
flocks in Pyrenees Atlantiques, France. 91
92
Material and Method
93
Model design
94
In the model, death from scrapie is considered as the event of interest. Clinical scrapie cases 95
are considered to be scrapie-infected and have uncensored observations on their lifetime. For 96
apparently healthy sheep that are removed from the flock (right-censored records) it is 97
unknown whether they are scrapie-free or infected but removed prior to onset of clinical 98
scrapie. For each right censored animal, the model computes the probability to be scrapie-99
infected, given its age and covariates information. 100
The model assumes that: 101
i) most or all deaths from scrapie occurs during a determined age-period , 102
ii) monitoring is long enough for clinical onset to have appeared in most of the infected 103
animals, 104
ii) the longer an animal lives, the lower the probability of it being scrapie infected. Animals 105
which live longer than the last observed scrapie clinical case had an extremely low probability 106
(if not zero) of incubating scrapie. 107
108
If U is the indicator denoting SI animals (i.e. U=1 if the animal is scrapie-infected and 109
U=0 if non infected), and T is a non-negative random variable denoting the failure time of 110
interest, defined only if U=1, the mixture cure model is given as follows: 111
S(t|x,z) = (z) S(t|U=1,x) + (1- (z)) 112
where S(t|x,z) is the unconditional (marginal) survival function of T for the entire population 113
under study (that is SF and SI groups), and (z)=P(U=1|z) is the probability of being infected 114
given a covariate vector z = (z1,...,zq)'. S(t|U=1,x) = P(T>t|U=1,x) is the conditional survival
115
function for SI animals given a covariate vector x = (x1,...,xm)' (it may include the same
116
covariate as z). The use of conditional attached to this function is to stress that the distribution 117
of time refers not to the whole group of animals but only to the animals that are in the SI 118
group. Note that S(t|x,z) 1- (z) as t ∞, where 1- (z) represents the proportion of non 119
infected animals. When = 1, that is when no scrapie-free portion is assumed, the model 120
reduces to the traditional survival model. Whether the inclusion of a proportion of scrapie-free 121
animals leads to a significantly better fit to the data than a traditional survival model with no 122
scrapie-free animals can be tested by the deviance test statistics proposed by (Maller & Zhou, 123
1996). 124
125
Various parametric and semiparametric approaches have been proposed for mixture cure 126
models (Peng & Carriere, 2002; Lam et al., 2005). For modelling the influence of exploratory 127
variables on the incidence, a logistic regression model is usually chosen (Kuk & Chen, 1992; 128
Peng & Dear, 2000) : 129
(z) = p(U=1|z)=exp( ’ z)/(1+exp( ’ z)) 130
where is the vector of regression parameters associated to z and contains an intercept. The 131
conditional survival function of infected animals is modelled through the semiparametric Cox 132
proportional hazards model (Cox, 1972), which is given by : 133 ) ' exp( 0( 1) ) , 1 (tU x S tU x S = = = γ 134
where is the vector of regression parameters associated to x and S0(t|U=1) is the baseline
135
conditional survival function, which is left unspecified. 136
Through the vectors of regression parameters and the mixture survival model is able to 137
separate the covariates effect on the incidence and the latency. An estimate of the true 138
proportion of SI animals SIpop, given z and x, is provided by averaging the individual
139 probabilities Pi(U=1|zi,xi) : 140 = + − = − + = = = N N pop ) , 1 U t S( ) ( ) ( 1 ) , 1 U t S( ) ( ) 1 ( N 1 ) , 1 U ( P N 1 SI i i i i i i i i i i i i i i i i i x z z x z x z π π π δ δ 141
where i is the censoring indicator with 1 if ti is uncensored and 0 otherwise. Obviously if i =
142
1, then Pi(U=1)=1. When i =0, then Pi(U=1|zi, xi) will depend on the survival length and will
143
drop to zero as t ∞. Note that the better the model fits the data, through covariate vectors z’ 144
andx’, the more accurate is the estimation of the proportion of SI animals. 145
146
Simulation studies
147
Simulations were conducted to test i) the ability of the model to estimate the proportion of 148
scrapie-infected animals and to discriminate covariate effects on the infection risk and 149
incubation duration and ii) the effect of individual monitoring length on model outputs. We 150
assumed that non infected animals (named Scrapie Free animals SF) would never die from 151
scrapie. Consequently observations realized on SF animals were right censored. Scrapie 152
infected animals (named Scrapie-Infected SI), either died from clinical scrapie (uncensored 153
records) or were eliminated from the flock before clinical onset (right-censored). Simulations 154
were performed using (i) genetic and biological parameters (infection rates, ages at clinical 155
death, and flock demography) described in scrapie outbreaks or already used in mathematical 156
modelling (simulation design 1) (Matthews et al., 2001; Hagenaars et al., 2003; Hopp et al., 157
2003; Baylis et al., 2004; Eglin et al., 2005; Touzeau et al., 2005) and (ii) ages at death from 158
scrapie reflecting observation realized in our data set (simulation design 2). 159
The capacity of the model to separate covariate effects on incidence and incubation length 160
(age at death) was assessed by generating two independent binary covariates, one (Z1)
161
affecting only the incidence and the other (Z2) affecting only the incubation duration. The
162
incidence is given the logistic form (z1,z2)=exp( 0+ 1Z1+ 2Z2)/(1+exp( 0+ 1Z1+ 2Z2)), where
163
1 and 2 are the effects of covariates Z1 and Z2 on the proportion of infected individuals,
164
respectively. Since Z2 should have no effect on the incidence, 2 was set to 0. Thus, the
165
proportion of infected animals is (z1=0,z2)=exp( 0)/(1+exp( 0)) for animals sharingZ1=0 and
166
(z1=1,z2)=exp( 0+ 1)/(1+exp( 0+ 1)) for those sharing Z1=1. We set 0= -0.5 and 1= -1, so
167
that the corresponding proportions of infected sheep are 37.7 % (animals with Z1= 0) and
168
18.22 % (animals with Z1=1), respectively.
169
The lognormal distribution was used as the distribution function for life expectancies of 170
infected animals, with survival function S(t|U=1)=1- [(ln t- - 1Z1- 2Z2)/ ], where is the
171
distribution function of the standard normal law. Unlike for the incidence part, 1 was set to 0,
172
because Z1 should have no effect on the latency, whatever the value of Z2. In simulation
173
design, 1, the scale ( ) and shape ( ) parameters for the lognormal distribution function were 174
set to 1.2 and 0.4 respectively. In the absence of censoring, events of interest (scrapie deaths) 175
were allowed to occur at median age 3.3 years old (interquartile range = 2.5 - 4.2,) for 176
individuals with Z2=0. We set 2 = 0.3 so that infected individuals with Z2=1 would die later,
177
at median age 4.4 years old (interquartile range = 3.4 – 5.7). In simulation design 2, we set 178
= ln 2, = 0.5, 1 = 0 and 2 = 0.375, so that median ages at clinical onset were 2.00
179
(interquartile range = 1.5 – 2.8) and 3.00 years old (interquartile range = 2.1 – 4.2) (figure 1a). 180
Monitoring length were generated according to the Weibull distribution W( , ) with shape ( ) 181
and scale ( ) parameters. Thirteen different scenarios were investigated with median life 182
expectancy (meaning monitoring length) ranging from 2.5 years to 9.5 years old. These 183
scenarios covered a large panel of flock management policies and demography. For each 184
scenario and simulation design, 500 independent data sets, each constituted with 500 185
individuals, were generated and submitted to model analysis. The absolute biases (B( )= i
186
( i-c0)/500) and mean squared errors (MSE( )= i ( i-c0)²/500), where i are the estimates of
187
c0, were computed for the 5 parameters estimates.
188
Sample generation and model computations were performed using SAS software (SAS-PC 189
system®, Version 8.2 for Windows, SAS Institute Inc., Cary, NC, 1999-2001). 190
191
Flocks
192
Investigations were carried out on 6 scrapie naturally affected dairy flocks, bred by private 193
farmers, in Pyrenees Atlantiques, France. These flocks had been involved in a long-term 194
scrapie epidemiology research project since 1994 (flock C) and 1998 (other 5 flocks). Sheep 195
were all Manech Red Faced pure-breed. Table 1 shows, for each flock, the average size and 196
the estimated year of first occurrence of scrapie. The high incidences of scrapie clinical 197
suspicions (confirmed or not) in ewes born prior to enrolment in the research project, suggest 198
different, but whatever high, infection pressures (table 1). 199
At the time of enrolment, PrP polymorphism at codons 136, 154 and 171 of the PRP gene was 200
determined for all present sheep, including breeding males and females and replacement 201
lambs. Birth date, pedigree, date and cause of death or removal from the flock were 202
systematically recorded for all the animals up to January 2006. No valuable information could 203
be collected for male and female lambs slaughtered between 1 to 3 months old. 204
To comply with the requirement of adequate monitoring length and the provision of high 205
quality data (including reliable diagnosis) only a few birth cohorts were considered within 206
each flock for the analysis. Birth cohorts were selected in which all scrapie clinical suspicions 207
were confirmed by histopathology and complete PrP genotype profiles were available. 208
The data set submitted for analysis consisted of the 1998 birth cohort (born between October 209
and December 1997) for flock A, the 1999 birth cohort (born between October and December 210
1998) for flocks B, D, E and F and the 1995, 1996, 1997 birth cohorts in flock C (animals 211
born in November and December 1994, 1995 and 1996, respectively) (table 2). Only 212
homebred animals were included in the analysis, while purchased sheep (n=10) were not 213
considered. Finally, our sample comprised 641 sheep including 170 scrapie clinical cases. 214
Apparently healthy culled sheep were submitted for PrPsc detection on obex and palatine 215
tonsils by ELISA (Platelia BSE detection Kit, Biorad) and immunohistochemistry 216
(Andreoletti et al., 2002). All the sheep included in our initial sample were not examined, 217
either because of failure to track these animals during the elimination process, or because they 218
were still alive at the time of writing (January 2006). From these last animals palatine tonsils 219
biopsies were performed each year from 2002 to 2005 (inclusive) for PrPsc 220
immunohistochemistry detection (Andreoletti et al., 2002). To account for missing 221
information, a one-side 95 percent confidence interval for the true proportion of infected 222
animals in each PRP genotype group was calculated using the hypergeometric law. 223
In the mixture cure model analysis, PRP genotype and the flock were used as covariates and 224
age at death from clinical scrapie was considered as the survival measurement. Ninety-five 225
percent confidence intervals for adjusted odds ratios (OR) from the logistic part and adjusted 226
relative risks (RR) from the Cox PH part of the mixture cure model were computed using the 227
bias corrected, accelerated bootstrap method (Davison & Hinkley, 1997). 228
Results
229
Simulations
230
As expected, the longer an animal lived (long individual monitoring), the smaller were the 231
mean absolute biases and mean squared errors (MSE, not shown) for the different estimates 232
(figure 1B and 1C). Biases and MSE were acceptable for inference when the monitoring time 233
was longer than the median (theoretical) incubation duration. For the first set of simulated 234
incubation times (median age at death 3.3 and 4.45 years old), the estimates of the proportion 235
of infected animals ( 0) and the effects of Z2 on the incidence ( 2) were highly biased
236
(absolute bias over 0.1) for median monitoring times less than 5.5 years (figure 1B). For the 237
second set of simulated incubation durations (median age at death 2 and 3.3 years old) similar 238
results were obtained for median monitoring times under 3.5 years (figure 1C). In our 239
population median age at death in scrapie affected animals was 1.7 years (figure 1A and table 240
3) and the median monitoring time was 4.90 years (table 4). Under these conditions, the 241
models outputs were expected to be relevant in the analysis our data set. 242
243
PrP genetic structure of the studied cohorts
244
Amongst the studied cohorts, the ARQ and ARR alleles were dominant while AHQ and VRQ 245
alleles were rare (table 2). The sample’s genetic structure is consistent with previously 246
reported PRP polymorphism frequencies in the Manech Red Faced breed (Palhiere et al., 247
2002). 248
Because of low numbers of individuals in some PrP genotypes, animals were grouped 249
according to their level of susceptibility to classical scrapie (Defra, 2003). ARQ/ARQ, 250
AHQ/AHQ and AHQ/ARQ sheep were considered in a medium risk group named S/S 251
(n=343). ARR/ARQ, ARR/AHQ and ARR/VRQ animals were included in a low risk group 252
named R/S (n=212). ARQ/VRQ, AHQ/VRQ and VRQ/VRQ animals were included in a 253
single high risk group named VRQ/x (n=49) (table 3). Considering these PrP genotype 254
groups, the genetic structure was not statistically different in the 6 selected flocks (Chi-square 255
test with 15 degrees of freedom ²= 15.95, p=0.38). 256
Scrapie clinical cases
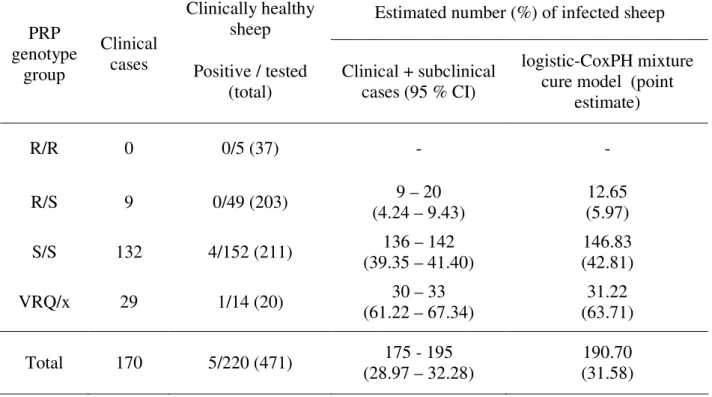
257
Clinical scrapie cases were mainly observed in ARQ/ARQ (n=131 – 77.06%), and ARQ/VRQ 258
(n=28 – 16.47%) genotypes, while heterozygote ARR were poorly affected (R/S sheep n= 9 – 259
5.29%) (table 2 and 3). High incidences in susceptible PrP genotypes ARQ/ARQ and 260
ARQ/VRQ suggested a high infection pressure. No clinical cases were observed, neither in 261
ARR/ARR (n=37), nor in ARR/VRQ (n=3), ARR/ARH (n=3) or AHQ/VRQ (n=3) animals. 262
However the number of animals with these three last genotypes was too low to draw any 263
conclusion. 264
The Kaplan-Meier plots of the survival distribution functions for scrapie clinical occurrence 265
indicate the absence of new scrapie cases after 5.54 years, whatever the genotype group 266
considered (figure 2). This lack of new clinical cases fulfils a basic requirement allowing the 267
application of the Cox PH mixture cure model, i.e. (i) most or all death due to scrapie 268
occurred in a defined age period (ii) the monitoring length was sufficient to allow almost all 269
infected animals to show clinical signs. 270
271
Monitoring length in clinically healthy sheep
272
A large number (n=264 – 60.83%) of clinically healthy animals were eliminated by breeders 273
for husbandry reasons at younger ages than the last observed clinical case (table 4). However, 274
94.24 % of these symptomless sheep lived older than the median age at clinical onset (1.70 275
years old) and 72.12 % reached 3.57 years old, which represented the 90th percentile of the 276
age distribution of scrapie clinical cases. 277
Because of the implementation of French TSE legislation at the beginning of 2003, breeders 278
had to remove VRQ carrier animals from scrapie affected flocks. Consequently VRQ animals, 279
mainly ARR/VRQ, were eliminated earlier than expected and had a statistically shorter 280
follow-up than R/S animals (analyse of variance, F431,2 = 13.13, p<10-4).
281 282
Active detection of subclinically infected sheep
283
From the 471 clinically healthy sheep (with no clinical scrapie) eliminated during the study, 284
220 (46.71 %) were submitted to post mortem for PrPsc detection test (mean age 4.72 years 285
old – 95% confidence interval = 1.87- 7.57). Sampled animals represented 70% of VRQ/x and 286
72.04 % of S/S but only 24.13 % of R/S and 13.51 % of R/R (table 5). 287
From the tested animals only four ARQ/ARQ sheep (aged 1.89, 2.25, 2.32 and 4.39 years), 288
and one ARQ/VRQ sheep (3.04 years) were found positive. Fifty nine animals initially 289
included in the study were still alive at the time of writing (5 ARR/ARR, 42 ARR/ARQ and 290
12 ARQ/ARQ). No PrPsc was detected in any of these animals using tonsil biopsy. According 291
to the hypergeometric law, the one sided 95% confidence interval for the number of 292
apparently healthy but infected animals eliminated from the flocks was 5 to 25 (table 5). 293
294
Results from the mixture cure model analysis
295
The deviance statistic test (χ²01=30.93, p<10-4) indicated that incorporating a scrapie-free
296
fraction provided a better fit to the data than the traditional Cox proportional hazards model 297
and that estimated effects were more relevant. 298
Proportion of infected animals
299
ARR/ARR animals were not included in the analysis, because there were no confirmed 300
clinical cases of this genotype. According to the proposed model, the predicted number of 301
subclinically infected animals was 20.75 (respectively 3.65 in the R/S group, 14.83 in the S/S 302
group and 3.22 in the VRQ carrier group, point estimate minus number of clinical cases) 303
(table 5). Strikingly these predicted numbers were in close agreement with those obtained by 304
the active detection of subclinical cases. 305
Genotype influence on incidence and incubation duration
306
Results from the Cox mixture cure model indicated that ARR heterozygote animals were at 307
lower risk of infection than S/S animals (table 6). Conversely VRQ allele carriers (excluding 308
ARR/VRQ) were at higher risk of being infected. Age at clinical onset was significantly 309
delayed in R/S animals when compared to S/S animals. No significant difference was found 310
between S/S and VRQ allele carrier (table 6). 311
Flock effect on incidence and incubation length
312
Because of insufficient numbers of ARQ/VRQ or ARR/ARQ clinical scrapie cases in some 313
flocks the analysis was restricted the ARQ/ARQ animals (table 6). The risk for ARQ/ARQ 314
animals of being infected was significantly lower in flock A, D and E than in flock C (table 315
6). No significant difference was observed between flock C, flock B and F. Interestingly age 316
at clinical onset was significantly shortened in some flocks with a lower infection risk (flock 317
D compared to flock C). Meanwhile, age at clinical onset could be significantly different in 318
flocks harbouring a similar infection risk: infected animals from flock F had delayed clinical 319
onset compared to flock C while in flock B it was shortened. Taken together, these results 320
suggest strongly that age at clinical onset and infection risk are not associated parameters. 321 322 Discussion 323 Working hypothesis 324
Only a few studies of scrapie outbreaks, based on longitudinal monitoring, have been 325
published (Elsen et al., 1999; Diaz et al., 2005). Using survival analysis, they aimed at 326
determining the influence of PrP genotype, rearing type and dam clinical status on individual 327
risk of developing clinical scrapie. Survival analysis assumes intrinsically that if, in an 328
exposed population, a long enough and complete surveillance of individuals is possible, each 329
would experience the event of interest i.e. clinical scrapie. For TSE, this hypothesis is 330
obviously inadequate. Indeed, under natural exposure, ARR/ARR animals and a large 331
proportion of susceptible genotype animals will remain uninfected (Elsen et al., 1999). 332
Because a mixed population of susceptible and non-susceptible individuals is considered, 333
‘mixture cure models’ appear to be an attractive approach for scrapie epidemiological 334
analysis. However fulfilment of several conditions is compulsory for their sound application. 335
Such constraints require hypotheses about scrapie pathogenesis and biology. Amongst the 336
basic hypotheses we considered were that animals born in an infected flock, if not infected in 337
their early life, would remain negative. Under natural exposure conditions, scrapie 338
contamination is considered to occur preferentially around birth (Andreoletti et al., 2000; 339
Heggebo et al., 2000; van Keulen et al., 2000). We therefore hypothesized that age at death 340
from scrapie (clinical stage) was a relevant approximation of the incubation period. Moreover 341
animal susceptibility seems to decrease dramatically with age (Hourrigan et al., 1979; 342
Andreoletti et al., 2000). Clinical cases have been reported in young and adult susceptible 343
animals introduced to infected flocks (Hourrigan et al., 1979; Ryder et al., 2004) but the 344
importance, relative to the neonatal contamination, of such lateral transmission in adult sheep 345
could not be estimated. The other main hypothesis we made was that a very few (if not zero) 346
infected individuals would be alive at the end of the study. The observed survival distribution 347
plots were consistent with this hypothesis. However, existence of long term subclinical 348
carriers remains a major question of scrapie epidemiology. Currently, it is impossible to 349
assume that an apparently healthy animal (whatever the test used to establish the infectious 350
status) is not incubating scrapie. Recent description of atypical cases or Nor98 cases in old 351
and apparently healthy animals, and difficulties in assessing the diagnosis, sustain the long 352
term subclinical carriers’ hypothesis (Benestad et al., 2003; Le Dur et al., 2005). However, 353
atypical scrapie occurs at a very low detected prevalence level (3 to 11 cases per 10000 354
examined) and in most cases, only one to three cases could be detected in stamped-out 355
affected flocks (De Bosschere et al., 2004; Onnasch et al., 2004; Orge et al., 2004). This 356
implies that approximately 0.2 to 0.8 sheep could have be infected with atypical scrapie in the 357
considered flocks, which is negligible when compared to the number of classical scrapie cases 358
in the studied cohorts (n=170). At the population level, the influence of an atypical case on 359
the model outputs was considered to be negligible. 360
Finally, even if the hypothesis of some adult lateral transmission and long term subclinical 361
carriers could not definitely be ruled out, both phenomena seemed marginal enough in our 362
population to avoid major transgression from the model application. From simulations, major 363
biases were only observed when the monitoring length was shorter than the median 364
(theoretical) incubation duration. Similar trends were obtained by (Yu et al., 2004) when 365
studying the influence of the follow-up length on the cure fraction estimation for several 366
human cancers. The monitoring length in the studied sheep was long enough to insure small 367
biases for the estimates of PRP genotype and flock effects. 368
369
Asymptomatic culled animals
370
The mixture cure model approach allowed the estimation of infected individuals and included 371
those eliminated while incubating the disease. Model outputs and laboratory findings were in 372
close agreement, and indicated a very low number of sheep removed while incubating scrapie. 373
This result is consistent with observations from another study based on longitudinal survey in 374
a Texel flock (Baylis et al., 2002). It contrasts, however, with other publications in which 375
high numbers of scrapie incubating animals were described (Thorgeirsdottir et al., 2002; 376
Billinis et al., 2004). Similarly, the modelling of a scrapie outbreak in a cheviot flock 377
predicted a high ratio of infections to cases (2.2:1) (Matthews et al., 2001). 378
Discrepancies between these results lay certainly in the data collection plan. Studies reporting 379
a high proportion of asymptomatic animals were based on cross-sectional designs with data 380
collected at stamping-out. In our study, most sheep were culled after a long individual 381
monitoring period which allowed scrapie clinical onset. As indicated by our simulations, 382
shorter monitoring lengths, as modelled by (Matthews et al., 2001) (median length 3.00 383
years), would have resulted in the observation of fewer clinical cases and a higher number of 384
subclinical cases. 385
386
Genetic susceptibility to scrapie and incubation period
387
The comparison of the fit provided by the mixture cure model and the traditional Cox 388
Proportional model indicated than our approach was more relevant when analysing the PrP 389
genotype and flock effects. According to our results, with ARQ homozygote animals as the 390
baseline, VRQ carriers were at higher risk of infection and ARR heterozygotes at lower risk. 391
This is consistent with most already published studies based on data collected from culled 392
flocks (Thorgeirsdottir et al., 1999; Tranulis et al., 1999; Acin et al., 2004; Billinis et al., 393
2004). 394
Incubation length is a major feature of TSE phenotype. In our population, while clinical signs 395
were delayed in ARR heterozygotes compared to ARQ homozygotes, no difference could be 396
observed between ARQ/VRQ carriers and ARQ homozygotes. Similar phenomenon was 397
observed in an Irish flock (O'Doherty et al., 2002). However it differed from estimations 398
obtained in a French Romanov flock (Elsen et al., 1999) and in a Texel flock (Baylis et al., 399
2002). In both these naturally affected scrapie flocks significant differences in age at death 400
were reported between ARQ/ARQ and ARQ/VRQ. 401
In sheep, experimental challenge indicated that incubation period depends both on sheep 402
genotype and TSE isolate. While most scrapie isolates will produce shorter incubation periods 403
in VRQ allele carriers, other TSE agent such as BSE will behave conversely (Foster et al., 404
2001; Jeffrey et al., 2006 ). In this context, difference in agent (strain) could be a possible 405
explanation for the observed variability. 406
In rodent scrapie models, it has been demonstrated that attack rate and incubation length 407
variations could be observed according to the infectious dose. Low infectious dose could lead 408
to incubation period lengthening and decreased infection efficiency (Kimberlin & Wilesmith, 409
1994; Jacquemot et al., 2005). In natural scrapie there is no available estimation of the actual 410
infectious pressure. Because of differences in the observed incidences, the infection pressure 411
is usually considered to be different according to the cohort considered within a flock or 412
between flocks (Baylis et al., 2002; Touzeau et al., 2005). In our study, scrapie incubation 413
duration appeared not to be associated with the infection rate. Age at clinical onset in 414
ARQ/ARQ infected animals also clearly differed (shorter incubation period in our study) from 415
previously reported in animals bearing the same genotype (Woolhouse et al., 1998; Elsen et 416
al., 1999; O'Doherty et al., 2002; Redman et al., 2002; Baylis et al., 2004). Taken together 417
these observations could suggest that (i) biologically different scrapie agents are involved in 418
the different flocks or that (ii) other factors linked to flock management could influence 419
incidence and incubation. 420
To go further, the evaluation of agent biodiversity in the studied cohorts from these flocks is 421
ongoing through biochemical studies and bioassays. Meanwhile the effect of increasing 422
infectious dose on incubation length in animals bearing similar PRP genotypes and which 423
were orally contaminated at birth is under investigation. 424
425
The mixture cure model presented here has revealed an interesting tool to analyze data 426
collected from longitudinal surveys in naturally affected scrapie flocks. Its main constraint is 427
the requirement of a long enough individual monitoring period. Finally, because such models 428
allow for the combinatory analysis of several covariate effects they should be considered as a 429
potential powerful tool for epidemiological analysis in animal diseases. 430
431
Acknowledgements
432
Financial support of this work was provided by EU project QLRT-2000-01733 433
“Scrapiefreesheep”. The authors wish to thank the technical staff of the Manech breeders’ 434
organization (Centre Départemental d’Elevage Ovins), and the Groupement de Défense 435
sanitaire des Pyrénées Atlantiques, for their involvement in the longitudinal survey of scrapie 436
affected flocks started in the middle of the 90’s. 437
References
Acin, C., Martin-Burriel, I., Goldmann, W., Lyahyai, J., Monzon, M., Bolea, R., Smith, A., Rodellar, C., Badiola, J. J. & Zaragoza, P. (2004). Prion protein gene polymorphisms in healthy and scrapie-affected Spanish sheep. J Gen Virol85, 2103-2110.
Andreoletti, O., Berthon, P., Levavasseur, E., Marc, D., Lantier, F., Monks, E., Elsen, J. M. & Schelcher, F. (2002). Phenotyping of protein-prion (PrPsc)-accumulating cells in lymphoid and neural tissues of naturally scrapie-affected sheep by double-labeling immunohistochemistry. J Histochem Cytochem50, 1357-1370.
Andreoletti, O., Berthon, P., Marc, D., Sarradin, P., Grosclaude, J., van Keulen, L., Schelcher, F., Elsen, J. M. & Lantier, F. (2000). Early accumulation of PrP(Sc) in gut-associated lymphoid and nervous tissues of susceptible sheep from a Romanov flock with natural scrapie. J Gen Virol
81, 3115-3126.
Baylis, M., Chihota, C., Stevenson, E., Goldmann, W., Smith, A., Sivam, K., Tongue, S. & Gravenor, M. B. (2004). Risk of scrapie in British sheep of different prion protein genotype. J Gen Virol85, 2735-2740.
Baylis, M., Goldmann, W., Houston, F., Cairns, D., Chong, A., Ross, A., Smith, A., Hunter, N. & McLean, A. R. (2002). Scrapie epidemic in a fully PrP-genotyped sheep flock. J Gen Virol83, 2907-2914.
Begara-McGorum, I., Clark, A. M., Martin, S. & Jeffrey, M. (2000). Prevalence of vacuolar lesions consistent with scrapie in the brains of healthy cull sheep of the Shetland Islands. Vet Rec
147, 439-441.
Benestad, S. L., Sarradin, P., Thu, B., Schonheit, J., Tranulis, M. A. & Bratberg, B. (2003).
Cases of scrapie with unusual features in Norway and designation of a new type, Nor98. Vet Rec
153, 202-208.
Billinis, C., Psychas, V., Leontides, L., Spyrou, V., Argyroudis, S., Vlemmas, I., Leontides, S., Sklaviadis, T. & Papadopoulos, O. (2004). Prion protein gene polymorphisms in healthy and scrapie-affected sheep in Greece. J Gen Virol85, 547-554.
Bohning, D. & Seidel, W. (2003). Editorial: recent developments in mixture models. Comput Stat Data An41, 349-357.
Clouscard, C., Beaudry, P., Elsen, J. M., Milan, D., Dussaucy, M., Bounneau, C., Schelcher, F., Chatelain, J., Launay, J. M. & Laplanche, J. L. (1995). Different allelic effects of the codons 136 and 171 of the prion protein gene in sheep with natural scrapie. J Gen Virol76 ( Pt 8), 2097-2101.
Cox, D. R. (1972). Regression Models and Life-Tables. J R Stat Soc Ser B Met34, 187-220.
Davison, A. C. & Hinkley, D. V. (1997).Bootstrap methods and their application. New-York: Cambridge University Press.
De Bosschere, H., Roels, S., Benestad, S. L. & Vanopdenbosch, E. (2004). Scrapie case similar to Nor98 diagnosed in Belgium via active surveillance. Vet Rec155, 707-708.
Detwiler, L. A. & Baylis, M. (2003). The epidemiology of scrapie. Rev Sci Tech22, 121-143.
Diaz, C., Vitezica, Z. G., Rupp, R., Andreoletti, O. & Elsen, J. M. (2005). Polygenic variation and transmission factors involved in the resistance/susceptibility to scrapie in a Romanov flock. J Gen Virol86, 849-857.
Eglin, R. D., Warner, R., Gubbins, S., Sivam, S. K. & Dawson, M. (2005). Frequencies of PrP genotypes in 38 breeds of sheep sampled in the National Scrapie Plan for Great Britain. Vet Rec
156, 433-437.
Elsen, J. M., Amigues, Y., Schelcher, F., Ducrocq, V., Andreoletti, O., Eychenne, F., Khang, J. V., Poivey, J. P., Lantier, F. & Laplanche, J. L. (1999). Genetic susceptibility and transmission factors in scrapie: detailed analysis of an epidemic in a closed flock of Romanov. Arch Virol144, 431-445.
Farewell, V. T. (1982). The use of mixture models for the analysis of survival data with long-term survivors. Biometrics38, 1041-1046.
Foster, J. D., Parnham, D., Chong, A., Goldmann, W. & Hunter, N. (2001). Clinical signs, histopathology and genetics of experimental transmission of BSE and natural scrapie to sheep and goats. Vet Rec148, 165-171.
Fraser, H. (1976). The pathology of a natural and experimental scrapie. Front Biol44, 267-305.
Hagenaars, T. J., Donnelly, C. A., Ferguson, N. M. & Anderson, R. M. (2003). Dynamics of a scrapie outbreak in a flock of Romanov sheep--estimation of transmission parameters. Epidemiol Infect131, 1015-1022.
Heggebo, R., Press, C. M., Gunnes, G., Lie, K. I., Tranulis, M. A., Ulvund, M., Groschup, M. H. & Landsverk, T. (2000). Distribution of prion protein in the ileal Peyer's patch of scrapie-free lambs and lambs naturally and experimentally exposed to the scrapie agent. J Gen Virol81, 2327-2337.
Hopp, P., Webb, C. R. & Jarp, J. (2003). Monte Carlo simulation of surveillance strategies for scrapie in Norwegian sheep. Prev Vet Med61, 103-125.
Hourrigan, J., Klingsporn, A. L., Clark, W. W. & de Camp, M. (1979). Epidemiology of scrapie in the Unided States. In Slow Transmissible Dideases of the Nervous System, pp. 331-356. Edited by S. B. Prusiner & W. J. Hadlow: New York : Academic Press.
Hunter, N., Goldmann, W., Foster, J. D., Cairns, D. & Smith, G. (1997). Natural scrapie and PrP genotype: case-control studies in British sheep. Vet Rec141, 137-140.
Hunter, N., Foster, J. D., Goldmann, W., Stear, M. J., Hope, J. & Bostock, C. (1996). Natural scrapie in a closed flock of Cheviot sheep occurs only in specific PrP genotypes. Arch Virol141, 809-824.
Jacquemot, C., Cuche, C., Dormont, D. & Lazarini, F. (2005). High incidence of scrapie induced by repeated injections of subinfectious prion doses. J Virol79, 8904-8908.
Jeffrey, M., Gonzalez, L., Chong, A., Foster, J., Goldmann, W., Hunter, N. & Martin, S. (2006). Ovine Infection with the Agents of Scrapie (CH1641 Isolate) and Bovine Spongiform Encephalopathy: Immunochemical Similarities can be Resolved by Immunohistochemistry. J Comp
Kimberlin, R. H. & Wilesmith, J. W. (1994). Bovine spongiform encephalopathy. Epidemiology, low dose exposure and risks. Ann N Y Acad Sci724, 210-220.
Kuk, A. Y. C. & Chen, C.-H. (1992). A Mixture Model Combining Logistic Regression with Proportional Hazards Regression. Biometrika79, 531-541.
Lam, K. F., Fong, D. Y. & Tang, O. Y. (2005). Estimating the proportion of cured patients in a censored sample. Stat Med24, 1865-1879.
Le Dur, A., Beringue, V., Andreoletti, O., Reine, F., Lai, T. L., Baron, T., Bratberg, B., Vilotte, J. L., Sarradin, P., Benestad, S. L. & Laude, H. (2005). A newly identified type of scrapie agent can naturally infect sheep with resistant PrP genotypes. Proc Natl Acad Sci U S A102, 16031-16036.
Maller, R. A. & Zhou, X. (1996).Survival analysis with long-term survivors. New York: Wiley.
Matthews, L., Coen, P. G., Foster, J. D., Hunter, N. & Woolhouse, M. E. (2001). Population dynamics of a scrapie outbreak. Arch Virol146, 1173-1186.
McKinley, M. P., Bolton, D. C. & Prusiner, S. B. (1983). A protease-resistant protein is a structural component of the scrapie prion. Cell35, 57-62.
O'Doherty, E., Healy, A., Aherne, M., Hanrahan, J. P., Weavers, E., Doherty, M., Roche, J. F., Gunn, M. & Sweeney, T. (2002). Prion protein (PrP) gene polymorphisms associated with natural scrapie cases and their flock-mates in Ireland. Res Vet Sci73, 243-250.
Onnasch, H., Gunn, H. M., Bradshaw, B. J., Benestad, S. L. & Bassett, H. F. (2004). Two Irish cases of scrapie resembling Nor98. Vet Rec155, 636-637.
Orge, L., Galo, A., Machado, C., Lima, C., Ochoa, C., Silva, J., Ramos, M. & Simas, J. P. (2004). Identification of putative atypical scrapie in sheep in Portugal. J Gen Virol85, 3487-3491.
Palhiere, I., François, D., Elsen, J. M., Barillet, F., Amigues, Y., Perrret, G. & Bouix, J. (2002).
Alleles frequencies of the PrP gene in 29 french sheep breeds. Possible use in selection for resistance to scrapie. In 7th WCGALP, session 13, pp. 13-16. Montpellier, France.
Peng, Y. & Dear, K. B. (2000). A nonparametric mixture model for cure rate estimation. Biometrics56, 237-243.
Peng, Y. & Carriere, K. C. (2002). An empirical Comparison of Parametric and semiparametric cure models. Biom J8, 1002-1014.
Race, R., Raines, A., Raymond, G. J., Caughey, B. & Chesebro, B. (2001). Long-term
subclinical carrier state precedes scrapie replication and adaptation in a resistant species: analogies to bovine spongiform encephalopathy and variant Creutzfeldt-Jakob disease in humans. J Virol75, 10106-10112.
Redman, C. A., Coen, P. G., Matthews, L., Lewis, R. M., Dingwall, W. S., Foster, J. D., Chase-Topping, M. E., Hunter, N. & Woolhouse, M. E. (2002). Comparative epidemiology of scrapie outbreaks in individual sheep flocks. Epidemiol Infect128, 513-521.
Ryder, S., Dexter, G., Bellworthy, S. & Tongue, S. (2004). Demonstration of lateral transmission of scrapie between sheep kept under natural conditions using lymphoid tissue biopsy. Res Vet Sci
Ryder, S. J., Spencer, Y. I., Bellerby, P. J. & March, S. A. (2001). Immunohistochemical detection of PrP in the medulla oblongata of sheep: the spectrum of staining in normal and scrapie-affected sheep. Vet Rec148, 7-13.
Thorgeirsdottir, S., Sigurdarson, S., Thorisson, H. M., Georgsson, G. & Palsdottir, A. (1999).
PrP gene polymorphism and natural scrapie in Icelandic sheep. J Gen Virol80 ( Pt 9), 2527-2534.
Thorgeirsdottir, S., Georgsson, G., Reynisson, E., Sigurdarson, S. & Palsdottir, A. (2002).
Search for healthy carriers of scrapie: an assessment of subclinical infection of sheep in an Icelandic scrapie flock by three diagnostic methods and correlation with PrP genotypes. Arch Virol147, 709-722.
Tongue, S. C., Pfeiffer, D. U., Warner, R., Elliott, H. & Del Rio Vilas, V. (2006). Estimation of the relative risk of developing clinical scrapie: the role of prion protein (PrP) genotype and selection bias. Vet Rec158, 43-50.
Touzeau, S., Chase-Topping, M. E., Matthews, L., Lajous, D., Eychenne, F., Hunter, N., Foster, J. D., Simm, G., Elsen, J. M. & Woolhouse, M. E. (2005). Modelling the spread of scrapie in a sheep flock: evidence for increased transmission during lambing seasons. Arch Virol.
Tranulis, M. A., Osland, A., Bratberg, B. & Ulvund, M. J. (1999). Prion protein gene
polymorphisms in sheep with natural scrapie and healthy controls in Norway. J Gen Virol80 ( Pt 4), 1073-1077.
van Keulen, L. J., Schreuder, B. E., Vromans, M. E., Langeveld, J. P. & Smits, M. A. (2000).
Pathogenesis of natural scrapie in sheep. Arch Virol Suppl, 57-71.
Woolhouse, M. E., Stringer, S. M., Matthews, L., Hunter, N. & Anderson, R. M. (1998).
Epidemiology and control of scrapie within a sheep flock. Proc R Soc Lond B Biol Sci265, 1205-1210.
Yu, B., Tiwari, R. C., Cronin, K. A. & Feuer, E. J. (2004). Cure fraction estimation from the mixture cure models for grouped survival data. Stat Med23, 1733-1747.
Table 1: size and within flock scrapie history for the 6 selected flocks. Flock
A B C D E F
Flock size (adult ewes) † 321 331 302 463 396 380
Estimated start of scrapie
outbreak 1992 1992 1993 1995 1996 1996
Number of scrapie clinical cases in ewes born before the studied cohorts of birth
135 70 96 150 90 190
† flock size at lambing of the studied cohorts of birth.
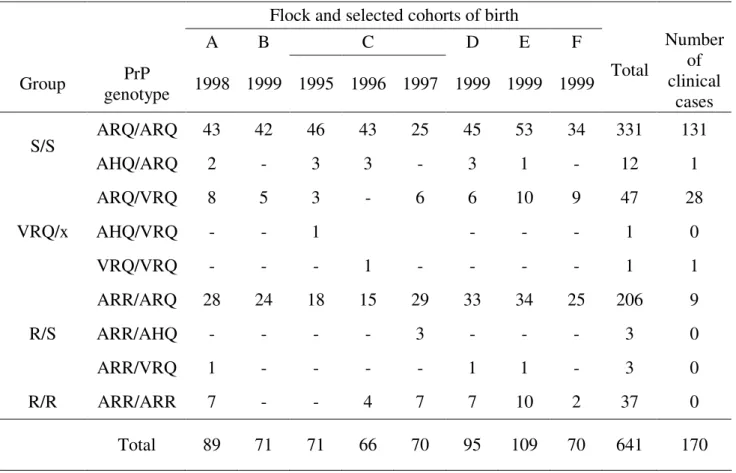
Table 2: PrP genotype distribution and number of clinical scrapie cases in the studied birth cohorts from 6 (A to F) naturally scrapie affected flocks.
Flock and selected cohorts of birth
A B C D E F Group PrP genotype 1998 1999 1995 1996 1997 1999 1999 1999 Total Number of clinical cases ARQ/ARQ 43 42 46 43 25 45 53 34 331 131 S/S AHQ/ARQ 2 - 3 3 - 3 1 - 12 1 ARQ/VRQ 8 5 3 - 6 6 10 9 47 28 AHQ/VRQ - - 1 - - - 1 0 VRQ/x VRQ/VRQ - - - 1 - - - - 1 1 ARR/ARQ 28 24 18 15 29 33 34 25 206 9 ARR/AHQ - - - - 3 - - - 3 0 R/S ARR/VRQ 1 - - - - 1 1 - 3 0 R/R ARR/ARR 7 - - 4 7 7 10 2 37 0 Total 89 71 71 66 70 95 109 70 641 170
Table 3: Clinical scrapie cases (numbers and percentages) per genotype group and median age at death (clinical scrapie) in the studied birth cohorts.
PrP genotype group Flock R/R R/S S/S VRQ/x A 7 7.90 % 29 32.58% 45 50.56% 8 8.99% B 0 0.00% 24 33.80% 42 59.15% 5 7.04% C 11 5.31% 65 31.40% 120 57.97% 11 5.31% D 7 7.37% 34 35.79% 48 50.53% 6 6.32% E 10 9.17% 35 32.11% 54 49.54% 10 9.17% F 2 2.86% 25 35.71% 34 48.57% 9 12.86% Total 37 5.77% 212 33.07% 343 54.51% 49 7.64% Clinical cases 0 9 4.25% 132 38.48% 29 59.18% Median age at death
(years) [min – max] -
3.61 [3.26 – 4.13] 1.62 [0.77 – 5.54] 2.05 [1.14 -4.76]
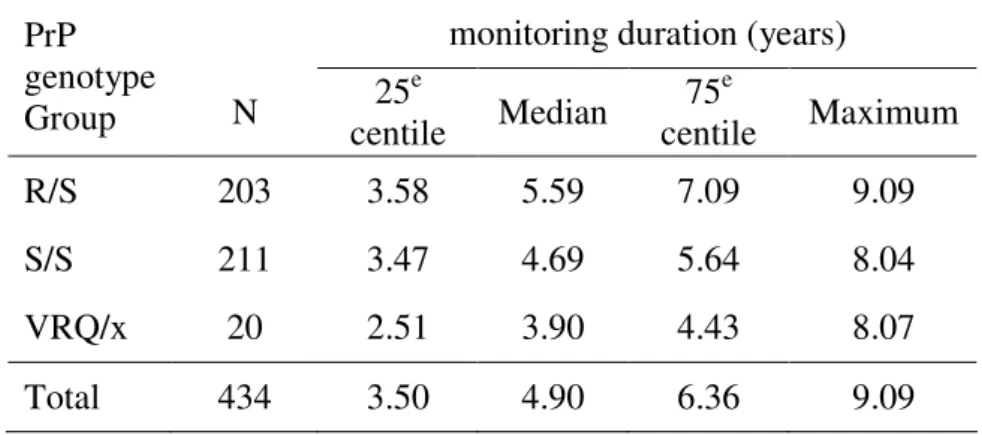
Table 4: Monitoring duration (years) in apparently healthy sheep from the studied birth cohorts. monitoring duration (years)
PrP genotype Group N 25 e centile Median 75e centile Maximum R/S 203 3.58 5.59 7.09 9.09 S/S 211 3.47 4.69 5.64 8.04 VRQ/x 20 2.51 3.90 4.43 8.07 Total 434 3.50 4.90 6.36 9.09
Table 5: Number and percentage of infected animals by PrP genotype group according to clinical cases and laboratory tests findings in clinically healthy animals and the logistic Cox PH mixture cure model in the studied birth cohorts.
Clinically healthy
sheep Estimated number (%) of infected sheep
PRP genotype
group
Clinical
cases Positive / tested
(total)
Clinical + subclinical cases (95 % CI)
logistic-CoxPH mixture cure model (point
estimate) R/R 0 0/5 (37) - - R/S 9 0/49 (203) 9 – 20 (4.24 – 9.43) 12.65 (5.97) S/S 132 4/152 (211) 136 – 142 (39.35 – 41.40) 146.83 (42.81) VRQ/x 29 1/14 (20) 30 – 33 (61.22 – 67.34) 31.22 (63.71) Total 170 5/220 (471) 175 - 195 (28.97 – 32.28) 190.70 (31.58)
† the lower bound is the observed proportion of scrapie infected sheep based on clinical survey and
laboratory tests, the upper bound is derived from the hypergeometric law to account for clinically healthy sheep without laboratory test (n = 251). The large confidence interval for R/S animals was due to the low proportion of sampled animals.
Table 6: Effects of PRP genotype and flock origin on incidence and incubation duration in the studied birth cohorts from 6 scrapie infected flocks according to the logistic-Cox PH mixture cure model.
Incidence Incubation duration
Variable OR CI95%* p† HR CI95%* p†
Genotype vs. S/S
R/S 0.08 0.04 – 0.14 <0.0001 0.28 0.14 – 0.56 0.0003
VRQ/x 2.71 1.41 – 5.21 0.003 0.84 0.55 – 1.28 0.4117
Flock vs. flock C (ARQ/ARQ animals only)
A 0.35 0.17 – 0.72 0.0045 1.75 0.95 – 3.22 0.0723
B 0.72 0.36 – 1.46 0.3695 2.49 1.46 – 4.25 0.0008
D 0.40 0.20 – 0.81 0.0113 1.92 1.08 – 3.43 0.0264
E 0.20 0.09 – 0.43 <0.0001 1.33 0.67 – 2.61 0.4144
F 1.74 0.76 – 3.89 0.1796 0.41 0.23 – 0.72 0.0021
OR = adjusted odds ratio; HR= adjusted hazard risk; *CI95% = 95 % confidence interval for OR and
HR estimated by the bias corrected accelerated bootstrap method over 5000 re-samples. † Level of
significance of the variable (p value). The S/S genotype group and flock C were used as baseline. The influence of flock could not be investigated in R/S and VRQ allele carriers groups, due to few clinical cases in some flocks.
Captions to figures
Figure 1: (A) simulation design for incubation lengths. Survival distribution functions for
simulation design 1, (black dotted lines, median age at onset 3.3 and 4.45 years) and simulation design 2 (grey dotted lines, median age at onset 2 and 3 years) ; survival distribution function for scrapie clinical cases in the studied population (solid black line). (B and C) Absolute biases of the
estimates for each monitoring scenario (B, simulation design 1 and C simulation design 2) using the mixture cure model: white circle ( 0), proportion of infected individuals; white square ( 1), effect of
covariate Z1 on the incidence; white triangle ( 2), effect the Z2 on the incidence; black square ( 1),
effect of covariate Z1 on latency, black triangle ( 2), effect of covariate Z2 on latency.
Figure 2: Kaplan-Meier survival distribution functions for deaths from scrapie in the studied birth
cohorts from 6 flocks of Manech Red Faced sheep. Overall sample (solid line, n=604); R/S genotype group (dotted line, n=212); S/S genotype group (medium dashed line, n=343); VRQ allele carrier group (long dashed line, n=49). Survival times are measured from date of birth. Censored events (i.e. culling or deaths from causes other than scrapie) are shown as circles. The last observed clinical case (5.54 years old) is indicated by the black arrow.