HAL Id: inria-00616097
https://hal.inria.fr/inria-00616097
Submitted on 26 Jul 2013
HAL is a multi-disciplinary open access
archive for the deposit and dissemination of
sci-entific research documents, whether they are
pub-lished or not. The documents may come from
teaching and research institutions in France or
abroad, or from public or private research centers.
L’archive ouverte pluridisciplinaire HAL, est
destinée au dépôt et à la diffusion de documents
scientifiques de niveau recherche, publiés ou non,
émanant des établissements d’enseignement et de
recherche français ou étrangers, des laboratoires
publics ou privés.
Combined diffusion imaging and MR spectroscopy in the
diagnosis of human prion diseases.
Damien Galanaud, Stéphane Haïk, Marius George Linguraru, Jean-Philippe
Ranjeva, Baptiste Faucheux, Elsa Kaphan, Nicholas Ayache, Jacques Chiras,
Patrick J Cozzone, Didier Dormont, et al.
To cite this version:
Damien Galanaud, Stéphane Haïk, Marius George Linguraru, Jean-Philippe Ranjeva, Baptiste
Faucheux, et al.. Combined diffusion imaging and MR spectroscopy in the diagnosis of human prion
diseases.. American Journal of Neuroradiology, American Society of Neuroradiology, 2010, 31 (7),
pp.1311-8. �10.3174/ajnr.A2069�. �inria-00616097�
ORIGINAL RESEARCH
Combined Diffusion Imaging and MR
Spectroscopy in the Diagnosis of Human Prion
Diseases
D. Galanaud S. Haik M.G. Linguraru J.-P. Ranjeva B. Faucheux E. Kaphan N. Ayache J. Chiras P. Cozzone D. Dormont J.-P. BrandelBACKGROUND AND PURPOSE: The physiopathologic bases underlying the signal intensity changes and reduced diffusibility observed in prion diseases (TSEs) are still poorly understood. We evaluated the interest of MRS combined with DWI both as a diagnostic tool and a way to understand the mechanism underlying signal intensity and ADC changes in this setting.
MATERIALS AND METHODS:We designed a prospective study of multimodal MR imaging in patients with suspected TSEs. Forty-five patients with a suspicion of TSE and 11 age-matched healthy volunteers were included. The MR imaging protocol included T1, FLAIR, and DWI sequences. MRS was performed on the cerebellum, pulvinar, right lenticular nucleus, and frontal cortex. MR images were assessed visually, and ADC values were calculated.
RESULTS: Among the 45 suspected cases, 31 fulfilled the criteria for probable or definite TSEs (19 sCJDs, 3 iCJDs, 2 vCJDs, and 7 genetic TSEs); and 14 were classified as AltDs. High signals in the cortex and/or basal ganglia were observed in 26/31 patients with TSEs on FLAIR and 29/31 patients on DWI. In the basal ganglia, high DWI signals corresponded to a decreased ADC. Metabolic alterations, increased mIns, and decreased NAA were observed in all patients with TSEs. ADC values and metabolic changes were not correlated; this finding suggests that neuronal stress (vacuolization), neuronal loss, and astrogliosis do not alone explain the decrease of ADC.
CONCLUSIONS:MRS combined with other MR imaging is of interest in the diagnosis of TSE and provides useful information for understanding physiopathologic processes underlying prion diseases.
ABBREVIATIONS:ADC⫽ apparent diffusion coefficient; AltD ⫽ alternative diagnosis; Avg ⫽ average; C (or c)⫽ control; Cho ⫽ choline; CJD ⫽ Creutzfeldt-Jakob disease; Cr ⫽ creatine; DWI ⫽ diffusion-weighted imaging; EEG⫽ electroencephalograph; FFI ⫽ fatal familial insomnia; FLAIR ⫽ fluid-attenu-ated inversion recovery; GABA⫽ gamma-aminobutyric acid; gCJD ⫽ genetic CJD; Glx ⫽ glutamine-glutamate-GABA; GSS⫽ Gerstmann Strausser Sheinker syndrome; iCJD ⫽ iatrogenic CJD; mIns ⫽ myo-inositol; MM⫽ methionine homozygosity (PRNP: genotype at codon 129); MRS ⫽ MR spectros-copy; MRI⫽ MR imaging; MV ⫽ methionine-valine heterozygosity (PRNP: genotype at codon 129); NA⫽ data not available; NAA ⫽ N-acetylaspartate; NS ⫽ not significant or nonspecific slow waves; P (or p)⫽ patient; PRNP ⫽ genotype at codon 129; PrP ⫽ prion protein or persistent plexus gene; S ⫽ sum of metabolites; sCJD⫽ sporadic CJD; TSE ⫽ human transmissible spongiform encephalopathy; vCJD⫽ variant CJD; VV ⫽ valine homozygosity (PRNP: genotype at codon 129)
M
R imaging has become a tool of choice in the diagnosis of several forms of prion diseases (TSEs). The presence of ar-eas of incrar-eased signal intensity, usually associated with a de-creased ADC, are frequently observed on the cortex, thalamus,and/or basal ganglia of patients with sCJD, vCJD, or iCJD. How-ever, the exact physiopathologic processes underlying these changes are still subject to debate. They have been variously at-tributed to the PrP deposits, the morphologic changes of neu-rons, or gliosis.1-3Correlation of these signal-intensity changes
with pathologic data is further impaired by their modification during the time course of the disease.4-6MRS can, on the other
hand, be performed simultaneously with conventional imaging and can give information on the ongoing pathologic processes: Neuronal loss or stress will lead to a decrease in NAA, while gliosis will induce an increase in the resonance of mIns. Hence, to deter-mine the diagnostic value of MRS in TSEs and to better under-stand the physiopathologic processes underlying the signal inten-sity/ADC changes, we prospectively studied 45 patients clinically suspected of having prion diseases with a multimodal MR imag-ing protocol, includimag-ing MRS and conventional and diffusion imaging.
Materials and Methods
This prospective study was approved by the committee on ethics of La Timone Hospital. Patients (or their representatives) and controls gave written informed consent to participate in the study.
Received August 19, 2009; accepted after revision December 13.
From the Departments of Neuroradiology (D.G., J.C., D.D.) and Pathology (S.H., B.F.), Cellule de re´fe´rence des maladies a` prions (S.H., J.-P.B.) Pitie´-Salpeˆtrie`re Hospital, Paris, France; INSERM UMRS 975 CNRS UMR 7225 centre de recherche de l’institut du cerveau et de la moe¨lle e´pinie`re (D.D., D.G., S.H., B.F., J.-P.B.), Pitie´ Salpeˆtrie`re Hospital, Paris, France; Universite´ Pierre et Marie Curie, Paris 6 (D.G., D.D., J.C., L.P.), France; CRMBM-CEMEREM, UMR CNRS 6612 (J-P.R., P.C.), Faculte´ de Me´decine La Timone and Department of Neurology (E.K.), La Timone Hospital Marseille, France; Epidaure/Asclepios Research Group (M.G.L., N.A.), Institut National de Recherche en Informatique et Automatique, Sophia Antipolis, France; and Department of Radiology and Imaging Sciences (M.G.L.), Clinical Center, National Institutes of Health, Bethesda, Maryland.
This work was supported by a grant from the Groupement d’inte´reˆt spe´cifique “Prions.” Other financial support for this work was provided by the French Ministry of Research, the Centre National de la Recherche Scientifique, and the Institut Universitaire de France. Please address correspondence to Damien Galanaud, MD, Department of Neuroradiology, Pitie´ Salpeˆtrie`re Hospital, 47 Blvd de l’Hoˆpital, F-75013 Paris, France; e-mail: galanaud@ dat.org
Indicates open access to non-subscribers at www.ajnr.org
indicates article with supplemental on-line table. DOI 10.3174/ajnr.A2069
BRAIN
ORIGINAL
Selection and Classification of Patients
Patients were referred to the neurology departments of La Pitie´ Sal-peˆtrie`re (Paris) and La Timone hospital (Marseille) for suspicion of TSEs (sporadic, genetic, iatrogenic, or variant). This diagnosis was reassessed by 2 neurologists who were experts in prion diseases (J.-P.B. and S.H.). Patients then underwent a multimodal MR imag-ing, which was part of an extensive evaluation, including 14.3.3 pro-tein detection in the CSF, EEG, and genotyping of the PrP gene. Tonsil biopsies were performed when vCJD was suspected. Postmortem ex-amination was performed in 9 subjects. The eventual diagnosis was based on the World Health Organization clinical diagnostic criteria for prion diseases.7The pathologic findings in the patient with FFI
were published in a previous article.8
MR Imaging Protocol
MR imaging examinations were performed on 1.5T magnets at La Pitie´ Salpeˆtrie`re, Paris (Signa HDx; GE Healthcare, Milwaukee, Wis-consin) and at La Timone Hospital, Marseille (Vision; Siemens, Er-langen, Germany). Patients were given a light sedation with hy-droxyzine dichlorhydrate, 100 mg, when required by their clinical status. Pulse saturometry was monitored during the procedure. Total time inside the magnet was approximately 1 hour. The MR imaging protocol included the following:
1) A sagittal T1-weighted sequence.
2) One axial T1-weighted sequence (TR⫽ 644 ms, TE ⫽ 15 ms, 3-mm thickness, interleaved).
3) An axial FLAIR sequence (TR⫽ 8000 ms, TI ⫽ 2200 ms, TE ⫽ 110 ms, 5-mm thickness, interleaved).
4) DWI (single-shot echo-planar imaging sequence; b⫽ 0, 500, 1000 s/mm2applied in the x, y, and z directions sequentially; 19
sec-tions; 5-mm thickness; matrix⫽ 128 ⫻ 128; FOV ⫽ 256 ⫻ 256 mm2). ADC maps were reconstructed by using this sequence as
previously described.9
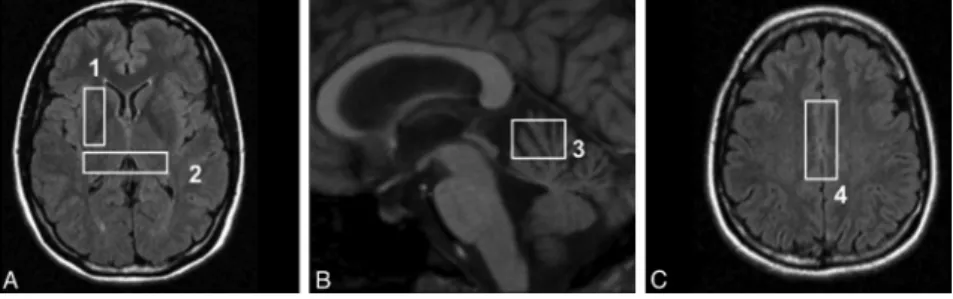
5) Four stimulated echo acquisition mode single-voxel spectroscopy acquisitions (TR⫽ 1500 ms, TE ⫽ 20 ms, TM ⫽ 30 ms) on regions known to be frequently involved in prion diseases: the cerebellar vermis (voxel size, 20⫻ 20 ⫻ 15 mm), the pulvinar (voxel location as previously described10), the right lenticular nucleus (voxel size,
35⫻ 15 ⫻ 15 mm), and the bifrontal cortex (voxel size, 40 ⫻ 20 ⫻ 15 mm). The locations of the voxels are shown on Fig 1. Processing of MR Images and Spectra
MR images were analyzed with 2 methods:
1) MR imaging examinations were interpreted by 2 expert neurora-diologists (D.G. and D.D.). Signal intensity on FLAIR and DWIs was evaluated side by side in cortical regions (frontal, temporoin-sular, and parieto-occipital) and 3 areas of the basal ganglia
(cau-date, putamen, and thalamus). Signal intensity was ranked from 1 to 4 as follows: 1, normal; 2, dubious area of increased signal in-tensity; 3, obvious area of increased signal inin-tensity; and 4, area of markedly increased signal intensity. Differences between observ-ers were settled by consensus.
2) ADC values were calculated by using the software provided by the manufacturers in the following locations: head of the caudate nu-clei, putamen, thalamus, and pulvinar. ADC regions were drawn on the DWI image, on the section on which each nucleus had the greatest extension. The voxel included the whole structure present on this section minus the pixels closest to the ventricles, to avoid partial volume effect. Because of partial volume effects, we did not calculate the ADC in the cerebellum and frontal cortex. Quantification of MR Spectra
The MRS data were analyzed by using a dedicated software described elsewhere.11Resonances were assigned according to those described
in the literature.12,13 Spectra were processed as previously
de-scribed.14,15Briefly, we manually corrected the baselines and
inte-grated the resonances of the following metabolites: NAA, Cr, Cho, mIns, and Glx. The value of each metabolite was then divided by the sum (S⫽ NAA ⫹ Cr ⫹ Cho ⫹ mIns ⫹ Glx) of all metabolite values (semiquantitative evaluation). This semiquantitative analysis, the sum of metabolites, was preferred to the calculation of individual metabolite ratios (eg, NAA/Cr or Cho/Cr), which are dependent on both numerator and denominator variations. For instance, a de-creased NAA/Cr ratio could be attributed to both a reduction in NAA (resulting from neuronal stress) or an increase in Cr (resulting from a glial activation or proliferation).16-18Ratios of the sum of metabolites
“smoothen” these variations and enable a better evaluation of the variations of the metabolite in the numerator. However, we did eval-uate the mIns/NAA ratio. Because NAA is a neuronal marker and mIns is a glial marker, this ratio simultaneously evaluates neuronal stress/death and gliosis, which are 2 of the main histologic landmarks of prion diseases. The presence of detectable free lipids and lactate was also assessed.
Statistical Analysis
Statistical analysis was performed by using the JMP software (SAS Institute, Cary, North Carolina). Differences among patients, volun-teers, and AltDs were determined by a Kruskal-Wallis analysis fol-lowed by a Scheffe´ test with a Bonferroni correction for multiple comparisons. The statistical analysis was also performed on the sub-group of patients with sCJD, who were compared with controls by using an unpaired Student t test. Due to the small numbers and het-erogeneity of the other subtypes of CJD and AltDs, no further statis-tical analysis could be performed on these patients and their meta-bolic anomalies were only described.
Results
Forty-five patients were prospectively studied. The diagno-sis of prion diseases was eventually confirmed in 31 subjects and included 1 FFI, 1 GSS, 2 vCJD, 3 iCJD related to growth hormone treatment of CJD, 5 gCJD, and 19 sCJD. The mean time between first symptoms and the MR imaging exami-nation was 7 months. The median duration of disease in sCJD was 7 months. Genotype at codon 129 of the PRNP gene was determined in 29/31 subjects. The patients’ main clinical and paraclinical characteristics are shown in Table 1.
The diagnoses for the other 14 patients were the following: 2 Alzheimer diseases, 1 vascular dementia, 1 Hashimoto en-cephalitis, 1 depression, 1 metabolic, 1 epileptic encephalopa-thy, 1 atypical Parkinson disease, 1 paraneoplastic syndrome, and 5 dementias of unknown etiology.
Conventional Imaging
High signals in the cortex and/or basal ganglia were observed in 26/31 patients with TSEs on FLAIR sequence. The 5 patients with normal findings on the FLAIR sequence were the ones with FFI and the GSS, 1/19 sCJD and 1/3 iCJD, and 1 codon 200 mutation of the 5 cases of gCJD.
On the DWI sequence, 29/31 patients had abnormalities: 26/31 on the cortical areas and 25/31 on the basal ganglia. The 3 patients with normal FLAIR findings and lesions on the DWI
Fig 2. Typical images in cases of sCJD (A), vCJD (B), and gCJD (C). FLAIR, DWI, and ADC
map, respectively, are shown. Areas of increased signal intensity, which involve the cortex and the striatum are more extensive and more clearly visible on diffusion images. On the basal ganglia, these changes are associated with a decreased ADC. There is widespread involvement of the cortex in the patient with sCJD. gCJD and vCJD both present with lesions of the thalamus and lenticular nuclei. However, in the variant case, as opposed to the genetic one, the areas of high signal intensity are more pronounced in the pulvinar than in the striatum as has been previously described in this phenotype.
Table 1: Main clinical and paraclinical data of patients
No. Form Age (yr) PRNP EEGa 14.3.3b Durationc MRI Delayedd
1 FFIe 54 MM D178N-129 mol/L NS – 6 5 2 gCJDe 69 MM E200K ⫹ ⫹ 4 6 3 gCJDe 58 MM E200K ⫹ NA 6 3 4 gCJDe 49 MV D178N-129V – – 10⫹ 4 5 gCJDe 70 MV V203I NS ⫹ 11 10 6 gCJDe 67 MM E200K NA NA 5 3 7 iCJD 18 MV NA – 16 6 8 iCJD 34 MV ⫹ ⫹ 23 8 9 iCJDe 25 MM – – 12 8 10 GSSe 47 MV P102 L – – 54 27 11 vCJD 43 MM ⫹ – 15 12 12 vCJD 52 MM NS – 8 7 13 sCJD 66 NA NA NA NA 3 14 sCJDe 54 MV ⫹ ⫹ 10 6 15 sCJDe 62 MM ⫹ ⫹ 19 7 16 sCJDe 66 VV ⫹ ⫹ 4 2 17 sCJDe 51 MM ⫹ ⫹ 4 2 18 sCJD 56 MV – ⫹ 13 8 19 sCJD 74 MM NA NA 3 2 20 sCJD 52 MM ⫹ ⫹ 3 2 21 sCJDe 81 MM ⫹ ⫹ 4 4 22 sCJD 53 MV NS ⫹ 21 1 23 sCJD 55 MV ⫹ – 60⫹ 23 24 sCJD 80 MV ⫹ – 9 8 25 sCJD 77 MV ⫹ – 24⫹ 10 26 sCJD 40 NA NA NA 10⫹ 9 27 sCJD 72 MM ⫹ ⫹ 3 2 28 sCJDe 64 MM ⫹ ⫹ 4 1 29 sCJD 55 NA – ⫹ 26 20 30 sCJD 84 NA NA NA 5 3 31 sCJD 80 NA NS – 2 1
Note:— – indicates not present.
a⫹ Indicates periodic sharp wave complexes. b
Detection of 14.3.3 protein in the CSF.
cDuration of the disease in months. d
Time in months between first symptoms and MR imaging examination.
sequence were the patient with gCJD, who presented clear abnormalities on both cortical areas and basal ganglia; the one with sCJD, who had widespread involvement of the cortex; and the one with iatrogenic CJD, who had clear involvement of the striatum.
Neither patients with an AltD nor the control subjects had areas of increased signal intensity or reduced diffusibility in the cortex or basal ganglia.
Typical images are shown on Fig 2. The frequency of in-volvement of the major brain structures is summarized on Table 2.
ADC Values
ADC values were significantly reduced in the head of the cau-date nuclei, thalamus, pulvinar, and lenticular nuclei in pa-tients with prion disease compared with controls (P⬍ 10⫺2in all cases). This difference was also present when the analysis was restricted to subjects with sCJD.
In patients with AltDs, ADC values were not significantly different from those of controls.
MRS
A summary of MRS results is given in On-line Table 1. Typical spectra are shown in Fig 3. MRS could be performed in all patients and controls. Some spectra had to be excluded be-cause of poor quality in 1 control (lenticular voxel) and 2 patients with CJD (a pulvinar acquisition in a patient with sCJD and a lenticular acquisition in the patient with FFI). No difference was observed in the metabolic ratios between the controls in the 2 MR imaging centers.
The NAA/S, the mIns/S, and mIns/NAA ratios showed dif-ferences in the global (Kruskal-Wallis) analysis. No other met-abolic ratio was significantly different between groups. The NAA/S ratio was lower and the mIns/S and mIns/NAA ratios were higher in patients with prion disease compared with con-trols in most studied voxels (On-line Table 1). The mIns/NAA ratio was the only one to be significantly different in all 4 voxels (Fig 4).
In the lenticular and pulvinar nuclei, where both MRS was performed and ADC values could be calculated, no metabolic ratio was significantly correlated to ADC values (Fig 5),
re-gardless of the presence of areas of increased signal intensity in FLAIR or DWI.
No parameter on DWI or MRS was correlated to the sur-vival of the patients.
Discussion
While the value of MR imaging for the diagnosis of most sub-types of prion diseases has been well established in several large retrospective studies, the pathologic bases of the observed sig-nal-intensity changes on diffusion and T2/FLAIR images are still imperfectly understood. Correlating signal intensity or ADC changes with the findings at autopsy is of crucial impor-tance but should be complemented by in vivo studies because it is known that the pattern of lesions on MR imaging can change during the course of the disease,4,6,19,20and because the
interval between MR imaging and death is often long. MRS is a noninvasive method to study brain metabolism, which can be performed during the same examination as diffusion imag-ing and can thus allow the synchronous evaluation of diffusion lesions and cellular changes.
The MRS results in our study are in accordance with the classic pathologic findings in prion diseases. The metabolic alterations are a decrease in NAA/S, which corresponds to neuronal stress and death, and an increase in mIns/S, which is a marker of gliosis. To our knowledge, this study is the first prospective evaluation of MRS in human prion diseases. Our findings are similar to those reported in previously published articles of human and animal models of prion diseases.4,10,21-27
We did not observe any correlation between ADC values and any metabolic ratio. This does not support neuronal stress such as vacuolization (spongiform changes) as the main factor that could explain a reduced diffusibility of water.28Because
gliosis increases ADC,3we can speculate a role for PrP deposits in the decrease of ADC. The normalization of the ADC values observed in some patients later in the course of the disease could be explained at least in part by the subsequent develop-ment of gliosis.8This hypothesis could be verified with fol-low-up examinations, which could show an increase in mIns. However, while they were initially intended in our study, they could not be performed due to the rapidly worsening clinical condition of most patients. A specific postmortem study of radiopathologic correlations with extensive quantification of tissue alterations, including spongiform change, astrogliosis, microglial activation, and neuronal loss together with an as-sessment of abnormal protein accumulation, will help to bet-ter understand the pathologic supports of each neuroradio-logic perturbation. The distinct prion-related lesions may influence differently, and sometimes with opposite effects, each MR imaging component.
The high frequency of metabolic alterations on MRS in patients with prion diseases can be explained by the targeting of MRS to the regions most commonly affected by these dis-eases. However, metabolic alterations were not present in all 4 locations in every patient. This is in accordance with the het-erogeneous distribution of the pathologic changes in these dis-eases.29In addition, variations in NAA and mIns were also not
systematically associated and could be found separately. These results are in agreement with the pathologic pattern of prion diseases, which diversely associates neuronal impairment and gliosis and varies among brain regions.
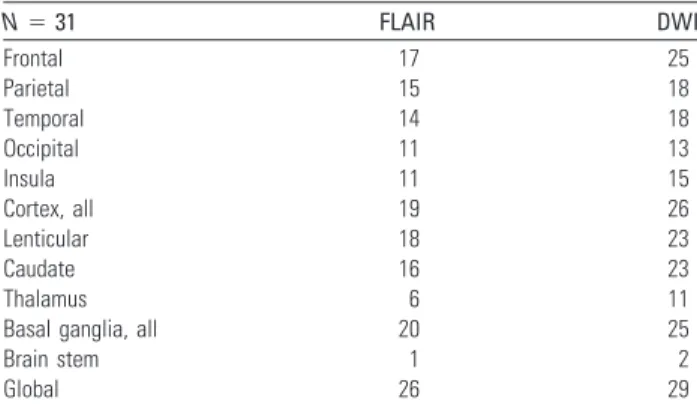
Table 2: Number of patients presenting with areas of significant (>3 on the visual scale) increased signal/decreased ADC in the
different brain structuresa
N⫽ 31 FLAIR DWI Frontal 17 25 Parietal 15 18 Temporal 14 18 Occipital 11 13 Insula 11 15 Cortex, all 19 26 Lenticular 18 23 Caudate 16 23 Thalamus 6 11
Basal ganglia, all 20 25
Brain stem 1 2
Global 26 29
a
The most frequently involved cerebral lobes are the frontal, the temporal, and the parietal. In the deep brain structures, the lenticular and the caudate nuclei are affected in a similar number of patients
The coherence of these results with the pathologic data is reinforced by the findings in some subtypes: In the 2 cases of vCJD, the most severely affected areas were the pulvinars,30
with a marked decrease in NAA/S and increase in mIns/S ra-tios, with vCJD being characterized by the occurrence of se-vere neuronal loss with intense gliosis in this region. In addi-tion, the 3 patients with iCJD exhibited stronger decreased NAA/S in the cerebellum compared with the population with sCJD. This is in agreement with the early and predominant cerebellar symptoms and the neuropathologic patterns that are regularly observed in this form.31
We observed a higher sensitivity of FLAIR (84%) than was previously reported by Tschampa et al32in a large
retrospec-tive study (47%) of patients from different institutions. This can probably be explained by a homogeneous acquisition pro-tocol on similar MR imaging magnets in our study.
The sensitivity (94%) of diffusion imaging was higher than
previously observed in retrospective studies32,33and similar
(92.3%) to the only prospective study that evaluated DWI in prion diseases so far.34This sequence is thus clearly the most
sensitive among conventional MR imaging acquisitions for the diagnosis of prion diseases. The 2 cases with negative find-ings were genetic forms (1 FFI and 1 GSS). All cases of sCJD, gCJD, and iCJD had abnormalities on the DWI sequence. No patient with an AltD had areas of decreased ADC, confirming the high specificity of DWI for the diagnosis of prion diseases in the clinical setting of dementia of rapid onset.
One of 19 patients with sCJD had no lesions on the FLAIR sequence. The cortex was involved in 16/19 patients and the basal ganglia, in 13/19. All patients had areas of increased sig-nal intensity on DWI, involving the cortex (19/19) and the basal ganglia (15/19). The distribution of lesions among the cortex and basal ganglia was similar to the one reported re-cently by Meissner et al.35Results of the analysis of MRS and
Fig 3. Typical spectra recorded in a patient with sCJD (left column) and in a healthy volunteer (right column) in the vermis, pulvinar, right lenticular nucleus, and frontal gray matter.
Metabolic anomalies are observed on the bifrontal voxel (decreased NAA and increased mIns), on the lenticular voxel (decreased NAA), and on the bipulvinar voxel (decreased NAA and increased mIns). Note that to get an accurate idea of NAA and mIns variations, one should compare their resonances with “stable” metabolites (eg, Cr).
ADC data performed on this subgroup of patients were com-parable to those of the total group of patients with prion dis-eases (On-line Table 1).
Among the 17 patients with sCJD for which the genotype of
PRNP at codon 129 was available, 9 had the MM; 7, the MV;
and 1, the VV phenotype. Median duration of the disease was 4 months for the MM phenotype and 11.5 months for patients with MV and VV phenotypes. On FLAIR imaging, lesions of the basal ganglia were more frequent in patients with the MV or VV (7/8) phenotypes than in subjects with the MM (4/9) phenotype.
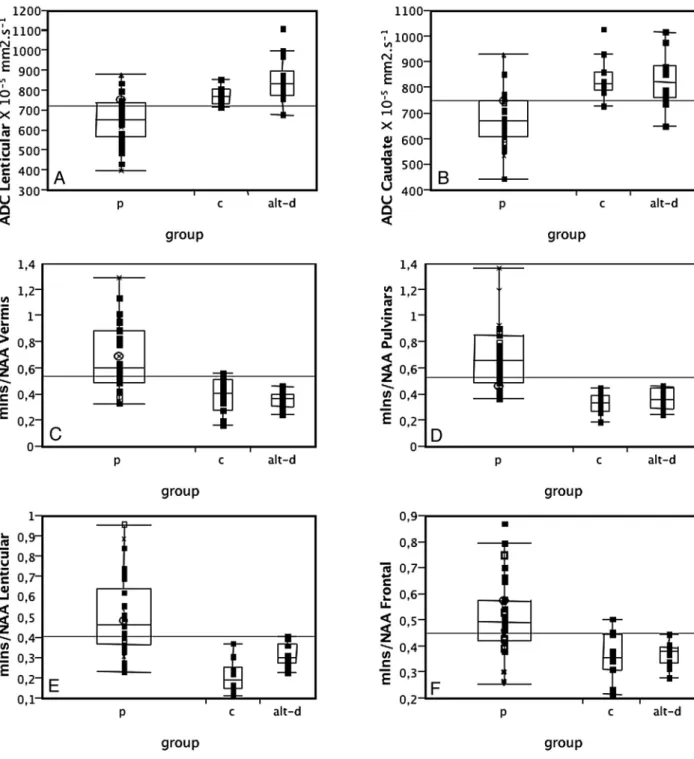
MR imaging findings in gCJD were heterogeneous. The patient with mutation D178N-129V had extensive areas of increased signal intensity on the cortex, on both FLAIR and DWI, with only minimal involvement of the basal ganglia (hy-persignal of the left caudate). One patient with mutation 200 had no abnormalities on the FLAIR sequence but showed ar-eas of hypersignal on the DWI sequences in the left striatum and frontal and insular cortices. The 2 other patients with mutation 200 had marked hypersignals in the striatum on both FLAIR and DWI imaging. Involvement of the cortex was also present on DWI. These results (frequency of involvement Fig 4. ADC values in the lenticular (A) and caudate (B) nuclei and mIns/NAA ratios on the vermis (C), pulvinar (D), right lenticular nucleus (E), and frontal gray matter (F) in patients with
prion disease (p), controls (c), and those with AltD. ADC is decreased and mIns/NAA is increased in patients with prion disease compared with both controls and AltDs. Neither ADC values nor the mIns/NAA ratios can discriminate between the 2 latter groups.
of the basal ganglia and cortical lesions detected on DWI) are comparable with those previously described in a population of subjects with mutation 200.36 The patient with mutation V203I had diffuse lesions on both the cortex and basal ganglia. ADC values were diminished in the basal ganglia of all pa-tients. Spectroscopic findings in the 5 genetic cases were sim-ilar to those of sporadic cases.
Among patients with iCJD, FLAIR imaging findings were normal in 1 patient; showed lesions restricted to the striatum in 1; and evidenced widespread involvement of the striatum, thalamus, periaqueductal gray matter, and cortex in another. On DWI, all patients showed marked areas of increased signal intensity in the striatum, which were associated with decreased ADC values. The 3 cases of iCJD had in common a markedly reduced NAA/S in the cerebellar vermis. MRS results were otherwise heterogeneous.
We observed the classic imaging pattern of vCJD, with hy-persignals of the basal ganglia in both FLAIR and DWI se-quences, predominating in the pulvinar (pulvinar sign). No lesions were seen on the cortex. The 2 patients with vCJD had similar spectroscopic findings, in accordance with previously published reports of MRS in this disease by the authors (about a previous patient) and others.10,21,26A pronounced decrease in NAA/S and an increase in mIns/S were present in the pulv-inar. The metabolic abnormalities in the lenticular nuclei were limited to an increase in mIns, and the metabolic profiles of the vermis and the frontal cortex were both normal.
The patient with FFI had normal findings on FLAIR and DWI. Most interesting, as opposed to all other cases of prion diseases, ADC values were increased in the thalamus com-pared with those in healthy volunteers. MRS showed a de-crease in NAA/S on the pulvinar, associated with an inde-creased mIns/S. The metabolic profiles of the frontal cortex and of the vermis were normal, and the lenticular nucleus was not interpretable.
The patient with GSS had normal findings on FLAIR and DWI, except a moderate cerebellar atrophy. ADC values were within the normal range in all the locations studied. MRS showed diffuse changes overall similar to those of patients with sCJD. The most striking abnormality was a pronounced decrease in NAA/S in the lenticular nucleus.
Conclusions
Metabolic changes were detected in all patients with sporadic, inherited, or infectious prion diseases in at least 1 of the stud-ied voxels, even in areas that looked normal on conventional
imaging. In addition, we confirm, in this prospective study, that DWI has the highest sensitivity (94%) among the conven-tional MR imaging sequences. No metabolic ratio was corre-lated to ADC values, indicating that these 2 imaging modali-ties explore different pathologic processes. It should now be of great interest to confirm the specificity of DWI and MRS by a study on a large non-CJD population with dementia and to explore further the neuropathologic bases of MR imaging al-terations in humans and in experimental in vivo models of prion diseases.
Acknowledgments
The authors are indebted to the patients who took part in this study and their families.
References
1. Bahn MM, Parchi P. Abnormal diffusion-weighted magnetic resonance
im-ages in Creutzfeldt-Jakob disease. Arch Neurol 1999;56:577– 83
2. Finkenstaedt M, Szudra A, Zerr I, et al. MR imaging of Creutzfeldt-Jakob
dis-ease. Radiology 1996;199:793–98
3. Haik S, Dormont D, Faucheux BA, et al. Prion protein deposits match
mag-netic resonance imaging signal abnormalities in Creutzfeldt-Jakob disease.
Ann Neurol 2002;51:797–99
4. Oppenheim C, Zuber M, Galanaud D, et al. Spectroscopy and serial diffusion
MR findings in hGH-Creutzfeldt-Jakob disease. J Neurol Neurosurg Psychiatry
2004;75:1066 – 69
5. Tribl GG, Strasser G, Zeitlhofer J, et al. Sequential MRI in a case of
Creutzfeldt-Jakob disease. Neuroradiology 2002;44:223–26
6. Ukisu R, Kushihashi T, Kitanosono T, et al. Serial diffusion-weighted MRI of
Creutzfeldt-Jakob disease. AJR Am J Roentgenol 2005;184:560 – 66
7. Brandel JP, Delasnerie-Laupretre N, Laplanche JL, et al, Diagnosis of
Creutzfeldt-Jakob disease: effect of clinical criteria on incidence estimates.
Neurology 2000;54:1095–99
8. Haik S, Galanaud D, Linguraru MG, et al. In vivo detection of thalamic gliosis:
a pathoradiologic demonstration in familial fatal insomnia. Arch Neurol
2008;65:545– 49
9. Nicoli F, Lefur Y, Denis B, et al. Metabolic counterpart of decreased apparent
diffusion coefficient during hyperacute ischemic stroke: a brain proton mag-netic resonance spectroscopic imaging study. Stroke 2003;34:e82– 87
10. Galanaud D, Dormont D, Grabli D, et al. MR spectroscopic pulvinar sign in a
case of variant Creutzfeldt-Jakob disease. J Neuroradiol 2002;29:285– 87
11. Galanaud D, Le Fur Y, Nicoli F, et al. Regional metabolite levels of the normal
posterior fossa studied by proton chemical shift imaging. MAGMA
2001;13:127–33
12. Frahm J, Bruhn H, Gyngell M, et al. Localized proton spectroscopy using
stim-ulated echoes: initial application to human brain in vivo. Magn Reson Med
1989;9:79 –93
13. Michaelis T, Merboldt K, Ha¨nicke W, et al. On the identification of cerebral
metabolites in localized H-1 NMR spectra of the human brain in vivo. NMR
Biomed 1991;4:90 –98
14. Confort-Gouny S, Vion-Dury J, Nicoli F, et al. A multiparametric data analysis
showing the potential of localized proton MR spectroscopy in the brain in the metabolic characterization of neurological diseases. J Neurol Sci 1993;
118:123–33
15. Galanaud D, Nicoli F, Chinot O, et al. Noninvasive diagnostic assessment of
Fig 5. ADC values plotted against the NAA/S (A) and mIns/S (B) ratios measured on the same area of the pulvinar in patients with prion disease. There is an absence of correlation between
brain tumors using combined in vivo MR imaging and spectroscopy. Magn
Reson Med 2006;55:1236 – 45
16. Chang L, Ernst T, Osborn D, et al. Proton spectroscopy in myotonic dystrophy.
Arch Neurol 1998;55:305–11
17. Fernando KT, McLean MA, Chard DT, et al. Elevated white matter
myo-ino-sitol in clinically isolated syndromes suggestive of multiple sclerosis. Brain
2004;127:1361– 69
18. Vrenken H, Barkhof F, Uitdehaag BM, et al. MR spectroscopic evidence for glial
increase but not for neuro-axonal damage in MS normal-appearing white matter. Magn Reson Med 2005;53:256 – 66
19. Matoba M, Tonami H, Miyaji H, et al. Creutzfeldt-Jakob disease: serial
changes on diffusion-weighted MRI. J Comput Assist Tomogr 2001;25:274 –77
20. Krasnianski A, Kallenberg K, Collie DA, et al. MRI in the classical MM1 and the
atypical MV2 subtypes of sporadic CJD: an inter-observer agreement study.
Eur J Neurol 2008;15:762–71
21. Pandya HG, Coley SC, Wilkinson ID, et al. Magnetic resonance spectroscopic
abnormalities in sporadic and variant Creutzfeldt-Jakob disease. Clin Radiol
2003;58:148 –53
22. Graham GD, Petroff OA, Blamire AM, et al. Proton magnetic resonance
spec-troscopy in Creutzfeldt-Jakob disease. Neurology 1993;43:2065– 68
23. Behar KL, Boucher R, Fritch W, et al. Changes in N-acetylaspartate and
myo-inositol detected in the cerebral cortex of hamsters with Creutzfeldt-Jakob disease. Magn Reson Imaging 1998;16:963– 68
24. Konaka K, Kaido M, Okuda Y, et al. Proton magnetic resonance spectroscopy
of a patient with Gerstmann-Straussler-Scheinker disease. Neuroradiology
2000;42:662– 65
25. Lim CC, Tan K, Verma KK, et al. Combined diffusion-weighted and
spectro-scopic MR imaging in Creutzfeldt-Jakob disease. Magn Reson Imaging
2004;22:625–29
26. Cordery RJ, Macmanus D, Godbolt A, et al. Short TE quantitative proton
mag-netic resonance spectroscopy in variant Creutzfeldt-Jakob disease. Eur Radiol
2006;16:1–7. Epub 2006 Jan 12
27. Broom KA, Anthony DC, Lowe JP, et al. MRI and MRS alterations in the
pre-clinical phase of murine prion disease: association with neuropathological and behavioural changes. Neurobiol Dis 2007;26:707–17. Epub 2007 Apr 5
28. Mittal S, Farmer P, Kalina P, et al. Correlation of diffusion-weighted magnetic
resonance imaging with neuropathology in Creutzfeldt-Jakob disease. Arch
Neurol 2002;59:128 –34
29. Parchi P, Giese A, Capellari S, et al. Classification of sporadic
Creutzfeldt-Jakob disease based on molecular and phenotypic analysis of 300 subjects.
Ann Neurol 1999;46:224 –33
30. Brandel JP, Heath CA, Head MW, et al. Variant Creutzfeldt-Jakob disease in
France and the United Kingdom: evidence for the same agent strain. Ann
Neu-rol 2009;65:249 –56
31. Billette de Villemeur T, Gelot A, Deslys JP, et al. Iatrogenic Creutzfeldt-Jakob
disease in three growth hormone recipients: a neuropathological study.
Neu-ropathol Appl Neurobiol 1994;20:111–17
32. Tschampa HJ, Kallenberg K, Urbach H, et al. MRI in the diagnosis of sporadic
Creutzfeldt-Jakob disease: a study on inter-observer agreement. Brain 2005;
128(pt 9):2026 –33. Epub 2005 Jun 15
33. Young GS, Geschwind MD, Fischbein NJ, et al. Diffusion-weighted and
fluid-attenuated inversion recovery imaging in Creutzfeldt-Jakob disease: high sensitivity and specificity for diagnosis. AJNR Am J Neuroradiol 2005;
26:1551– 62
34. Shiga Y, Miyazawa K, Sato S, et al. Diffusion-weighted MRI abnormalities as an
early diagnostic marker for Creutzfeldt-Jakob disease. Neurology 2004;
63:443– 49
35. Meissner B, Kallenberg K, Sanchez-Juan P, et al. Isolated cortical signal
in-crease on MR imaging as a frequent lesion pattern in sporadic Creutzfeldt-Jakob disease. AJNR Am J Neuroradiol 2008;29:1519 –24
36. Fulbright RK, Hoffmann C, Lee H, et al. MR imaging of familial
Creutzfeldt-Jakob disease: a blinded and controlled study. AJNR Am J Neuroradiol 2008;