DEPLOYING DRONES FOR AUTONOMOUS DETECTION
OF PAVEMENT DISTRESS
Mia Petkova
B.A., McGill University (2008)
Submitted to the Program in Media Arts and Sciences, School of Architecture and Planning, in partial fulfillment of the requirements for the degree of
Master of Science at the
MASSACHUSETTS INSTITUTE OF TECHNOLOGY June 2016
Massachusetts Institute of Technology 2016. All rights reserved.
Signature redacted
I Mia Petkova
Program in Media ts and Sciences
____Signature redacted
C6sar A. Hidalgo' Associate Professor of Media Arts and Sciences hesis Advisor
Signature redacted
Patricia Maes Academic Head Program in Media Arts and Sciences MASSACHSET ILNSTITUTE OF TECHNOLOGY
JUL 14 2016
LIBRARIES
Author Certified by Accepted byDEPLOYING DRONES FOR AUTONOMOUS DETECTION
OF PAVEMENT DISTRESS
Mia Petkova
Submitted to the Program in Media Arts and Sciences, School of Architecture and Planning, on May 6, 2016, in partial fulfillment of the requirements for the degree of Master of Science.
ABSTRACT
Road repair expenditure comprises a significant portion of US federal and municipal budgets. Inspection and timely maintenance are crucial preventative measures against pavement distress formation that can lower the monetary burden of repairs. Yet state of the art road inspection techniques still employ technicians to perform distress measurements manually. These methods are often too costly, time-consuming, labor-intensive and require technical expertise. Meanwhile, autonomous systems are increasingly deployed in place of human operators where tasks are monotonous and where risk of exposure to hostile conditions is great. As a time-consuming but highly repetitive task, road inspection presents a promising candidate for task automation. Automating road inspection can present significant efficiency gains that can aid agencies in responding to early signs of erosion in a timely manner.
In this work, I explore the capacity of drones to perform autonomous pavement inspections. I develop a system that dispatches drones to survey an area, diagnose the presence of pavement distress in real time, and record imagery and coordinates of locations requiring repair. This system presents an alternative to on-ground inspections and tools that draw on crowd-sourced mechanisms to identify potholes. It builds on other recent technological solutions that employ remote sensing to collect and interpret data on pavement health. The results from this mission will be visualized through a web platform that can not only aid cities in consolidating a fragmented and costly data collection process, but also in minimize human error in the identification and prioritization of problem areas.
Thesis Advisor: C6sar A. Hidalgo
DEPLOYING DRONES FOR AUTONOMOUS DETECTION
OF PAVEMENT DISTRESS
Mia Petkova
Submitted to the Program in Media Arts and Sciences, School of Architecture and Planning, in partial fulfillment of the requirements for the degree of
Master of Science at the
MASSACHUSETTS INSTITUTE OF TECHNOLOGY
Reader_-Signature
redacted
Brian Williams Professor of Aeronautics and Astronautics
S ig
nature
redacted
Massachusetts Institute of Technology
Reader
Sarah Williams Assistant Professor of Urban Planning Massachusetts Institute of Technology
ACKNOWLEDGEMENTS
First and foremost, I would like to thank my advisor C6sar A. Hidalgo for his support of this project and the brainstorming session from which this idea was born, and more importantly, for my experiences at Macro Connections and the Media Lab, which have ultimately built up to this thesis.
I would also like to thank my readers Sarah Williams, whose work played a large part in pushing me to explore new interests when I first came to MIT, and Brian Williams, whose courses were an immense inspiration for this work.
I am grateful to Tiago Vaquero and Eric Timmons for their technical insights and for pointing me in the direction of Solo, and Manuel Aristaran for his help in debugging and preparing Solo for its first flight.
I am also grateful for the friends I have made at MIT who have been supportive throughout this journey. Particularly, Luisina Pozzo Ardizzi and Maggie Church, not only for their moral support,
but also for being dependable co-pilots during my early flight attempts.
Finally, I would like to thank Linda Peterson and Keira Horowitz, the glue that holds everything together, for their commitment to supporting the students at the Media Lab.
CONTENTS
1 INTRODUCTION
1.1 Motivation ...
1.1.1 Traditional pavement evaluation ... 1.1.2 Transition to new evaluation methods ... 1.2 Purpose . . . .. . . . . 2 RELATED WORK
2.1 Volunteered geographic information (VGI) platforms 2.1.1 Active crowdsourcing ...
2.1.2 Passive vibration-based crowdsourcing... 2.1.3 Performance ...
2.2 Rem ote sensing ...
2.2.1 Remote Sensing Methods ...
2.2.1.1 3D Reconstruction-based Approaches 2.2.1.2 Vision-based Approaches ... 2.2.2 Remote Sensing Platforms ... 2.2.3 Performance ... 3 REQUIREMENTS 4 CONTRIBUTION 5 METHODOLOGY 5.1 Hardware ... 5.2 Software. ... 5.2.1 Path Parser ... 5.2.2 Mission Generator ... 5.2.3 Pothole Detection Algorithm ...
5.2.3.1 Conversion to grayscale . . . 5.2.3.2 Image smoothing ... 5.2.3.3 Image segmentation ... 5.2.3.4 Noise removal ... 5.2.3.5 Shape fitting ...
5.2.3.6 Decision function thresholds 6 EVALUATION 6.1 Procedure. 6.2 Location . 6.3 Results . . 7 LIMITATIONS 7.1 Hardware ... 7.2 Software ... 7.3 G PS.. . . . .. . 7.4 Failsafe systems ... 7.5 Environmental constraints. 7 7 7 10 10 13 13 13 13 14 15 16 16 18 21 27 28 29 31 31 32 33 34 34 35 36 36 38 41 42 46 46 46 48 52 52 52 53 54 54 ... .... .... .... . . . . .... ....
7.6 Network for centralized data control and retrieval . . . . 54 7.7 Licensing/legislation . . . . 54 8 CONCLUSION 55 8.1 Future Work ... ... 55 REFERENCES 57 APPENDIX 61
1
INTRODUCTION
1.1 Motivation
1.1.1 Traditional pavement evaluation
Infrastructure problems, such as potholes, are prevalent in urbanized areas around the world. At over 6 million kilometers (4 million miles) in length, the United States has the most expansive road network of any country in the world, making the maintenance and timely repair of such problems crucial (ASCE, 2013). Consequently, a great monetary burden falls on agencies responsible for repairing pavement defects. In 2008, an estimated $182 billion were spent in the US on capital improvements and maintenance of federal highways (Schnebele et al, 2015 from fhwa.dot.gov). Yet the American Society of Civil Engineers (ASCE) gives the nation's road infrastructure a grade of D (poor), and estimates that 32% of America's major roads are in poor or mediocre condition (ASCE, 2013). To maintain the current pavement condition of US highways, $101 billion in annual capital investment is needed between 2008 and 2028. To improve pavement conditions, investment would need to be as high as $170 billion per year. However, due to budgetary limitations, federal, state, and local governments are spending only $91 billion per year in capital investments, which results in further deterioration of road conditions (ASCE, 2013; Wu, 2016).
Road conditions are generally considered poor when issues related to their structural adequacy, skid resistance, or surface defects manifest themselves (Schnebele et al, 2015). These include cracking, surface deformation and defects, patching, and potholes. Potholes are bowl-shaped, almost elliptical depressions, at least 25mm (lin) in depth and 150mm (6in) in diameter, with granular and coarse textural appearance due to fragmentation (Kim&Ryu, 2014b; Koch&Brilakis, 2011). They generally form as a result of 1) internal factors (pavement erosion caused by water damage), 2) changes in climate (heavy rainfall, extremely cold conditions), and 3) external factors (poor construction management and materials, and heavy traffic) (Mandal, 2015; Bianchini, 2010; Schnebele et al, 2015; Kim&Ryu, 2015). Typically, the formation process would go as follows: axle load of heavy vehicles leads to fatiguing of the road surface, resulting in the formation of cracks; these cracks allow water to seep through and mix with the asphalt; when vehicles continuously drive over already damaged areas, water will be expelled through the cracks together with some
of the asphalt, slowly creating a cavity; eventually, the road surface will collapse into the cavity, resulting in a visible pothole (Nienaber et al, 2015). As these defects expand, they in turn cause damage to the vehicles travelling over them, incurring costs both for municipalities and drivers. In the United States alone, the American Automobile Association (AAA) estimates that potholes set back motorists approximately $6.4 billion a year in damage to numerous vehicle components, from tires and wheels, to suspension, steering, exhaust systems, and engines (Xie, 2015; Cronin et al, 2014).
In most US states, roads are typically designed to last 15 to 20 years and pavement defects are bound to develop over such a timeframe (Schnebele et al, 2015). However, the cost per mile of reconstructing a deteriorated road may be more than three times the cost of preserving it through frequent maintenance (ASCE, 2013). The vast majority of pavement costs in the United States are indeed maintenance-related, indicating that rapid, cost-effective, and accurate condition assessment are of utmost importance for appropriate prevention measures that limit pothole formation and growth (Koch et al, 2013; Wu, 2016; Joubert et al, 2011).
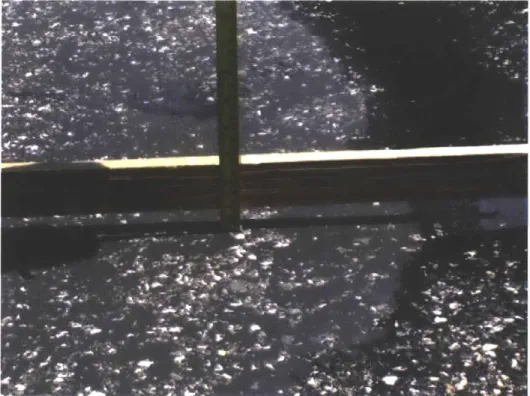
Yet the identification of infrastructure problems of this kind is not always a straight-forward task. In a recent review of pavement management methods, Schnebele et al et al. (2015) concluded that many road authorities utilize traditional methods of evaluating damage and deterioration requiring in situ 'walk and look' measurements along with visual examinations, while others use mechanical devices to measure surface defects. Manual walking surveys may include 100% of the area to be surveyed, measured, recorded, and sometimes mapped. The mechanical distress measurements they comprise normally require equipment consisting of a hand odometer to measure distress length and area, a straight edge, and a ruler to measure distress depth (Zhang, 2009) (Figure 1). At a single spot, this process can take between 20 and 40 minutes for a team of two (Zhang, 2009). Because of the extent of the US road network, a comprehensive evaluation of road rideability and structural integrity using these approaches is not feasible. The state of Georgia alone requires 60 full-time engineers to survey the 18,000 mile centerline highway annually (New
Georgia Encyclopedia, 2016). On a countrywide scale, this type of inspection presents a significant burden in terms of physical and monetary capital. When such surveys are not affordable to local road management authorities, many regions are subject only to occasional inspections, and others to no inspection at all (Zhang, 2009).
Figure 1: Traditional pothole measurement
In essence, the shortcomings of traditional geotechnical engineering methods present several factors that restrict frequent, cost effective, and comprehensive road evaluations. Obtaining these data 1) is costly, 2) requires the expertise of trained and experienced inspectors, 3) can be time consuming, laborious, and unsafe for inspectors, 4) can be disruptive of traffic and destructive of roads, and 5) provides largely descriptive information for only limited areas (Zhang, 2009). Of particular relevance to this project is the latter point; the data collected are limited to point observations and, despite well-established rating criteria, their interpretation is based on rater judgment and experience. The reliance on human evaluations is not only prone to error, but also makes comparative measurements is difficult (Schnebele et al, 2015; Bianchini, 2010; Mandal et al, 2015). This presents scalability and data reliability issues that are increasingly being addressed through automated and semi-automated means of evaluating pavement conditions.
1.1.2 Transition to new evaluation methods
The transition from manual to automated data collection has increased over the past 20 years. According to the US National Cooperative Highway Research Program (NCHRP), in 1994, 40 US
states were predominantly using manual methods to survey surface defects (Schnebele et al, 2015). In 2004, of the 45 state agencies surveyed, only 17 were still utilizing manual survey methods (Schnebele et al, 2015 plus other sources). The integration of more automated and semi-automated remote sensing methods is inevitable and may provide valuable results when generated and interpreted in a systematic manner. The application of these methods is likely to be less expensive, more consistent, and conducive to faster inspections that cover wider areas (Schnebele et al, 2015).
1.2 Purpose
To address the shortcomings of manual pavement inspection and distress identification methods, I have developed a system that performs autonomous pothole detection in real-time using an unmanned aerial vehicle (UAV). The tool relies on video-based remote sensing and automated data processing, whereby an aerial vehicle is dispatched to record video footage of paved roads and an image processing algorithm is concurrently applied to that footage to extract the exact coordinates of pothole formations.
An autonomous system can be described as a two-module system. The first module is a high-level planner that generates a sequence of configuration goal states, representing the desired physical state of the autonomous system at a single point in time. If the configuration goal state at the completion of the mission is one where the drone has landed on the ground, this state can be directly achieved by issuing a command such as 'drone-land' At a low-level, the reactive control system, the second module, achieves these states (Williams&Nayak, 1997). A reactive system is one that adapts its actions in response to external events. For a landing operation for instance, the system must take velocity and altitude readings in order to adjust its approach to the ground.
For an inspection mission such as the one developed here, a plan must be generated to dispatch a drone to examine a pre-defined area and safely return it to its starting position (configuration goal
state), while respecting both external environment constraints (obstacles) and internal system constraints (battery capacity). This effectively limits the state space of the program at any given point in time. In other words, while a configuration state necessitates that the drone fly over a given waypoint during the execution of the mission, obstacle constraints imposed by buildings, trees, or power lines may limit the altitude at which this state can be achieved.
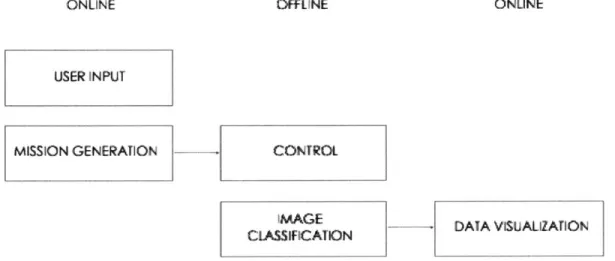
The inspection software is comprised of the following components (Figure 2).
ONLINE
USER INPUT
OFf L NE ONLINE
MISSION GENERATION
1
CONTROLMAG
CLASS IfCAI1ION DAIA VIS'ALi2ATION
Figure 2: Software stack
I
OFFLINE
Based on user input delineating the target area for the mission, the platform will formulate an activity plan by transforming an input path into waypoints. These waypoints will define the trajectory of an autonomous mission for the vehicle. While obstacle avoidance is not taken into account in this project, the mission will be modelled around temporal constraints imposed by the drone's battery capacity, as it is crucial to ensure the drone has reached its end destination before its charge is depleted.
ONLINE
On-board, mission control software in will communicate the course of action to the drone's computer. Specifically, Python executables will take vehicle state readings, such as altitude and velocity, and issue navigation commands in accordance with the plan. Control commands will be sent over the Micro Air Vehicle Link (MAVLink) protocol, which can be used to transmit the orientation of the vehicle, its GPS location, and its velocity. In accordance with control commands, the vehicle will survey the area of interest, and based on a predefined classifier, detect potholes in real time. The classifier used at a run-time can be attuned to different degrees, depending on whether the user is interested in finding critical pavement distress (potholes) or performing a more comprehensive inspection (e.g. detecting cracks in the road in addition to potholes). When a positive classification is made, the image of the problem area will be stored on the on-board computer, together with its GPS coordinates and a timestamp of the sample acquisition.
OFFLINE
After the completion of the mission, the data collected will be visualized through a web platform. Associated with each pothole depicted on a map will be its time-stamped image.
2
RELATED WORK
The most prominent current research efforts in automating the detection of potholes can be cate-gorized as vibration-based, 3D reconstruction-based, and vision-based methods (Koch&Brilakis, 2011; Mandal et al, 2015). These methods incorporate technologies that use vibration, laser, and camera sensors, each of which identifies at least one aspect of encountering a pothole (Nienaber et al, 2015). Projects involving these sensing methodologies are described here in further detail, with particular emphasis on those employing image processing techniques and UAV platforms.
2.1 Volunteered geographic information (VGI) platforms
2.1.1 Active crowdsourcing
A number of cities have begun to draw on voluntary crowd-sourced reporting by city inhabitants to more efficiently identify infrastructure problems. This new and rapidly growing data collection approach harnesses the power of 'humans as sensors' to collect spatial and temporal information on pavement conditions, often coupled with image recordings of problem areas (Goodchild, 2007 as cited in Schnebele et al, 2015). Specifically, agencies may give residents any of a number of options to manually report potholes they encounter, including via phone, web form or mobile app.
2.1.2 Passive vibration-based crowdsourcing
Several semi-automated platforms that use smartphones as sensors for road roughness have been developed. These are vibration-based systems that rely on the fact that pavement distress imposes impacting forces on a moving vehicle (Kim&Ryu, 2014b). The city of Boston, MA for instance uses Street Bump (http://www.streetbump.org), a mobile phone app that utilizes wavelets (wave-like oscillations) and Kruskal's algorithm to detect potholes (Schnebele et al, 2015). StreetBump works by taking advantage of a smartphone's accelerometer and GPS measurements while a vehicle is in motion -when a bump in the road is encountered, the app records the location and eventually sends the relevant data to a centralized database (New Urban Mechanics, 2015).
2.1.3 Performance
VGI approaches yield varying results. On one hand, the appeal of vibration-based systems lies in the fact that they are cost-effective, amenable for real-time processing, and require only limited storage. (Yu&Yu, 2006). Crowdsourced data collection methods as a whole provide an inexpensive (sometimes free) source of data pertaining to infrastructure decline.
However, the success of crowd-sourced data collection is highly dependent on user motivation. The city of Boston filled over 19,000 potholes in 2014, yet only about 16% (3,000) of the submitted
pothole reports came from the Citizens Connect app (http://newurbanmechanics.org/project/ citizens-connect/), website reports, or calls from drivers (Xie, 2015). The remaining 84% (16,000) came from city employees and the City Worker app (the city employee counterpart to the Citizens Connect app) (Xie, 2015). These figures are perhaps unsurprising, given that the reporting process can be tedious. StreetBump, although automated in its data collection, places a number of demands on its user in order to operate successfully. The driver is required to open the app before getting on the road and ensure it is running in the foreground of their smartphone during the entirety of the trip, all the while keeping the phone in a stable position. Upon reaching her destination, the driver must also remember to submit the data collected during the trip through the app.
For pothole reports to be of value, the data collected must also be accurate, yet quality control may be difficult to enforce in crowd-sourced systems. And while humans may not be meticulous in providing the accurate pothole reports required for a proper response, semi-automated vibration-based apps like StreetBump are often prone to measurement error, and suffer from issues related to data reliability and data deficiency. Specifically, they have a tendency to diagnose any high energy event or surface anomaly that may cause vibrations, such as braking, road joints and manholes, as a false positive (Eriksson et al, 2008). Furthermore, unless vehicle conditions that may have an effect on the data (such as tire pressure) are calibrated, the readings may not be comparable (Yu&Yu, 2006). Finally, road or lane centers are generally no-hit zones for a vehicle's wheels and pavement distress in these zones is likely to remain undetected (Kim&Ryu, 2014b; Koch&Brilakis, 2011). These shortcomings demonstrate that sensor-based methods that rely on accelerometer vibration readings lack accuracy and reliability and as such are best suited for preliminary and rough condition surveys (Yu&Yu, 2006; Koch&Brilakis, 2011 check Xu et al., 2006;
Koch, Jog, Brilakis, 2013).
In addition to issues related to user motivation and quality control, VGI approaches are also deficient in that they are generally jurisdiction-specific. While potholes in Boston can be reported through the Citizens Connect app, potholes in Cambridge must be identified through the iReport app, and those in Newton - through the city's 311 app (Xie, 2015). For users crossing administrative boundaries, the process can be too cumbersome to get involved in. This poses a major limitation common to all VGI approaches, namely that of data stitching and aggregation. Collecting data from miscellaneous sources may negatively impact data processing, and as a result, response time. Lacking a centralized reporting system can make the prioritization of more urgent cases, such as larger potholes, or those located on major thoroughfares, a complex process.
2.2 Remote sensing
Automated pavement surveys have been found to be safer and less labor intensive than manual collection methods, while still providing results consistent with standard techniques (Schnebele et al, 2015 via secondary source?). The use of remote sensing techniques for automated evalua-tion of pavement condievalua-tions is becoming an important and economically advantageous area of
exploration in transportation research (Schnebele et al, 2015).
Remote sensing can be defined as any surveying method which does not require physical contact with the road surface or subsurface and can be broadly categorized as passive or active (Schnebele et al, 2015). Passive sensing detects an object's characteristics based on the radiation that is naturally emitted or reflected by that object. Photography, thermal imaging, and infrared are common passive remote sensing techniques. Active sensing requires an energy source directed at the observed object, such as radio waves (Radar), light pulses (LiDAR), or synthetic aperture radar (SAR) (Cronin et al, 2014; 'Remote Sensing, 2016). The sensing instrument then measures the radiation that is reflected or backscattered from the target object. Data collection using these sensors can be conducted on various platforms of operation, including moving vehicles, and airborne platforms at various scales, such as satellites, airplanes, and UAVs.
techniques offer non-destructive methods for road condition assessment (Schnebele et al, 2015). They also provide an opportunity for frequent, comprehensive, and standardized surveys of transportation infrastructure with both high spatial and temporal resolutions (Schnebele et al, 2015). Because of the potential for high flexibility and efficiency of remote sensing data collection platforms, pavement managers can assess large, often inaccessible areas, in little time, providing valuable up-to-date information on road network deterioration.
Although these techniques may not entirely replace traditional geotechnical methods, they do provide an opportunity to reduce the number or size of areas requiring site visits (Schnebele et al, 2015). Once problem areas are identified, specific conditions may then require the use of traditional road assessment methods (Schnebele et al, 2015).
2.2.1 Remote Sensing Methods
Ground Penetrating Radar (GPR)
Ground penetrating radar (GPR) can be an effective tool for rapid assessment of road conditions because it can be operated onboard a moving vehicle travelling at highway speeds. GPR uses radar pulses to image subsurface layers. The most popular applications of GPR in pavement management include the measurement of pavement layer thickness and void discovery (Schnebele et al, 2015). GPR is capable of portraying the depth and thickness of subsurface irregularities, but it does not provide accurate horizontal dimensions. In contrast, it is possible to obtain such measurements of voids using infrared thermography, but the technique does not provide depth or thickness measurements (Schnebele et al, 2015). Signal noise scattering, high energy consumption associated with GPR equipment, and the technical expertise required to operate it are factors limiting the
extensive usage of GPR.
2.2.1.1 3D Reconstruction-based Approaches
Stereo Vision
Stereo vision approaches require a pairing of video cameras and comprise a complete 3D recon-struction of the pavement surface. For a 3D model, a matching of points between the two camera views is performed. This procedure proves quite challenging due to irregularities in the texture
and color of the pavement surface, and the resulting computational effort precludes it from being used in real-time (Koch&Brilakis, 2011). In addition, the cost of laser scanning equipment is still significant, and current research on using this methodology is focused on the accuracy of 3D measurements (Ryu et al, 2015).
Microsoft Kinect
Cameras provide a relatively inexpensive way in which to do pavement inspection, but require the use of complicated algorithms to produce 3D data. The prohibitive costs of sensors capable of producing 3D data have been lowered with the widespread availability of inexpensive 3D sensing devices, such as the Microsoft Kinect gesture based interface. A Kinect consists of a normal colour camera, an IR projector, and an IR receiver. The latter two are used to produce depth information using a structured light method (Joubert, 2011). The Kinect provides more detailed data of pavement distress compared to simple vision techniques, and requires less computation than stereo vision methods because depth measurements are readily available from IR camera imagery (Moazzam et al, 2013). Although a more cost-effective approach than industrial cameras and lasers, the use of infrared technology based on a Kinect sensor for measurement is still a novel idea, and further research is necessary for improvements in accuracy (Ryu et al, 2015).
Light Detection and Ranging (LiDAR)
When mounted on a moving platform, road surfaces can be mapped through LiDAR. A LiDAR instrument employs laser rangefinding methods: it transmits a pulse of light and records the time it takes for the signal to return to the source in order to measure distance, ultimately creating a 3D point cloud of the imaged surface. Unlike other techniques, such as video-based photogrammetry, LiDAR is insensitive to lighting or contrast conditions, and as such can be implemented during the day or night.
In the context of pavement evaluation, the terms terrestrial laser scanning (TLS) and pavement pro-file scanner (PPS) are commonly used to describe systems that use LiDAR techniques (Schnebele et al, 2015; Wired, 2013). Specifically, they refer to vehicle-mounted systems that rely on laser scanners to construct high resolution, continuous transverse pavement profiles. LiDAR scanners have been shown to successfully detect damage, such as distortions, rutting, shoving, and potholes,
in real-time, at highway speeds of up to 100kmh (63mph) (Schnebele et al, 2015; Wired, 2013). A grid-based processing approach of LiDAR data can also be applied to identify and estimate the volume of potholes. (Schnebele et al, 2015).
Although LiDAR-based TLS/PPS systems can record measurements with very high accuracy of up to 0.30mm (0.01in), their measurement range limits their utility to roads up to 4m wide (12ft) (Fraunhofer, 2013), a range that is insufficient to be of use to most large cities. Furthermore, the high equipment and maintenance costs, as well as the need for trained technicians, may make its implementation cost prohibitive and difficult to integrate into current management programs (Schnebele et al, 2015; Xu et al., 2006; Koch et al, 2013).
2.2.1.2 Vision-based Approaches
Image processing
Image-processing techniques to assess road conditions are considered as a promising non-destructive method to quantify pavement distress (Wu, 2016). Vision-based methods are currently the focus of a lot of research as they are familiar and generally less expensive than other methods such as those relying on 3D laser scanning (Mandal et al, 2015). Although 2D image measurements only provide planimetric data, making them inadequate for assessments of distress severity that may require depth information (Zhang, 2009), they are effective in the identification and localization of distress.
Several metrics are commonly used to evaluate the performance of image processing methods. (Hudrom et al, 2013).
Accuracy: ratio of correct identifications (true positives + true negatives) to the total number of observations [(TP +TN) / (TP + TN +FP +FN)]
Precision: ratio of correctly detected potholes (true positives) to the total number of detected potholes [TP/(TP+FP)]
Recall: ratio of correctly detected potholes (true positives) to the total number of potholes in actuality [TP/(TP+FN)
Error: ratio of incorrectly identifications (false positives + false negatives) to the total number of observations [(FN + FP) / (TP + TN + FP + FN)
a) Huidrom et al. (2013) developed a method for automatically detecting potholes, cracks and patches using heuristically derived decision logic based on three main distinctive visual properties of distress. These include 1) visual texture as given by the standard deviation of the pixel intensities in the distress region; 2) shape of the distress region derived from the distress circularity; and 3) the dimension of the distress region as given by its average width. These properties can be used to both identify distress, as well as differentiate between different distress types. The texture inside a pothole, crack or patch is characterized by more contrast and variation than the surrounding area. However, the magnitude of this depends on the type of distress, with potholes having more variation than patches. On the other hand, potholes and patches are more circular in shape, while a crack is elongated. Finally, the dimension of a pothole or patch is larger than that of a crack.
The authors' method, the Critical Distress Detection, Measurement and Classification (CDDMC) algorithm, consists of five steps: 1) image enhancement, 2) image segmentation, 3) visual properties extraction, 4) detection and classification by decision logic, and 5) quantification. For potholes in particular, this method was shown to achieve an overall accuracy of 97% with 95% precision and 81% recall. The algorithm performs well even in cases where shadows obstruct the frame; although a shadow may satisfy one property characterizing distress, fulfilling the conditions for the collective set of visual properties for the three distress types is unlikely (Huidrom et al., 2013).
b) Koch&Brilakis (2011) have developed a similar vision-based method for pothole identification The motivation for this research is to ultimately convert passenger vehicles into ubiquitous sensors and reporters of road conditions through a comprehensive framework that can detect, recognize, locate, and evaluate the magnitude of pavement defects. This is based on the notion that a rear-view (parking) camera on a vehicle can be replaced with a high-speed fish-eye camera that can tilt downwards to record pavement observations. The video feed can be processed by an on-board computer in two stages; first, real-time algorithms detect frames that might contain evidence of
defects; then, defect recognition algorithms are applied only to those frames selected in the first stage.
Following similar techniques to those used in Huidrom et al (2013), Koch&Brilakis (2011) perform 1) image segmentation, 2) shape approximation, and 3) texture comparison on the input image frames. After defect and non-defect areas are segregated in the initial step of the algorithm, morphological thinning is used to shrink the defect region to its minimally connected stroke or skeleton. Based on this skeleton, which may depict only partial distress contours after image segmentation has been performed, the shape of each candidate region is approximated using elliptic regression. Finally, the texture of the proposed defect regions is juxtaposed against that of the surrounding healthy pavement. This is essential in order to distinguish between false candidates (small repair patches, spot shadows, and discoloration) and true potholes. Coarser, grainier texture inside a defect region, as defined by standard deviation of gray-level intensity values, indicates a high likelihood of a correctly identified pothole, while smoother texture indicates healthy pavement.
The algorithm was implemented in a MATLAB prototype with a database of 120 pavement images, which depict a high variety of potholes (shape and size), other defects (cracking, patching, discol-oration), and non-defect pavements, as well as diverse lighting conditions (shadows). Of these, 50 were used as a training set to determine appropriate threshold values and filters, and the remaining 70, for testing. Most images were found on Google, while the remainder were captured with a remote-controlled robot vehicle at an altitude of 2ft and view directed at 45 degrees, intended to simulate a passenger vehicle that collects pavement footage. The approach was evaluated against a manual search for potholes in a collection of pavement images. It demonstrated 86% accuracy, 82% precision, and 86% recall, and a low sensitivity to varying lighting conditions and viewing directions that may cause strong shadows.
c) To address the drawbacks associated with the existing survey-oriented system in Mumbai, India, Mandal et al (2015) employed geotagging and image processing techniques to pothole identification. These techniques are intended to accurately estimate the dimensions of the potholes from 2D images, analyze their area and depth, and estimate the quantity of filling material required, thus enabling priority based pothole attendance.
The proposed system acquires pothole images through a camera. Using latitude and longitude information from image metadata, potholes are geotagged on the selected ward map. Various noise filtering techniques are then employed to correct for different environmental conditions at the time of imaging. The input image is 1) converted to binary, followed by 2) an edge detection algorithm (Canny and Zerocross) to identify pothole boundaries, 3) inversion and morphological closing, to specify the main target area in white and fill any holes within it, and finally 4) RGB conversion, where a final image is generated highlighting the pothole (Image). The final images are stored in a kmz or kml file and can be visualized in Google Earth on any machine. Further work to obtain dimensions from images and verify the data against data from a municipal corporation in Mumbai is still to be implemented, so no measures pertaining to the performance of the algorithm have been presented in the research.
Although the above projects fit into the larger vision of creating network-based data collection and alert systems, whereby vehicles on the road take on the role of moving sensors, none of them have been concerned with integrating data collection and data analysis. Despite promising results, the methods described here were not applied in real-time, but rather as a post-processing step to already available footage of pavement conditions. Furthermore, the analysis steps were largely applied using proprietary software such as MATLAB, limiting their applicability to desktop applications.
2.2.2 Remote Sensing Platforms
Digital photos taken from low altitude manned aerial, UAV, or vehicular platforms provide data with appropriate resolution for identifying distress such as potholes (Schnebele et al, 2015). This section describes both positive and negative aspects of these data collection platforms and provides an overview of their usage in vision-based projects.
Vehicle
Vehicular platforms have potential for remote sensing applications because they can gather continuous, high-resolution data at highway speeds (contingent on no traffic disruptions). They are also capable of collecting data under trees, bridges and other obstructions, which would otherwise be obscured from aerial or satellite views (Schnebele et al, 2015).
a) Joubert et al (2011) developed a 'vehicle mounted sensor system to automatically detect and analyse potholes' for the purpose of improving the efficiency and reducing the costs associated with typical road maintenance programs. The system utilizes a Microsoft Kinect and a high-speed USB camera as sensing devices, and records photographs, 3D point cloud data, and the GPS coordinates of detected potholes. The sensing devices are housed within a custom-designed rack mounted onto the exterior of the vehicle, which is connected to a computer within the interior. The design assumes that the motor vehicle will travel at a max speed of 60km/h (17m/s).
The camera footage is examined using open-source software, including the Robot Operating System (ROS), OpenCV and Point Cloud Library (PCL). The data management routines permanently save all of the GPS locations, 3D point clouds, and camera images recorded within a certain time interval around the time of pothole detection. The point cloud is investigated to confirm whether a pothole has truly been found and to determine the dimensions of distress regions. The pothole locations are then mapped out.
The width and depth measurements computed by the algorithm were validated manually, and were found to be accurate to within 0.5cm. Nonetheless, the system has not been extensively tested to see whether it can accurately function at required vehicle speeds. According to the authors, a high performance computer is needed due to the steep processing and memory requirements imposed by the high rate of data generation (Joubert et al, 2011). Computationally intensive point cloud operations required for 3D reconstruction may not be possible in real-time. Furthermore, the body structure that is created to house the sensors required in this system is made out of 304 metal plates, indicating that such an elaborate apparatus may involve manufacturing and installation that are not entirely straightforward.
b) Nienaber et al (2015) have also proposed a vehicle-based computer vision approach to identify potholes using a windscreen-mounted device that will continually scan the road surface. This algorithm is intended to be part of a larger design, whereby a software system would alert the driver of impending potholes, enabling her to avoid them.
For evaluation purposes, a GoPro was mounted on the inside of a vehicle's windscreen to accurately reflect a device that can be fitted to a vehicle for commercial use. An image library consisting of
48,913 images of potholes under different conditions was recorded while driving at a speed of 40km/h (11m/s). Because foliage was found to interfere with the classification and generate false positives, the road surface was first extracted automatically as the sole region of interest (ROI). A selection of images was withheld to tune the various constants necessary for the different types of processing functions used.
The collected footage was processed offline in C++ and OpenCV. Enhancement and segmentation techniques were applied to the images, including dilation operations to remove unwanted edges or other vehicles in the frame, situated close to image boundaries. Contours are thus filtered and those that do not meet the size constraints of the model are discarded.
The total runtime of the algorithm is 0.2s, indicating that it can be deployed on a vehicle driving at a normal speed (less than 60km/h or 11m/s) and warn the driver of imminent potholes. It performs at a precision rate of 82% and recall rate of 74%. Only in one out of the five frames containing a vehicle there was a false positive classification, reflecting an 80% success rate.
This approach has several limitations. Because of the dilation procedures used, potholes on the outer edges of an image frame may be absorbed into the segmented road boundary. On the other hand, if dilation is reduced, sharp and unconnected edges representing grass or dirt alongside a road may lead to false positives. Additionally, if two potholes are closely spaced together, they may be merged into a single contour by the algorithm.
The range in which the algorithm will detect a pothole in front of the vehicle is also quite restricted. Accurate detections will be yielded for potholes between 2m (due to dilation as potholes merge with edges) and 20m (due to visibility of the pothole) ahead of the vehicle. The maximum distance at which the pothole can be detected needs to be improved to account for the driver's reaction time.
Moreover, an inherent assumption is made when extracting the region of interest in the first stage of the algorithm. The region is defined as a rectangular area just above the hood of the vehicle, however if a driver does not maintain a safe following distance from the vehicle in front, this area
c) Kim&Ryu (2014) developed a system that collects video data of road surfaces through a vehicle-mounted optical device. The device, designed to be easily vehicle-mounted on a vehicle, consists of a light/optical component, video component, and GPS control/total control component. It collects and stores video data of potholes while gathering location information. It is powered through the vehicle and is 1.1m x 0.4m x 1.1m (3.6ft x 1.3ft x 3.6ft) in dimension. The device can collect video data of the inside lane, as well as the left and right lanes.
The analysis step of the project involves similar image processing techniques as those described previously, ultimately resulting in a selection and square zoning of an ROI in the original video that serve to warn a driver of the presence of potholes. This method has relatively good performance, with a precision rate of 80%, accuracy of 74%, and recall of 73%. Similarly to the system proposed by Joubert et al (2011) however, the data collection device used is relatively large and would require custom fitting to a vehicle.
Due to the visual nature of the detection methods described in this section, it is self-evident that their performance is dependent on lighting conditions, the lack of obstructions in the line of view of the sensing devices, absence of rain, and any other factors that visually impair the ability to see potholes (Nienaber et al, 2015).
Satellite/ Airplane
Although aerial imagery provides a valuable data source for performing pavement inspections, the limited maneuverability of airplane and satellite platforms to acquire the image data, particularly in urban settings, and the associated high costs that come with operating such platforms, present significant challenges to widespread usage of such platforms (Zhang, 2009).
In recent years, imaging satellites with sub-meter resolution, including GeoEye-1 and several WorldView modules, have been launched into orbit. While it is possible to assess pavement through satellite imagery, this can only be done at a limited spatial resolution, meaning that some distress types such as rutting and cracking remain undetectable (NCRST, 2001). At 0.41m and 0.31m respectively, neither GeoEye-1 or WorldView provide resolution sufficiently high enough for distress detection on smaller scales, and even smaller potholes may remain undetected.
Unmanned Aerial Vehicle (UAV)
Although UAV applications have been gaining popularity in a number of commercial spheres, their diffusion in the United States has thus far been limited, likely due to strict Federal Aviation Admin-istration (FAA) regulations (Federal Aviation AdminAdmin-istration, 2015). Research and development on the usage of UAVs has been focused primarily in the areas of search and rescue, agricultural surveillance, and delivery logistics. In the context of infrastructure inspections, the utility of drones has been explored to some degree on wind turbines, public utilities pipelines, and bridges. Autonomous inspections of paved road infrastructure remains a relatively unexplored area of application, however, their quick response times, maneuverability, and resolution, make them important alternatives for pavement assessment (Schnebele et al, 2015).
In contrast to other airborne platforms, UAVs are highly flexible. They are capable of providing high-resolution, near real-time imagery often with less expense than manned aerial or spaceborne platforms. UAVs can be programmed offline and fitted with a variety of imaging devices. Data from aerial platforms can also be more narrowly targeted both spatially and temporally than satellite data, providing the ability to revisit specific areas of concern without being schedule driven. (Cronin et al, 2014). They are able to operate rather close to the object, acquiring image with resolution as fine as a few centimeters (Zhang, 2009). Using pattern recognition and image classification techniques from 2D images collected from a UAVs, researchers have been able to identify surface defects such as rutting, washboarding, and potholes on unpaved roads (Schnebele et al, 2015).
a) Zhang (2009) presented a platform combining an electric airframe model helicopter and a ground control station to autonomously collect photogrammetric footage of unpaved roads. With the exception of take-off and landing, which were performed by a pilot in assisted mode, the flight mission was navigated according to a plan in fully automatic mode.
Manual field measurements were conducted to establish ground truth for testing the accuracy of the proposed system. The depth and size of distress were measured in GIS software (ArcMap), with an accuracy of 1 cm compared to field survey measurements.
At the moment this system does not include onboard image processing of the footage to detect distress in real-time. Although the researchers' goal is to develop a framework for 3D surface model generation, allowing for estimation of the vertical dimensions of distress, the image matching for 3D reconstruction is slow, making real-time computation difficult (Zhang, 2009). Furthermore, the system as designed is contingent upon the proper arrangement of sensors; wires must be wrapped securely, and antennae of sensors onboard must be well arranged to avoid signal interference (Zhang, 2009).
b) Cronin et al. (2014) filed a US Patent Application for an invention that provides a system and method for sensing and managing pothole locations and pothole characteristics. The proposed system may acquire, fuse, and analyze pothole sensing data from several sources to identify potholes in need of maintenance or repair. Additional information about the potholes, such as population and severity, may be included to allow individual entities to coordinate efforts to more efficiently schedule pothole repair. The data acquisition sources mentioned in the application include satellites; aerial platforms, such as airplanes, helicopters and UAVs, both remotely-operated or autonomous; and ground-based geo platforms. The aerial platforms can be fitted with sensors, such as cameras, radar, and GPS.
The system would operate by first prompting the user to define a location of interest, pothole severity thresholds, and roadways of interest. The workflow of the tool entails filtering and fusing the data after acquisition, and combining it with a GIS database for analysis. After processing, a report would be generated and sent to a maintenance department.
The patent application describes a pothole detection system similar to the one proposed here, albeit in very broad terms. The authors make no commitment to any one data acquisition platform or sensor technology in particular. Furthermore, the application does not cite any technological developments or work done towards the development such a system.
c) Brooks (2016) proposed the development of an unpaved road assessment system. The system was prototyped on a hexacopter capable of up to 20 minutes of flight time, and a Nikon cam-era. It relies on close-range photogrammetry to recreate the imaged areas in three dimensions, successfully identifying 96% of potholes.
Automated distress detection is performed on these images offline, post mission completion. The data analysis was performed RoadSoft, a GIS software package that must be installed together with several dependencies on a Windows operating system, significantly restricting widespread
platform-independent usability.
2.2.3 Performance
Vision-based methods show great potential for implementation in real time pothole detection systems due to their moderate storage and processing requirements. In previous research, pothole detection has successfully been carried out during video playback. Real-time data analysis is theoretically possible using vision-based approaches but has not been implemented in recent research studies.
The usage of UAVs as a low-cost, efficient alternative to vehicular and other airborne data collection systems has also been explored, however vision-based studies using UAV platforms have involved manual operation of the aerial vehicles for data collection and subsequent data processing offline. The studies employing drones for sensing purposes have also focused on unpaved road inspections in particular. The coupling of UAV data collection and real time vision-based pothole detection on paved roads remains an area for further research.
To date, I am aware of one project aimed at deploying UAVs to perform autonomous real-time inspections of paved roads, proposed in October 2015 at the University of Leeds in the UK (Popular Mechanics, 2015). The project will aim to create the first self-repairing city and intends to do so by both detecting and repairing issues on elevated structures (streetlights and power lines), at street level (potholes), and underground (utility pipes). This is an ambitious project, however the methodology and timeline for completion are unclear.
3 REQUIREMENTS
Vision-based approaches present a promising avenue for research in pothole identification. Simpler tools that incorporate single camera sensors can be implemented at a lower cost than those incorporating stereovision or laser techniques, while still providing the capability of locating potholes where depth information is not necessary.
What a number of the existing vision-based tools for automated detection have in common however, is the fact that data processing is done subsequent to data collection. This necessitates additional time and the availability of trained technicians to perform the analysis. Combining data collection and data processing simplifies the inspection process and results in efficiency gains both in terms of time and personnel costs.
Post-processing additionally requires dedicated storage of all data collected for examination at a later stage. A GoPro camera recording 30 frames per second at 1080 pixel resolution produces 149MB of data in one minute, for a rate of 8.9GB/h. An external storage device would likely be necessary for such a system, and storage space would have to be frequently freed to accommodate high rates of data collection. A tool that only stores data of interest would introduce further efficiency gains and relax the hardware requirements for pavement inspections.
Finally, the majority of vision-based tools in existence have been developed for use on dedicated vehicles fitted with sensor racks, implying that significant funds must be devoted not only to the purchase and assembly of the vehicular data collection systems, but also the commission of technicians to operate them.
4 CONTRIBUTION
The novelty of the proposed automated pavement inspection tool lies in its integration of several autonomous reasoning components into a single platform, capable of performing inspection of this nature in real time. From an analytical standpoint, there are several advantages associated with such an approach. First, it will automate and centralize a process that is currently fragmented between various data collection mechanisms, all of which are at least in part manual. Second, by using a classification algorithm than can be tuned to identify pavement distress at different severity levels, the subjectivity and error that may arise from human involvement in the detection process can be controlled. Finally, a standardized approach will ease and expedite the prioritization of more urgent cases.
The platform also has the potential to introduce significant efficiency gains in the pothole detection process. Given the specifications of higher-end micro UAVs currently available on the market, a single-UAV prototype of this system has the capacity carry out 5 missions in a single 9-hour work day, which equates to traversing an area of 145km (90mi) at maximum speed of 89kmh (55mph). This is equivalent to approximately half the distance between Boston and New York City.
In comparison to pothole detection tools developed for vehicular platforms, drones present several advantages. They are not affected by ground traffic congestion and resulting time loss during data collection, as airborne missions can be terminated at any location. Moreover, sensing can be performed at various scales due to the flexibility of a drone to fly at any altitude up to the legally set limit of 122m (400ft) in the United States (FAA, 2015). Given adequate spatial resolution of the sensing device, the flight height can be increased without loss of detail, and a larger area can be covered in each image (Zhang, 2009).
The assembly of the system presented here is also substantially easier than for the vehicle-mounted systems developed in previous work. The sole manual assembly requirement is for a three-axis gimbal and camera to be attached to the UAV. A drone-mounted camera can be easily calibrated for a downward-facing view of the road, eliminating the necessity to extract an area of interest or otherwise transform the collected images prior to distress detection. Data computation can
also be performed in real-time directly on the drone's on-board computer, without the need for an external processing device to be added to the system. The GoPro system developed by Nienaber et al (2015) was demonstrated to process road extraction in 0.148s and pothole detection in 0.037s per frame. At a total algorithm runtime of 0.2s, it is viable for real-time deployment on a vehicle driving at a normal speed (less than 60km/h, or 17m/s). The storage demands of a tool that operates in real-time are also significantly lower, as only data points containing features of interest are recorded.
In addition to efficiency gains, UAVs can present significant financial gains to road inspections. Just like other platforms that employ image processing for pothole detection, a UAV platform can store the digital data recorded for post-mission review, but at a fraction of the cost. Brooks (2016) found that the cost per mile for operating their UAV pothole-detection platform is $0.74, while the cost associated with the vehicle itself is $0.55/mi. This adds up to a total of $1.29/mi, a rate significantly lower than ground truth collection methods, costing up to $280/mi (Brooks, 2016).
5
METHODOLOGY
5.1 Hardware
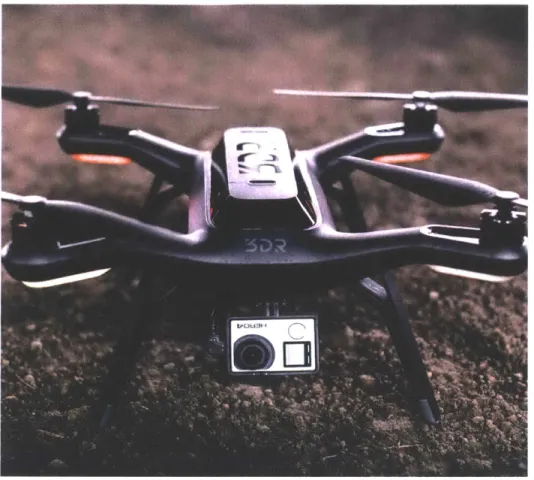
The pothole detection tool was developed on 3DR's Solo drone coupled with a GoPro Hero4 Black camera (Figure 3). Solo runs on a dual 1GHz computer platform with 512MB of RAM and can reach speeds of up to 89 km/h (55mph) (3DR, 2016). The GoPro camera is installed on the drone by means of a gimbal with three-axis stabilization. The gimbal corrects for any vibrations generated during flight and keeps the camera level for higher quality video recordings. This setup permits a camera angle range of 0*-90*, the 900 position corresponding to the downward-facing, bird's eye view required for this tool. The video for this project was streamed at a rate of 24 frames per second (fps) at 1080 pixel video resolution in a Narrow field of view (FOV) setting, which removes the GoPro's default wide, 'fish-eye' distortion.
Figure 3: Solo drone
5.2 Software
3DR has developed the Solo CLI API, a command-line tool serving as a pipeline for communication, control, and software updates between a remote development platform and Solo. The Dronekit Python API. also designed by 3DR for UAV application development, allows for access to the Solo's vital readings and for missions written in Python to be deployed on the drone. The two APIs were used to develop the Python-based software for the project.
The software system is designed to generate missions corresponding to flight paths created in Google Maps. A path parsing script takes a user-generated kml path file and extracts latitude, longitude coordinates from the path. These coordinates are used to generate an autonomous mission for the drone, whereby the vehicle takes off at the starting coordinate of the path and
A%-Ar V
travels in a straight line directly over each road segment to a consecutive waypoint coordinate. As the mission is underway, a pothole detection algorithm is executed to analyze the video feed and look for possible defect locations. When such a location is identified, a directory is generated on the drone's onboard computer, storing the coordinates, timestamp, and image associated with the distress.
The full source code can be found at https://github.com/mpetkova/DronePotholeDetection.
5.2.1 Path Parser
This script takes an input KML file containing the path of interest and parses it to extract the latlon coordinates that will form the mission. The third, altitude coordinate of each point in the path, which is 0 by default, is ignored.
A point in a KML file might look something like this:
<Placemark> <name>WP 1</name> <styleUrl>#icon-503-DB4436-nodesc</styleUrl> <Point> <coordinates>-71.0871099,42.3610343,0.0</coordinates> </Point> </Placemark>
To parse this and save the coordinates to a file, the pykml Python package was used to generate the code below:
f
or pm in root .Document .iterchildren : if hasattr(pm, 'Point'):coords = str(pm.Point.coordinates) .split(',', 2) file_.write(str(coords[0]) + ',' + coords[1] + '\n')
5.2.2 Mission Generator
A function in the code that is to be run onboard the drone parses the new file containing just the coordinates of the mission waypoints and stores them in a list of waypoint objects. The last line in the code below generates a waypoint using the latlon coordinates and assigns it an altitude value of 3 meters.
with open('some-path.txt') as f: for line in f:
coords = line.split(',')
waypoints.append(LocationGlobalRelative(coords[0], coords[1],3))
The mission script directs the drone for flight in 'GUIDED' mode, which means that the vehicle is guided between the waypoints. This also allows an operator to take over manual control at any time.
A function that monitors the drone's battery life ensures that the drone changes its course in time to reach its final destination, which could be the starting point of the mission. This function makes a conservative estimate of the maximum flight time possible on Solo with a payload. Currently this value is set at 18 minutes, however the parameter is tunable.
#vehicle.battery.level returns an integer on a scale of
0-100%
battery-left = (18 * vehicle.battery.level) / 100timethreshold = distancefromhome / vehicle.airspeed if timethreshold < battery-left:
headhome = True
5.2.3 Pothole Detection Algorithm
The pothole detection algorithm is based on a combination of the image processing methodologies presented in Huidrom et al (2013), Koch&Brilakis (2011) and Ryu et al (2015), which use a slightly
varied set of attributes to extract distress features from images. The OpenCV library for image processing is used in conjunction with Python to analyze the video feed. Of particular relevance for the operation of this algorithm are the Python libraries numpy (for scientific computing and multi-dimensional data processing) and pylab (for numeric computation). The analysis is described in further detail below.
5.2.3.1 Conversion to grayscale
The gray image channel is sufficient for the analysis to be performed, so the initial step of the algorithm involves converting the input image frame to grayscale.
5.2.3.2 Image smoothing
A
1D
median filter is applied to the image to remove noise. For this application, an 11xI1 kernel was used as it performed better than smaller kernels.img_filtered = cv2.medianBlur(img, 11)
Figure 5: Smoothing (lixil kernel)
I
5.2.3.3 Image segmentation
The grayscale image is converted to a binary image to differentiate features of interest from healthy pavement areas.
threshVal, threshImg = cv2.threshold(img,110,255,cv2.THRESHBINARY)
Several segmentation techniques were employed depending on the lighting conditions and pavement type inspected. When testing the tool on roads paved with several layers of asphalt, the binarization threshold was set manually by testing several cutoff values on a set of pavement images, with 110 set as the cutoff pixel intensity value. In other words, pixels with a value of 109 or
less were classified as healthy pavement, while pixels with a value of 110 to 255, the upper cutoff and the maximum possible intensity value, were classified as possible features of interest. Using this threshold improved the accuracy of the algorithm as compared to automatically calculated thresholding levels determined by algorithms such as Otsu's binarization.
During later testing on a surface with a thin layer of pavement over sandy sublayers, the threshold was set using the Adaptive Thresholding method provided by OpenCV In this case, potholes appeared lighter, rather than darker, as compared to the rest of the pavement, necessitating a different segmentation approach for good performance.
threshVal = cv2.adaptiveThreshold(img,255,cv2.ADAPTIVETHRESHMEAN_C, cv2.THRESHBINARY_INV,27,2)
5.2.3.4 Noise removal
Artifacts that may not be of interest are removed from the binary images. This is done through a combination of erosion and dilation functions.
Erosion erodes away the boundaries of foreground object, depicted in white in a binary image. A kernel passes through the image as a 2D convolution. A pixel in the original image (either 0 or 1) will be set to 1 only if all the pixels under the kernel are 1, otherwise it is eroded (set to 0). This means that generally, all pixels near the boundary are eroded, while the thickness or size of the foreground object (white region) decreases. Erosion is useful for removing minor noise, detaching two connected objects etc. (Figure 7) (OpenCV, 2015).
Figure 7: Erosion operation (source: opencv.org)
Dilation is just opposite of erosion. Here, a pixel element is I if at least one pixel under the kernel is 1. As a result, dilation increases the size of the foreground object (black region). Normally, in cases like noise removal, erosion is followed by dilation. This is because erosion removes noise, but it also shrinks the object. When dilated, the noise is removed, but the area of the object of interest is increased. This operation is also useful in joining broken parts of an object (Figure 8) (OpenCV, 2015).
Figure 8: Dilation operation (source: opencv.org)
Opening refers to erosion followed by dilation. It is useful in removing background noise (Figure 9). Closing is reverse of opening, namely dilation followed by erosion. It is useful in closing small holes inside the foreground objects (white artifacts on the black object of interest) (Figure 10) (OpenCV, 2015).
6
Figure 9: Opening operation (source: opencv.org)
0
Figure 10: Closing operation (source: opencv.org)
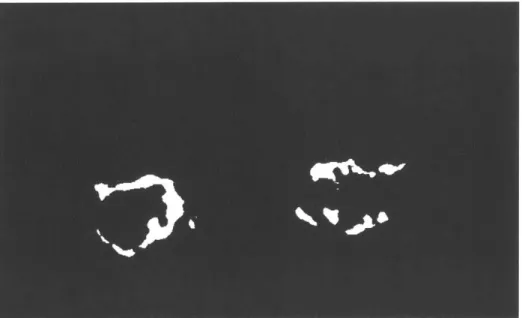
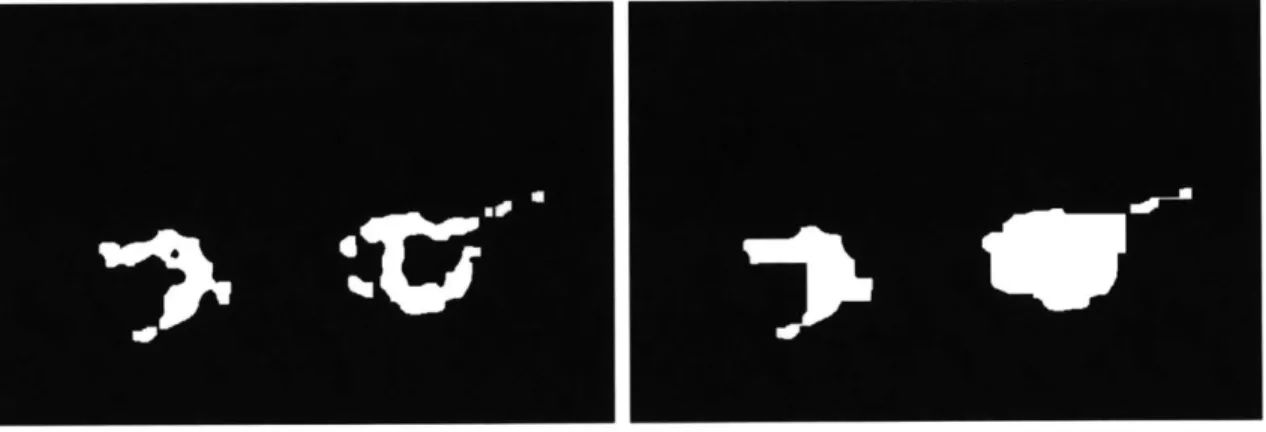
Opening was first performed on the segmented images (Figure 11 (a)), followed by closing (Figure 11 (b)) in order to make the features of interest more distinct against their surroundings.
(a) opening (b) closing
Figure 11: Opening and closing operations
5.2.3.5 Shape fitting
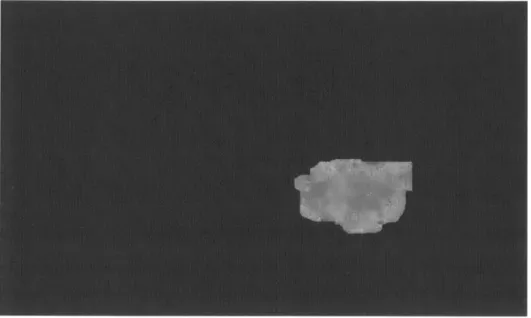
a) Contour estimation returns a contour object for each candidate feature in the image. The figure below shows the contour estimate for one feature in the image.
contours,hierarchy = cv2.findContours(image,2,1)
Figure 12: Contour estimation
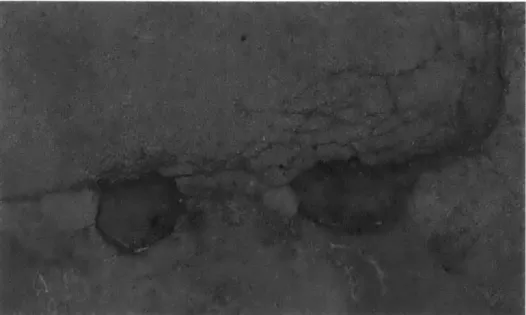
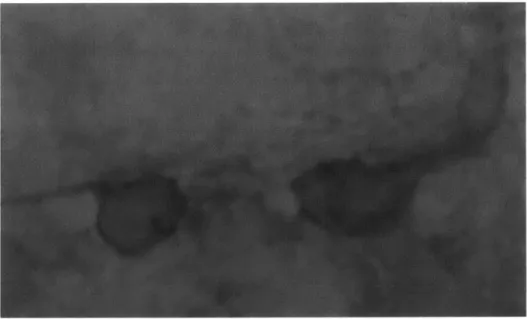
b) Elliptical fitting is performed on each contour, which represents a single object of interest. In the image below, three objects were detected, two of which were classified as potholes.
for c in contours: