TARA
Village Electrification through Sustainable use of
Renewable Energy (VE-SuRE)
BIOMASS ESTIMATION
AND METHODOLOGY
TARA
STAGES IN SETTING UP A MINI/MICRO HYDEL PROJECT Village Electrification through Sustainable use of Renewable Energy (VE-SuRE)
TARA
A HANDBOOK FOR RESTORING DEFUNCT BIOMASS GASIFIER PLANTS
Village Electrification through Sustainable use of Renewable Energy (VE-SuRE)
Contributor
Dr. Ajay Sharma, Rashi Verma, TARA
Reviewers
Tejinder Bhogal, Innobridge Consulting Pvt. Ltd.
Acknowledgment
We place on record our gratitude to the Swiss Agency for Development and Cooperation for providing the financial and institutional support, National Thermal Power Corporation (NTPC) and TARA field team for providing field support, local communities of the project villages, local NGOs for their untiring work and enabling us to broaden our understanding of field realities.
Branding and Designing Guidance
Ranjeeta Ghosh, Jay Vikash, Development Alternatives Group
Disclaimer
The views, analysis, interpretations and conclusions expressed herein are those of the contributors and do not necessarily reflect the view of the Swiss Agency for Development and Cooperation (SDC) or NTPC. The information contained herein has been obtained from sources and consultations, which the Contributors believe to be reliable and accurate. The Contributors, editor and the supporting agency associated with the policy brief are not liable for any unintended errors or omissions, opinions expressed herein. The contents of this report may be used by anyone providing proper acknowledgement.
TARA
POLICY BRIEF ON BIOMASS BASED DDG PROJECTS Village Electrification through Sustainable use of Renewable Energy (VE-SuRE)
TARA
Village Electrification through Sustainable use of
Renewable Energy (VE-SuRE)
BIOMASS ESTIMATION
AND METHODOLOGY
Preface
Accurate estimation of biomass and establishing biomass supply chain is a preliminary exercise for biomass based power production. Most of the relevant biomass is produced in abundance in agricultural fields, private wastelands, village common lands, and forests. The process of biomass estimation and methodology of calculation is methodical in nature. Different Biomass estimation methodologies are used for resource estimation. Land records and crop productivity in these lands are procured from relevant revenue, forest, agriculture and research organizations. The vegetation cover, regional socioeconomic, biomass extraction processes, extraction pricing as well as management regimes may differ depending on the ownership pattern existing in the region over land as well as resources. This manual guides one towards biomass estimation from different resources as well as development of biomass management plans. Biomass planners / raw material managers with biomass based power plants shall find this manual useful.
Table of Contents
1 INTRODUCTION 1 1.1 Availability of Biomass – a key challenge for biomass based power plants 2
2 BIOMASS ESTIMATION METHODOLOGY 4 2.1 Objectives of Biomass Estimation 4
2.2 Methodology 5
3 ANNEXURE I 26
4 ANNEXURE II 27
1. Introduction
The global demand for electric energy is expected to increase from about 14 billion
1
TCE to 19 billion TCE by 2020. In India too, the demand for electric energy is expected to go
up d rastically.
At present electricity production in India is based on coal, gas & hydel power. There are two implications of electricity produced in this fashion. One, electricity from these
sources is not likely to meet all our country's needs. Secondly, electricity produced from these sources gets distributed around the country through a centralized grid. This grid usually does not reach many remote rural areas. In other words, the expected shortfall in electric production is likely to have a much greater impact on remote rural areas, than at other places.
One way of ensuring supply of electricity to remote rural areas is to adopt the construction of small sized, decentralized generation plants that are dependent on renewable energy sources. Four such sources are already in wide use: solar, wind, micro-hydro and biomass.
Of these, one of the most significant is bio-mass in light of the availability of biomass across most regions of the country. According to one estimate, it is possible that India will be able to produce 35,000 MW of electric energy, by the year 2035,using biomass. At this level of production it would not only be able to meet 9% of India's power needs, but would also replace 8 million tonnes of coal, and prevent 40 million tonnes of carbon emission annually. For this to happen, however, it would need to address current drawbacks in the use of bio-masstechnology, some of which include:
• Improper technology configuration and designing
• Improper installation and maintenance of biomass power plant
• Setting up power plants at locations where dequate biomass is not available
TARA under the Village Electrification through Sustainable use of Renewable Energy (VE-SuRE) project has attempted to deal with all of the above three drawbacks. In order to deal with the first two, it has re-commissioned defunct biomass based power plants. And in order to deal with the third, it has developed ahandbook which documents the method of biomass estimation and assessment.
1.1 Availability of Biomass – a key challenge for biomass based power plants
A key challenge for Biomass based power production is to ensure that the right kind, the right quality, the right amount and the right channels of procurement of biomass are available within a certain distance from the plant. Each of the above is essential for the effective and economic operation of the biomass based plants.
The first point to note is that different types of gasifiers (those using different technologies such as gasification or combustion) require different kinds of biomass. The gasification based biomass based power plants utilize hard wood,
Ipomea, Lantana while combustion based power plants can utilize all the raw
material such as agri-residues, hard wood, Ipomea, Lantana. Consequently, the location of gasifiers has to be in line with the kind of biomass available in that location.
Secondly, the right quality of biomass is necessary in order to increase the efficiency of these plants. The right quality of biomass is the one that has high calorific value. The high calorific value based biomass like Ipomeais used directly in gasification in the power plant. Biomass with low calorific value will not be effective in a gasification based power plant. However, the calorific value of biomass can be enhanced by briquetting. Thus briquetting is an alternative method for assuring right quality of biomass. Briquetting, though, adds to the current cost. Hence, the current handbook does not cover it.
Thirdly, the right amount of biomass is the one that matches to the requirement of the power plant. For instance, a 30 kW gasifier running for 10 hours daily for 350
2
days a year requires 210 MT of biomass annually . In contrast, a 1000 Kilowatt requires 7000 MT of biomass.
1
Tonnes per Coal Equivalent
2
30 Kw gasifier running for 10 hours daily for 350 days a year will require 210 MT biomass (30 X 10 X 350 X 2= 2, 10,000 Kg= 210 MT).
Fourthly, using the right channels of procurement of biomass is also essential. The channels of procurem-ent of biomass are the ones that reduce the cost of running of biomass based power plants. For instance, the cost of transporting biomass is key to whether the biomass based plant runs economically or not. A megawatt scale power plant can economically draw biomass from within 25 – 50 km whereas a kilowatt (kW) scale power plant has to draw biomass from within few kilometers. From the above it becomes clear that the
first step in setting up any biomass based plant is to identify and estimate relevant biomasses available in specific areas and regions. For this to happen, what is required is a clearly defined biomass estimation methodology.
2 Biomass Estimation Methodology
2.1 Objectives of Biomass EstimationBiomass estimation and assessment is usually conducted at two stages; one at the Power Plant Design Stage and the other at Power Plant Re-commissioning Stage. The methodo-logy of conducting biomass estima-tion and assessment is similar but the objectives at both stages are different.
2.1.1 Biomass Estimation at the Power Plant design stage:
At this stage, a detailed biomass assessment is carried both at regional (block or district) and village level. The objectives of the assessment at this stage are to:
• Forecast availability of its supply for next five years • Estimate pricing of biomass for the next five years • Streamline biomass supply chain for next five years
• Validate biomass based gasification technology in terms of capacity and
type.
30 Kw gasifier running for 10 hours daily for 350 days a year will require 210 MT biomass (30 X 10 X 350 X 2= 2, 10,000 Kg= 210 MT).
2.1.2 Biomass Estimation at the Power Plant recommissioning Stage:
Under the re-commissioning stage, a detailed biomass estimation and assessment is conducted both at regional and village level to meet the following objectives:
• Estimate available biomass supply
• Streamline biomass supply chain for assuring continuous supply of
raw material (biomass) to the power plant.
• Estimate/ analyze the price at which the biomass would be available
considering seasonal variation and availability.
• Adopt alternative methods for facilitating continuous biomass supply by
community participative alternatives such as Energy plantation on waste land,
Integrative energy plantation with forest departments in case of Joint
2.2 Methodology
As indicated above, while the objectives of assessment at the two stages are different, the methodo-logies remain the same. Accordingly, this section details the over all methodology being used in the two stages. Biomass estimation and assessment is conducted in the following step-wise manner:
• Conducting surveys:
Biomass availability survey (quantifying and qualifying available
biomasses)
Biomass based consumption survey (identifying bona-fide and
competitive users)
• Analyzing Data:
Characterization of Biomass
Biomass Utility
Biomass Pricing
• Recommending/ assessing Outputs/ Results:
Resource Map
Biomass Management Plan/ Strategy
2.2.1 Key Concepts of Methodology
There are four key concepts related to survey methodology: Approaches to surveying; defining the Bio mass boundary; constructing the map and conducting a sample survey.
• Approaches to surveying: Surveys are conducted for estimating biomass
availability and assessing biomass consumption pattern.
Two approaches are under-taken for conducting surveys. The two approaches used for conducting surveys are: the Secondary approach and the Primary approach. In surveys conducted based on secondary approach, the information is collected from sources such as district headquarters, agricultural department, census and other governmental officials and websites. These sources are not the direct consumers of
biomass, but rather, they keep records concerning the direct consumers. In contrast, in primary survey approach, data or information is collected directly from the consumers, or those who are working directly or closely with the consumers of bio-mass(officials such as Patwaris etc).
• Defined Bio system boundary
Biomass system boundary (or catchment region) for a biomass power plant is the region from where biomass can be procured either economically or easily or as per right. The extent of this catchment area is defined by the Transport cost. Normally, power plant use biomass whose cost of
1
transport is less than Rs 1 per kg . The lower the transport cost, the more feasible is the biomass resource.
It has been observed that the basic principles of biomass estimation remain the same, the methodology for resource survey changes with geographical spread / scale of operation. Thus, “a 50kW power plant or a Cocoon boiling gasifier based boiler may require biomass
study in one village whereas a MW scale power plant may need a biomass resource survey over several districts.”
• Map of the study area
The map is the first major tool to explain the study area to a new enumerator / planner. A map of the study area helps to place in perspective the different production as well as consumption centers, target population, their agricultural land, sources of irrigation water, and prospective plantations sites.
A map of the site may either be procured or prepared. At village level, social research methods like PRA may be used to prepare the map with the help of villagers.
• Sample Selection
The sample should represent the whole of the study area. Often, 1–10% of
2
exact sample size is determined based on, firstly, the time available to conduct the study, and secondly, the extent of funds allocated for the study.
Samples may be selected randomly or by using stratified sampling or other advanced statistical tools like cluster analysis. The sample for conducting surveys may also be selected in the following manner:
In case of a block or district
level (not a village level) study, sample villages are selected based on secondary data
T h e v i l l a g e s a r e t h e n
categorized according to their “per capita agriculture land and per capita forest land”
Villages are divided into different categories of land availability for
3
biomass production (also different levels of biomass production)
From these categories, sample villages are selected for in-depth
biomass assessment, in proportion to the number of villages in that category
2.2.2 Conducting Surveys
a) Estimating Biomass Availability:
There are three steps involved in estimating bio-mass availability: conducting a secondary survey, conducting a primary survey, and finally, using formulas to convert the survey data into estimates of bio-mass availability.
The data about different types of biomasses is aggregated and tabulated to estimate biomass availability in the power plant location.
Conducting the Secondary Survey:
The biomass availability in the location is first estimated by secondary survey. The data is collected at three levels:
1
This includes the cost of handling
2
A- population is defined as a large collection of individuals or objects that is the main focus of the research study.
3
One of the way to categorize could be to indicate %age of land that is available for bio-mass production. Thus, the different categories could be: 1-24% of land, 25-49% of land, 50-74% of land, and >75% of land available for bio-mass production.
4
A biotic pressure is defined as the tendency of a specie or community to extend its range on existing resources especially in this case biomass that is available.
• At district headquarters level: The data captured at the district
headquarters relates to the types and quantity of biomass that might be available according to census. It also captures data on supply and availability of alternate source of energy for cooking and lighting purposes.
4
This data is useful in estimating the extent of biotic pressures on the available biomass
• At block level: The data collected at block level relates to land use pattern.
This data is available in the form census records found in various governmental offices. The data is used for estimating availability of biomass for power production based on trends in urbanization and industrialization, (this includes the extent of organized and un-organized industries)as well as the extent of agriculture markets
• At academic/research institutes level: The data from educational or
academic institutions is used for estimating biomass ratios, productive capacity of biomass. The data is useful for estimating quality of biomass
The sources of information as well as the kind of information required at each level are mentioned in the table below:
S.No. Information Source
At District Headquarter (Secondary Sources)
1.1. Land use (mix of agriculture, wastelands,
habitat, forestry), Crop-wise land use (main crops & irrigation sources), Census records
District Statistics Officer
2.2. Kerosene, LPG supply District Statistics
Officer
3.3. Industrial profile (biomass consuming /
producing industries)
District Statistics Officer
4.4. District & Block profile D.C. office, Block
office and NIC
At Block level
5.5. Land use, Census, industrial profile, trends
in urbanization and industrialization, Organized and Un-organized industries, agriculture markets
Local Block Development
Officer & Industry Officer
6.6. Growing stock, sustainable yield of forests Divisional Forest
Officer, Forest Survey of India reports
7.7. Crop-wise land use, grain productivity, grain
to straw ratio, Irrigation systems.
Block Agriculture Officer, Secondary sources, Agriculture
University,
At Academic/ Research institutes
8.8. Crop-wise grain productivities, Land
productivities status, biomass related ratios
Krishi Vigyan Kendra, MNRE
website, Agriculture
University Table 1: Estimation of Biomass Availability by Secondary Survey Approach
Conducting the Primary Survey
The primary data collection for estima-ting biomass availability happens at three levels:
• At village level,
• At biomass market level and • At agro-industrial level
The sources of information as well as the kind of information that is required at each level are mentioned in the table below:
No. Information Source
At Village Level (Primary Survey)
1. Livestock, Grain / grass / shrub productivity,
Energy & biomass consumption, develop biomass related ratios and norms (Grain to straw ratio, wet to dry ratio), Electrification, Agriculture development, market prices, transport arrangements, etc.
Villagers
2. Power requirement & consumption
pattern, biomass processed or consumed, production process, electricity bills, details of generators, diesel consumption, power cuts, operational periods, etc.
Industries (Saw-mills, rice-(Saw-mills, paper
board, oil mills, Ginning mills,
Etc.)
3. Quantities and prices of biomass traded
(Agro residues, agro-industrial sites, saw dust, bamboo, fuel wood, forest wood), Contacts and capacities of Traders, price and availability trends, identification of high production areas.
Biomass
traders,
Transporters
At biomass marketTable 2: Estimation of Biomass availability by Primary Survey Approach The primary survey uses the following tools:
• Questionnaires based survey tools
• Direct/ Indirect Interviews
• Participatory Rural Appraisal (PRA)
• Formal/ informal group discussion
4. Quantities consumed / produced, operating
days and hours, size, make and model of boilers or unit K Traders, and transporters, websites of boiler manufacturer At Agro-industries (Biomass consumer and producers)
Estimating different types of biomasses
Three types of biomasses are available, in different ratios, at different locations. These three are: agricultural crop residues, wood from trees, and, herbs and shrubs. The estimation for each type of biomass is done differently:
1. Estimation of Agri-crop residue (or agri crop biomass)
This estimation is based on the following data:
• The major crops growing in the area (particularly those crops whose
residues used in the power plant)
• The area covered by each crop
• The grain productivity of each of these crops • The ratio of grain to straw in these crops
The data of major crops growing in an area considers how much land area is being covered by these crops. The information about grain productivity and the ratio of grain to straw is taken from secondary approach such as research papers or by conducting a primary study in the location.
After estimating the crop data from secondary and primary approach, the following steps are undertaken to calculate the crop residue production:
i. For desi and hybrid varieties of different crops under irrigated and un-irrigated conditions, seperate quadrates are laid in at least three villages ii. A wooden square shaped quadrate, with all the four sides measuring 0.5 m,
is randomly placed in the agricultural fields
iii. The entire crop in the quadrate is harvested, weighed, tied up, and left for air drying at a clean, protected place for four days
iv. The straw (Residues) and grains from within this quadrate are collected, are again air dried for four days and are re weighed
v. The grains are dehusked and these are weighed again separately. This weighing provides both the amount of grain collected in a quadrate, as well as allows the calculation of the actual grain-straw ratio
vi. Crop residues are then calculated by using this information in the following formula:
Formula used to estimate agri crop residue production
Crop residue production = Area under a crop (in ha) x Grain productivity (in Kgs per ha) x Grain to straw ratio
The same formula is applied to estimate residues of all eligible Bioenergy crops. Total crop residue production is the sum of crop residues from all the major crops.
2. Estimation of Wood from trees (or Woody biomass)
Some villages have plantations/forests within the village area. However, trees are present in all different strata that are homestead, agricultural land and village forest land. All the trees in different strata can provide biomass that will be useful for power production:
The woody biomass available from tress can be estimated by using two formulas:
Formula (a)
Growing stock (per ha) = Area under plantation or canopy (per ha) x productivity (kgs per hectare)
Annual Sustainable Yield = Growing Stock x 0.01
Productivity estimates made by Forest Survey of India (FSI) for the area are used (FSI, 1997). A factor of 0.01 is used to compute sustainable yield. It is selected on the basis the assumption taken by the FSI that forests are renewed in a 100 year cycle. Therefore, one percent is the sustainable yield.
Formula (b)
Growing stock and sustainable yield can becalculated by using the following formulae:
Growing stock (per ha) = Average basal area x Crop height x Form factor x Area (ha)
Sustainable Yield (kgs per year)= (2 x Growing Stock)/R R (Rotation cycle) = 50 years (assumed)
3. Estimation of Herbs and Shrubs (or Herbaceous and Shrubaceous biomass):
Biomass available from herbs - grass
Grass production is a function of the grass productivity in the common land. The grass productivity is estimated by 'quadrate study method.' To calculate grass productivity at least 30 quad rates (10 each in different village are laid down). Total grass production in that village is then calculated by using the formulae:
Total grass production in a village:
Grass production (in kg) = Average grass production (kg/ha) * village common in a village land + Share as per the land settlement (kg)
Biomass available from Shrub
Shrubs are of different shapes. Shrub biomass production could also be determined by a randomly laid quadrate during winters (winter being the dry season for shrubs). However, this approach fails to capture 'density' of crop as well as counter human bias in sampling. Consequently, a new method is proposed for calculating the shrub biomass production of an area:
Total shrub production in a village:
Shrub biomass production (in kg) = Average shrub production (kg/ha) * Total in a village common land (ha) + Share as per the land settlement (kg)
NOTE: The methodology of estimating availability of different types of biomasses
b) Assessing Biomass consumption pattern:
After biomass availability has been estimated in the project location, biomass based consumption pattern is assessed. This assessment allows us to calculate the net biomass available in the project location for power production. (in other words, net biomass available = Total biomass available - present consumption of biomass)As in the case of biomass availability, the assessment of biomass consumption too is done with the help of secondary and primary surveys.
Conducting the Secondary survey:
The secondary survey attempts to collect data related to the consumers of biomass. These consumers may be industrial units operating in the location, households or agri-allied services. The data is collected from the following sources:
• Direct/indirect interview with various stakeholders such as food and civil
supply officer, kerosene and LPG depots, and electricity as well as forest department
• Information provided by annual reports submitted to District Industry
Officer
Conducting the Primary Survey:
The primary survey focuses on the direct consumers of biomass power. This survey is one in the following stepwise manner:
• A Questionnaire is designed to collect information on cooking habits like
the use of cook stoves, the availability of livestock, the consumption of dung-cakes, LPG, kerosene in households and the use of diesel and kerosene in agriculture
• Informal interview / discussions are held with industrial design experts, in
order to understand the kind and extent of biomass being used in specifics boilers or in specific machinery configurations
• Traders or contractors are interviewed to find out about the extent
of biomass handled, biomass produced, power consumption, size of generator and diesel consumption. This information is obtained from the
BASELINE SURVEY QUESTIONNAIRE
Sample questionnaire to study village households for biomass and power consumption / disposal
Village: ……….………...………Tola……….Panchayat……….……… Family head:…………...………Father's/Husband Name:…...…………...….. Men:………..Women:……..Children (<15): M………F…….. (Total=……...…….)
Educational: Earner
Skill set:
Assets: Vehicle: Tractor: Cart: Pump:
Others
Land holding size: ………Bigha House: Kuchha / Pucca / Semi
Pucca/ no. of rooms
Cattle holding (in numbers)*:
Buffaloes: ………..………... Calves: ………..…….. Bullocks: ………..…..
Goats/Sheep: ………. Cows: ……… Others: ……….
Milk (per day):……... Rate: ...….... Market: …..… Transportation cost……… [* indicate in brackets whether stall-fed (S) or open-grazed (O)]
Domestic water source and distance:
Dugwell/ Handpump/ Canal/stream/ Tubewell: Seasonal availability
Health and awareness:……… Toilet: ……...
Fuel use (cooking, space heating & lighting purpose):
(1) Wood:…...…... Gatthha (2) Dung cake….…...……..
(3) Kerosene :…….(lit)…..…(Rs) (4) Others……..……….
No. of cook stove……….. Type……….
Cooking hours_____________________________Sessional changes_________________________________
Potential electricity demand
(1) Light points:…….…. (2) TV…...…… (3) Fan……...….
(4) Refrigerator………..
(5) Cooler…...… (6) Music player...… (7) Others…..……
Source of income and total annual income:
(1) (2)
Economic activities (skill based, scheme based, market, resource based): Irrigation Detail:
Season Crop Crop ping area in acre Production in quintal Residue in quintal Rresent use of resi due Surplus amount in quintal Kharif Rabi Zayad
2.2.3 Analysing Data:
After the conduct of the surveys, the data is analyzed and processed to answer the following three questions:
• Characterization of Biomass: What kind of biomass is available in the
project location
• Biomass Utility: What is the available biomass that can be utilized for
power production
• Biomass Pricing; What is the cost of biomass available for power
production
a) Characterization of Biomass
The primary or secondary surveys conducted above provide data on the type of biomass available in the location.
As it has been already emphasized in Section 1.1 of the manual, the right quality of biomass is necessary in order to increase the efficiency of the power plants. The right quality of biomass is determined by the calorific value. The calorific value of a biomass depends on its bulk density, moisture content and size. Based on the bulkiness or density of the biomass, different energy routes are justified for power production. It has been observed that:
• Woody biomass has higher calorific value than chaffy / leafy biomass
• Biomasses that contain some alkaloids, gums, or sugar content, also
have higher calorific value
The frequently available biomass in different seasons having different calorific value have been tabulated in Table 1 of Annexure II to the manual. The table below indicates the different ways these wastes are converted into energy (what are termed as their 'preferred Energy routes') as well as the calorific value of various types of biomasses.
Different biomass and their suitable energy processing mechanism
As discussed, different types of biomasses have different calorific value. Based on calorific value, different energy routes are preferred for biomass based power production :
Source Wastes Calorific value (in Kcal/kg)
Preferred Energy route /
Agricultural Wastes
Commercial crops Cotton sticks / seeds /
lints, Coconut coir / shell, Coffee grounds
Combustion, Gasification, Alcohol Combustion, Gasification Alcohol Fruits and vegetables
Peels, cores, rotten banana, Tomato, Banana stem, Potato, Okra stem & leaves,
Biomethanation, Alcohol
Combustion, Gasification
Oil seed crops Groundnut, Rapeseed, Safflower, Mustard, Castor, Linseed, Sunflower Combustion, Gasification, hydrolosis to liquid fuel 3500 – 4800
Pulses Arhar, gram, soya bean Briquetting, Combustion, gasification 3800 – 3900
Cereals Rice husk,
Rice straw, maize stalk, cobs, Combustion hydrolysis to liquid fuel, Fermented to Ethanol production 3000 – 3500
Sugar crops Cane Molasse, bagasse Biomethanation, Combustion 3000
Miscellaneous crops
Jute, Hemp, Tapioca 3500- 4000 Combustion
Industrial Wastes Plastic wastes, paper wastes, textile wastes, Coir, shells
Combustion, Biomethanation 8000
Animal wastes Cattle dung, cattle shed wastes, fisheries, prawn and frog wastes, slaughter house wastes
Combustion, Biomethanation 3000 – 3600
Forest Wastes Saw dust, wood chips, dried tree branches, tree twigs, tree bark, leaf litter, fuel wood
Combustion, Biomethanation
Municipal Solid Wastes
sludge, garbage, horse dung, cattle dung
Biomethanation 2600 2800 – 3200 Terrestrial Hardy Weeds Ber, Lantana, Calotropis, Besharam, Combustion, Biomethanation 3200 – 3800
Aquatic Weeds Water hyacinth, Duck weed, Algae,
Biomethanation 3500 – 4500
b) The utilization of Biomass
As mentioned in Section 1.1, the right amount of biomass in the project location is essential for power production. Biomass utility thus, helps determine
• Total biomass that will be available in
the region for power production
• Total biomass power production
potential
Estimating biomass available for power production;
The survey conducted above estimates the total biomass available and also assesses the biomass consumed by various other consumers in the location. The total biomass production, their current consumption pattern and proportion of surplus biomass available, help estimate the amount of biomass that is available for power production.
Total Biomass available for Power Production
Determining biomass power production potential
The biomass based power production is determined by estimating biomass availability per kW hour and per annum.
Total biomass available for power production is equal to total quantity of biomass available minus total biomass consumed by various consumers in that region
The total biomass required for producing power:
a. Per kW per hour
Through the gasification route, 1.5 kg biomass is required to produce 1kWh power. Thus, 1.5 kg wood is used to produce 1unit of power.
b. Per annum
Taking the conversion factor of 1.5 ton per MW power per hour, annually 700 MT of biomass is required for producing per megawatt of power production.
Biomass required for power production
Annual biomass requirement = Biomass consumption/hr*Working hr/day) * days/yr) The above calculation is based on following assumptions:
The hours of running are decided by the load planned (or power demand) among the targeted population. A usual case for gasifier based system is 5 hrs loads. Running a small gasifier for 10 hrs a day is an optimistic scenario. Allgasifiers need maintenance once a week.
Practically, all biomass power plant are shut down for at least a month every year. Thus, assuming a biomass power operating for 350 days a year is again an optimistic scenario.
The underlying assumption in the above case is that biomass supply chain is in place for providing continuous supply of biomass to power plant.
c) Biomass Pricing:
The cost of biomass is calculated based on following parameters:
• Calorific value of biomass: If calorific value of biomass is high, he cost of
biomass is high.
• Availability of biomass: If the biomass is available in bulk throughout the
year, the cost of biomass is low. However, if biomass is affected by seasonality, the cost of biomass increases.
• Consumption pattern of biomass: If the biotic pressure in terms of
consumption on particular biomass is high, the cost of biomass increases
• Logistical cost of biomass: If the biomass is bulky, the following costs
Loading cost of biomass: Bulky biomass is heavy and thus the cost of loading and de-loading goes up
Transportation cost of biomass: It's more expensive to transport bulky biomass, as compared to the one that is less bulky
Types of Biomass Pricing
a. Biomass Pricing based on characterization of biomasses:
As discussed above, the biomass having high calorific value is bulky for transportation. On the other hand, loose chaffy biomass has high volume and is less bulky for transportation.
For example:
A normal trolley at a time carries about 3-6 MT of loose biomass, 10 MT of woody biomass and 8 – 12 MT of briquetted biomass.
b. Biomass Pricing defined based on availability of biomass in the value chain:
The pricing of biomass depends on the position of biomass in the value chain. For example:
Usually, biomasses having low calorific value are briquetted. Biomass briquetting reduces transport cost and cost associated with storage as well as storage losses.
The cost of briquetted biomass however is influenced by the position of biomass in the value chain. The biggest influence amongst these is the source of briquetting in the supply chain:
• External organization supplies briquetted biomass (usually more
expensive)
• In-house briquetted biomass is used (usually less expensive) c. Biomass Pricing based on scale:
The biomass pricing is also influenced by the scale at which biomass is used. For example:
A large scale of operation or power production demands huge quantity of biomass. Huge demand for biomass influences pricing of biomass in following ways:
• Huge demand of biomass sustain interest of biomass suppliers and
attracts new suppliers
• Huge demand helps in bargaining biomass pricing. This helps in keeping
biomass pricing under cap
Farmers in Punjab sellbiomasses at Rs. 2.50 per kg while the same agri-biomass is procured at Rs. 2.0 per kg by power plant owners.
Illustration of type of biomass pricing
These days most of the States offer a price between Rs 4.25 – 4.80 per kWh. This price slab fixes the purchase price of biomass. Farmers ask for Rs 2 – 2.5 per kg at their field. Thus, industries can afford to draw biomass from a region from where the transport cost (from farmer's field to power plant including loading) is at most Rs 1. All the areas from where the transport cost (to power plant) is less than Rs 1 per kg constitute the catchment for the power plant.
2.2.4 Consolidation of the findings and analysis:
The final step of the process is to develop a biomass management
plan/Strategy for the power plant. There are two inter-linked components to developing the plan:
• Development of a Resource Map
• Development of a Biomass Management Plan/Strategy
2.2.4. 1 Resource Map
The Resource map is a planning tool that helps in organizing logistics. This is a map of the area of study that helps in geographically juxtaposing the biomass resources (supply side) with the power consumers (demand side).
The map is developed using PRA techniques. Another mechanism of developing resource map is to take a copy of location map and mark land types, biomass resources, habitation, roads, community buildings and agricultural pumps on it.
2.2.4. 2 Biomass Management Plan / Strategy
The biomass management plan for a project location is a complete document detailing the present biomass scenario; potential supply of various biomasses as well as their consumption patterns, stress on different resources and the strategies to minimize the stress in the project location. The biomass management plan is based on both quantitative as well as qualitative data.
In the biomass management plan, the strategies primarily focus on increasing biomass production. In order to increase biomass production, following strategies may be implemented:
• Introduce improved grass and agriculture varieties for getting higher
productivity biomasses
• Improve agricultural production and area under agriculture especially in
waste lands
• Introduce or alter agro forestry systems
• Provide efficient power production technologies as well as machines for
soil improvement and irrigation supply channels.
• Streamline biomass supply for power plant keeping in account high biotic
pressure on existing resources
Thus, biomass planning is conducted, however constituents as well as biomass management strategies may differ. Thus, biomass plans may also differ.
Annexure I
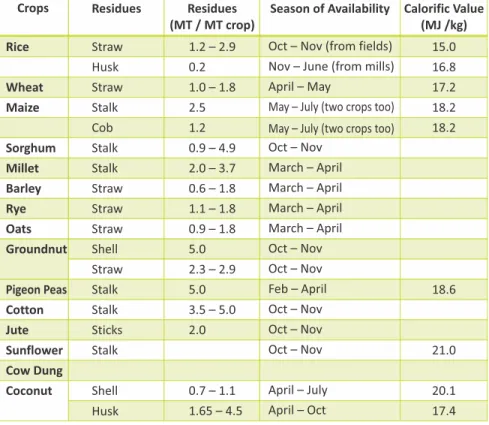
Different types of biomasses are available in different seasons. The calorific value of different types of biomass is also different. The efficiency of power production depends upon the calorific value biomass available.
The table below provides an overview of different type of biomasses available in different seasons. The table also indicates the calorific value of usually available biomasses. The table can be used for reference.
Crops Residues Residues (MT / MT crop)
Season of Availability Calorific Value (MJ /kg) Rice Straw 1.2 – 2.9 Oct – Nov (from fields) 15.0
Husk 0.2 Nov – June (from mills) 16.8
Wheat Straw 1.0 – 1.8 April – May 17.2
Maize Stalk 2.5 May – July (two crops too) 18.2 Cob 1.2
Sorghum Stalk 0.9 – 4.9 Oct – Nov
Millet Stalk 2.0 – 3.7 March – April
Barley Straw 0.6 – 1.8 March – April
Rye Straw 1.1 – 1.8 March – April
Oats Straw 0.9 – 1.8 March – April
May – July (two crops too) 18.2
Groundnut Shell 5.0 Oct – Nov Straw 2.3 – 2.9 Oct – Nov
Pigeon Peas Stalk 5.0 Feb – April
Cotton Stalk 3.5 – 5.0 Oct – Nov
Jute Sticks 2.0 Oct – Nov
Sunflower Stalk Oct – Nov
Cow Dung
Coconut Shell 0.7 – 1.1 April – July
18.6
21.0
20.1 Husk 1.65 – 4.5 April – Oct 17.4
Annexure II
Some ChallengesIt has been observed that biomass based power production is attractive to industries like sugar, rice, paper etc. Biomass based power production is an alternative for villages located in far flung areas or at the tail end of the grid. There are many examples available in the domain where promoters have found it far more difficult to promote biomass power production.
Some of the reasons for this situation are as follows:
• Difficulty in securing the long term supply of Biomass fuel at stable
prices.
• No biomass is available round the year. Influx, quality as well as price vary
with seasons. Biomass availability will also be influenced by other sources using biomass as an alternative for power production.
• Unfavorable selling price of electricity, if connected to the grid to sell
electricity.
• State grids offer less than Rs 5 per unit whereas National Grid may offer
anything above Rs 7 in different parts of a year. A new tariff policy may come in Dec 2012. Most of the biomass power producers are waiting for that policy. Several power producers have filed court cases against State govt. to increase power prices.
• Small sized biomass needs to be briquetted (increased cost of raw
material).
• Small decentralized power plants invariably have high overhead costs.
They need to use all local resources available in the vicinity. In order to use maximum local biomass, the power producer either has to use a multi fuel gasifier that is questionable, or make briquettes of the available biomass so that all may be used. However, briquetting process and safe drying are expensive processes. Such expensive methods of ensuring biomass supply for power production may burden small power plants by increasing the capital expenditure.
• Maintenance of the power plant in remote region can be difficult
and expensive.
• Decentralized power plants are often located in remote areas that have
poor connectivity to cities. Usually, well trained mechanics and spare parts are not available in remote locations. Also, expert mechanics hesitate in going to remote areas to fix a machine. So maintenance of decentralized plants is always expensive.
References
1. Abe, H., A. Katayama, B. P. Sah, T. Toriu, S. Samy, P. Pheach, M. A. Adams and P. F.
Grierson 2007, 'Potential for rural electrification based on biomass gasification in Cambodia', Biomass and Bioenergy, vol. 31, no. 9 (September 2007), pp 656–664.
2. CGPL 2006, Recent Developments in CGPL, ABETS News, CGPL, IISc, accessed on
11 Sp 2012,
3. web:
http://cgpl.iisc.ernet.in/site/Portals/0/Publications/Licensees-January2006 Volume1.0Version.pdf
4. GoI 2012, Energy Statistics 2012 (Nineteenth Edition), Central Statistics Office,
Ministry of Statistics and Programme Implementation, Government of India, New Delhi.
5. Kumar, A., K. Kumar, N. Kaushik, S. Sharma and S. Mishra 2010, 'Renewable
energy in India: Current status and future potentials', Renewable and
Sustainable Energy Reviews, vol. 14, no. 8, pp 2434–2442.
6. Patnaik, S. K. and A. Nambi 2011, 'Use of Agricultural Biomass in Competing
Value Chains – Malwa Power Plant, Mukstar District, Punjab', PISCES E-net, vol. 9 (July 2011), no. pp 6-9.
7. Planning Commission 2012, Power and Energy - Power and Energy Mix in
2007-08, Planning Comision, Govt. of Inida, New Delhi, accessed on Accessed on 12
Sep 2012,
web: http://planningcommission.nic.in/sectors/index.php?sectors=energy 8. Rentizelas, A. A., A. J. Tolis and I. P. Tatsiopoulos 2009, 'Logistics issues of
biomass: The storage problem and the multi-biomass supply chain', Renewable
and Sustainable Energy Reviews, vol. 13, no. 4, pp 887-894.
9. Shukla, P. R. 1997, Biomass Energy in India: Policies and Prospects, paper
presented at Biomass Energy: Key Issues and Priority Needs, organised at Paris during February 3-5, 1997 by, International Energy Agency (IEA), accessed on 12
Sep 2012,
web: http://www.decisioncraft.com/energy/papers/ecc/re/biomass/bpi.pdf 10. TERI 2012, Energy Map for India- Technology Vision 2030 - UNEP, Energy for
sustainable Development recommendations to Ministers from CSOs (UNEP), UNEP, New Delhi, accessed on 12 Sep 2012,
Climate Change and Development Chandragupta Marg, Chankayapuri New Delhi - 110021 Phone: +91 11 4995 9570 Email: [email protected] Website: www.swiss-cooperation.admin.ch/india