The Commonwealth Electric
Open Planning Project
Final Report
C. J. Andrews, S. R. Connors, D. L. Greenberg,
W. W. Schenler, R. D. Tabors, and D. C. White
THE COMMONWEALTH ELECTRIC
OPEN PLANNING PROJECT
The
Advisory Group
I
Communication with Constituencies in the Open
SDecision Environment
Discussion of Issues, Options, Uncertainties and
\Tradeoff
ResultsFINAL REPORT FOR PHASE ONE
JANUARY 1991
ANALYSIS GROUP FOR REGIONAL ELECTRICITY ALTERNATIVES
Dr. Clinton
J.
Andrews, Mr. Stephen R. Connors,Mr. Daniel L. Greenberg, Mr. Warren W. Schenler
Dr. Richard D. Tabors, Dr. David C. White
The Energy Laboratory, Massachusetts Institute of Technology
Table of Contents
Page No Title Page ... i T ab le o f C o n ten ts ... ... ... ii L ist o f F ig u res... ... iv List of Tables... ....Executive Summary ... ... ... .... .vli 1.0 Introduction ... - 1
1.1 Background ... ... 1-1.2 The Open Planning Process... - 3 1.3 Organization of the Report ... 1 - 5 2.0 Theory of Analytic Approach... ... 2 - 1 2.1 Advisory Group/Analysis Team Interactions ... 2- 1 2.2 Definition of Terms ... 2- 5 2.3 Analytic Methodology ... 2-8 3.0 Developing the Open Planning Process... ... 3 - 1
3.1 Identifying Issues, Uncertainties and Attributes ... 3- 1 3.2 Developing Scenarios... ... 3-3 3.3 Collecting & Checking Data... 3 - 9
3.4 Modeling Procedure and Software Tools... 3- 11
3.5 Statistical Analysis Techniques ... 3-21 3.7 Presentation and Elicitation Techniques... 3- 22
4.0 Applying the Open Planning Process... 4- 1
4.1 Organizing the Advisory Groups ... 4- 1
4.2 First Meetings ... 4- 6 4.3 Second Meetings ... 4- 14
4.4 Third Meetings... 4- 28
4.5 Efficacy of the COM/Elec Open Planning Project... 4- 41 5.0 Description of Final Scenarios ... 5 - 1
5.1 Scenario Name Definition ... ... 5- 1
5.2 Supply-Side Options ... 5 - 2 53 Supply-Side Option Technologies ... 5-9
5.4 Supply-Side Option-Sets ... ... 5- 13
5.5 Planning and Operation Supply-Side Options... 5 - 23 5.6 Demand-Side Options ... 5-24 5.7 Uncertainties ... 5-30 5.8 Other Inputs... 5 - 36
6.0 Presentation and Discussion of Results ... 6 - I
6.1 Identifying the Primary Attributes ... 6- 2 6.2 Attribute Variability and Reduction of the Data Set... 6 - 7 6.3 Single Attribute Trends Due to Uncertainties ... 6- 11 6.4 Single Attribute Trends Due to Option-Sets... 6- 22 6.5 Pairwise Multiple-Attribute Tradeoff Curves... 6- 32 7.0 C o n clu sio n s... 7 - 1
7.1 Single Attribute Uncertainty Conclusions... 7- 1 7.2 Single Attribute Option-Set Conclusions... 7- 2 7.3 Summary of Tradeoff Conclusions by Option-Sets... 7- 3 7.4 Comparisons with the New England Region ... 7- 13 7.5 Prim ary C onclusions ... 7 - 15 7.6 Possibilities for Future Analysis... 7- 19 Appendices
A. Participant List
B. Attribute Calculations/Info Sources
List of Figures
Figure 2.1 - Interaction and Analysis Procedure... - 2
Figure 2.2 - Scenario Construction ... ... ... 2 7
Figure 2.3 - Single Attribute Graph (Box Plot)... .... 2 I Figure 2.4 - Evaluating Tradeoffs ... ... 2- 13 Figure 2.5 - Uncertainty, Sensitivity, and Significance ... . 2- 14
Figure 2.6 - Robustness... ... ... 2- 15 Figure 2.7 - Tradeoff Objectives... 2 - 17 Figure 3.1 - Initial Strategies and Futures ... 3 -4 Figure 3.2 - Revised Strategies and Futures... ... 3 - 3 Figure 3.3 - Initial, Revised and Final Scenarios ... 3 -8 Figure 3.4a - The M odeling Process... 3 - 12
Figure 3.4b - The Modeling Process (Continued) ... 3 - 13 Figure 3.5 - PSP Algorithm Flowchart... 3- 16
Figure 4.1 - Overview of the COM/Electric Open Planning Project... 4- 5 Figure 4.2 - COM/Electric Sulfur Dioxide Emissions
for a Subset of Strategies ... 4- 23
Figure 4.3 - COM/Electric Factors Influencing
Sulfur Dioxide Emissions ... 4- 24 Figure 4.4 - COM/Electric 2nd Meeting Questionnaire ... 4- 27 Figure 4.5 - COM/Electric Total Cost of Electric
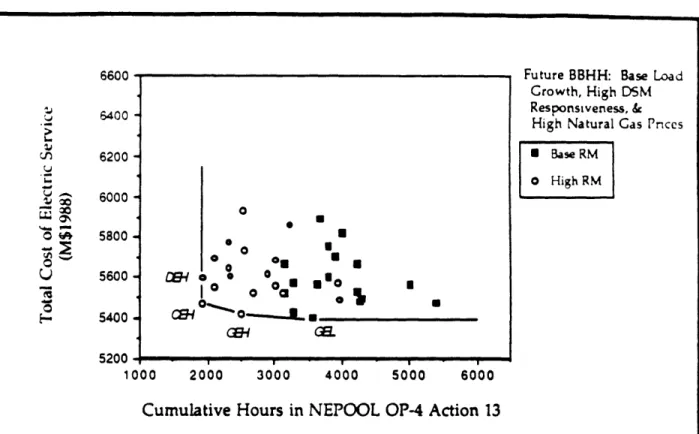
Service vs. S02 Em issions... 4-31 Figure 4.6 - COM/Electric Total Cost of Electric Service vs.
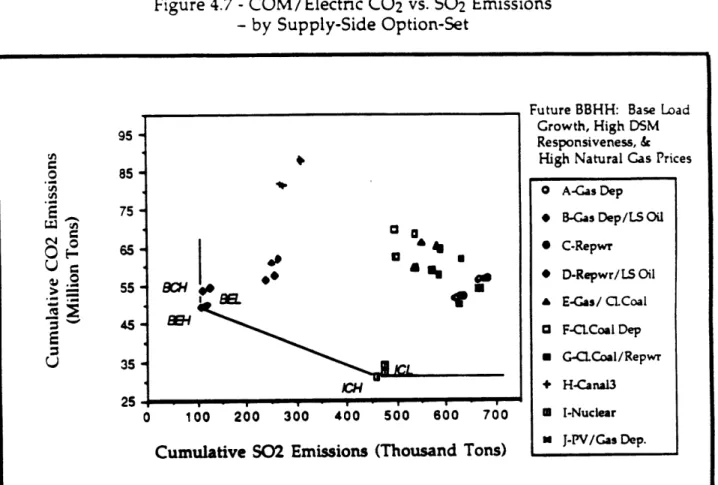
Reliance on Emergency Interruptions - by Reserve Margin ... 4- 33 Figure 4.7 - COM/Electric C02 vs. SO2 Emissions - by
Supply-Side Option-Set ... 4- 34
Figure 4.8 - COM/Electric Total Cost of Electric Service vs. S02
Emissions - by Supply-Side Option-Set fc Favorite, Best,
and Worst Futures ... ... 4- 35 Figure 4.9 - COM/Electric Total Cost of Electric Service vs. S02
Emissions - Migration across Favorite, Best, and Worst
Futures for Dominant Strategies... 4-36
Figure 5.1 - Run Naming Convention... 5-2 Figure 5.2 - COM/Elec Existing and Firm Capacity... 5 - 4 Figure 5.3 - COM/Elec Supply-Side Option Characteristics... 5- 8 Figure 5.4 - Combustion Turbine... 5 - 9 Figure 5.5 - Combined Cycle... 5 - 10 Figure 5.6 - Coal Gasification Combined Cycle ... 5 - 11
Figure 5.7 - Advanced Light Water Reactor ... 5- 12 Figure 5.8 - Photovoltaic Cells ... 5 -13
Figure 5.9 - COM/Elec Supply-Side Option-Sets... - 14 Figure 5.10 - COM/Elec Demand-Side Option Sets ... ... 5 - 253 Figure 5.11 - COM/ Elec DSM Option-Set Characteristics... 5- 26 Figure 5.12 - Peak Impacts of DSM Option-Sets...5 ... -27 Figure 5.13 - Energy Impacts of DSM Option-Sets ... 5- 27 Figure 5.14 - COM/Elec Load Growth Trajectories... 5- 31 Figure 5.15 - DRI High Fuel Price Forecast (/MMBtu) ... 5- 32 Figure 5.16 - DRI High Fuel Prices Forecast Relative to Oil 6... 5- 33 Figure 5.17 - MIT High Natural Gas Price Trajectory Relative to Oil... 5 - 34 Figure 5.18 - Fuel Prices Used in Model Scenarios... 5 - 33 Figure 5.19 - OP-4 Action Definitions and Capacities ... 5- 39 Figure 5.20 - OP-4 Action Level Capacities... 5 - 40 Figure 6.1 - Average Unit Cost of Service by Supply-Option Set
(Canal 3 Results Included) ... 6 - 9 Figure 6.2 - Average Unit Cost of Service by Supply-Option Set
(Canal 3 Results Excluded) ... 6 - 9 Figure 6.3 - Average Unit Cost of Service by Supply-Option Set
(Canal 3 Results Excluded) ... 6- 10 Figure 6.4 - Unit Cost of Service vs. Load Growth... 6- 12 Figure 6.5 - Unit Cost of Service vs. Fuel Price and
DSM Responsiveness... 6- 13
Figure 6.6 - SO2 Emissions vs. Load Growth... ... 6- 14
Figure 6.7 - SO2 Emissions vs. Fuel Price and DSM Responsiveness... 6- 15 Figure 6.8 - CO2 Emissions vs. Load Growth...6- 16 Figure 6.9 - CO2 Emissions vs. Fuel Price and DSM Responsiveness.. 6 - 17 Figure 6.10 - Cumulative Oil 6 Consumption vs. Load Growth... 6- 19 Figure 6.11 - Cumulative Oil 6 Consumption vs. Fuel Price &
DSM Responsiveness... 6-19 Figure 6.12 - Hours 5% Voltage Reduction vs. Load Growth... 6 - 20 Figure 6.13 - Hours 5% Voltage Reduction vs. Fuel Price &
DSM Responsiveness...
...
...
6 - 21
Figure 6.14 - Unit Cost of Service vs. Supply-Side Option-Set... 6 - 22 Figure 6.15 - Unit Cost of Service vs. DSM Option-Set,
Sulfur Content, & Reserve Margin... ... ... ... 6 - 24 Figure 6.16 - Total SO02 Emissions vs. Supply-Side Option-Set... 6- 25 Figure 6.17 - Total S02 Emissions vs. DSM Option-Set,
Sulfur Content, & Reserve Margin... 6- 26 Figure 6.18 - Total C02 Emissions vs. Supply-Side Option-Set... 6 - 27 Figure 6.19 - Total C02 Emissions vs. DSM Option-Set,
Sulfur Content, & Reserve Margin... 6- 29 Figure 6.20 - Total Hours 5% Voltage Reduction vs. DSM
Option-Set, Sulfur Content, & Reserve Margin... ... ... 6- 31 Figure 6.21 - Cost of Service vs. Rateshock
Figure 6.22 - Cost of Service vs. Total SO2 Emissions
(Best, Worst & Highest-Interest Futures; ... 6-37 Figure 6.23 - Cost of Service vs. Total SO02 Emissions
(H ighest-Interest Future) ... 6 - 38 Figure 6.24 - Cost of Service vs. Total S02 Emissions
(Highest-Interest Future)... ... ... 6 -39 Figure 6.25 - Cost of Service vs. Total C02 Emissions
(Best, Worst & Highest-Interest Futures) ... ... 6-41 Figure 6.26 - Cost of Service vs. Total CO2 Emissions
(H ighest-Interest Future)... .... ... 6 -42 Figure 6.27 - Total SO2 Emissions vs. Total C02 Emissions
(Highest-Interest Future)... ... ... ... 6 -44 Figure 6.28 - Cost of Service vs. Total Hours 5% Voltage Reduction
(H ighest-Interest Future)... . ... 6 -46 Figure 6.29 - Total Hours 5% Voltage Reduction vs. Average
Reserve Margin (Best, Worst & Highest-Interest Futures)... 6 - 48 Figure 7.1 - Cost of Service vs. Rateshock... 7- 10 Figure 7.2 - Cost of Service vs. Total SO2 Emissions ... 7- 11 Figure 7.3 - Cost of Service vs. Total C02 Emissions... 7- 12 Figure 7.4 - Cost of Service vs. Total Hours 5% Voltage Reduction ... 7- 13
List of Tables
Table 4.1 Table 4.2 Advisory Table 4.4 Table 4.5 Table 4.6 Table 4.7 Table 4.8 Table 4.9 Table 4.10 Table 4.11 Page No - Objectives... ... ... ... 4-3 - Slideshow Script for First COM/ElectricGroup Meetings ... . ... ... 4 -9 - Uncertainties... ... 4 - 12
- O ptions ... ... 4 - 1313... - Issues and Attributes for the COM/ Electric Project ... 4- 15
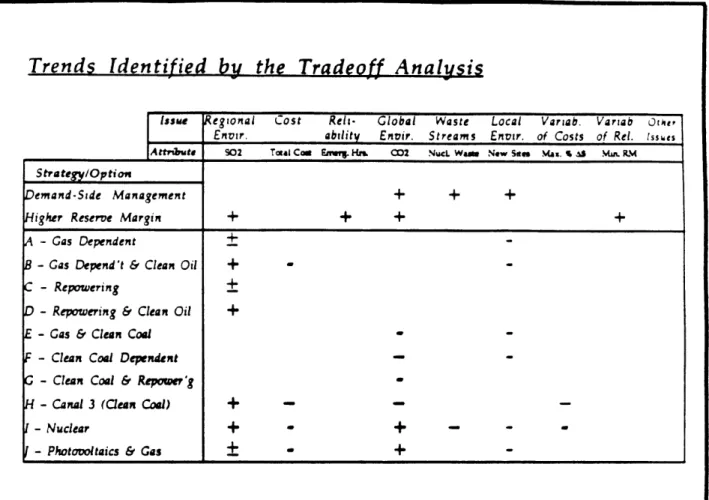
- Final Strategies and Futures ... 4 - I7 - Progression of Scenario Development... 4- 21 - COM/Electric Issue/Attribute Prioritization ... 4 - 28 - COM/Electric Uncertainty Prioritization... 4 - 29 - Trends Identified by the Tradeoff Analysis
in the COM/Electric Data Set... 4 - 38 Table 4.12 - Efficacy of Techniques as Applied on the
COM/ Electric Project ... 4 - 42
Table 6.1 - Correlations between Emissions... 6- 5
Table 6.2 - Correlation of Fuels Burned (in Btu's)
Executive Summary
The electric power planning process is complex, involving tradeoffs between many different options with many different impacts. Participants who do not agree on how to value these impacts have difficulty agreeing on their choice of options, which can, and sometimes has, led to regulatory deadlock. This report describes the development, application and results of an Open Planning Process performed by the M.I.T. Energy Laboratory's Analysis Group for Regional Electricity Alternatives (AGREA) for, and with the support and close cooperation of the Commonwealth Electric Company (COM/Elec).
Building consensus in this public policy debate requires rigorous development and analysis of the wide variety of options available, and more
importantly, clearly communicating the results of those analyses in a forum where participants in the electric power debate can communicate freely with each other. In order to meet these objectives, the M.I.T. and COM/Elec team has developed an Open Planning Process, involving both an advisory group and an analysis team. The advisory group is composed of the different stakeholders in the planning debate, including consumers, business customers, regulators, community activists, and environmentalists. The analysis team is composed of the M.I.T. analysis group, working in conjunction with COM/Elec personnel.
This Open Planning Process was developed for use in the power planning
debate for the entire New England region. This report describes its application to a single utility, Commonwealth Electric. This application is part of COM/Elec's
initiative to increase public and customer input into its decisionmaking, while
incorporating all supply and demand-side options, their interactions and non-price impacts, as will be necessary under the new regulatory process of "Integrated Resource Management."
The Open Planning Process as it was tested by this project was comprised of an iterative and interactive series of three meetings between four different consumer advisory groups and the analysis team. Once the advisory group was formed, the first meeting concentrated on those issues of concern to the advisory group, and how those concerns could be evaluated. The analysis team took these concerns and structured the technical analysis, forming options and uncertainties into scenarios
that were then modeled and analyzed. The second meeting presented the options
and uncertainties back to the advisory group for discussion and confirmation.
Following their comments, the analysis team took the revised scenarios, modeled
them, analyzed the results, and presented them back to the advisory group at the
third meeting. The advisory group then attempted to reach a consensus on what
type of options should be incorporated into COM/Elecs's long term strategy, based
on the system-wide interactions and tradeoffs involved. Based on the full or partial
consensus reached, COM/Elec can then structure its own response to Integrated
Resource Management process.
This Open Planning Process was developed through a series of meetings,
using an initial advisory group composed of COM/Elec personnel. Beginning in
June 1989, these meetings followed the general process described above, although
the development of the analytic techniques and the open planning process itself
required more than three meetings. Meanwhile the analysis team gathered data on
the COM/Elec system, modeled initial test scenarios, and constructed the automated
computer modeling tools necessary to perform the analysis.
A set of four external advisory groups was then formed of COM/Elec
customer "decision makers." These Consumer Advisory Groups corresponded to
the COM/Elec's Cambridge, Plymouth, New Bedford, and Cape Cod service districts.
A "cross section of leading citizens" were identified by COM/Elec's district service
representatives and requested to participate by a letter of invitation. Each of the four
--groups met for the series of three meetings and participated in the Open Planning Process steps outlined above. The first series of meetings took place the first two weeks in March, 1990 and identified four major areas of concern - environmental impacts, cost of service, reliability of service, and efficiency. The advisory groups reviewed the option-sets and uncertainties forming the scenarios at the second series of meetings in late April, and a set of preliminary results were shown to acquaint members with different methods of presentation and to check with
members on which measures, or attributes of the results best reflected their concerns on various issues. The final set of meetings took place in mid-May, where the
participants were presented with a full set of results and requested to reach a consensus given the options considered. Based on the results presented, an
additional set of scenarios were chosen. These were modeled in June and July, and are presented as part of this report.
The scenarios modeled were formed by combining different utility choices or options and different uncertainties about future events beyond utility control.
Supply and demand-side options were each combined into separate option-sets that represented reasonable possibilities of what COM/Elec could implement itself and with its customers. Supply and demand-side option-sets were then combined into strategies. Uncertainties were also divided into separate possibilities (e.g. low, base, and high load growth), and these uncertainties were then combined to form
different futures. Finally, strategies and futures were combined to form scenarios. Within this framework, the supply-side option-sets incorporated three major choices. First was the choice of technology mix (the blend of new technologies
COM/Elec can use to meet future demand). The analysis team modeled eight
different technology mixes, including different combinations of gas-fired, coal-fired,
repowering, nuclear, and photovoltaic technologies. Second was the choice of
the high sulfur Oil 6 currently burned in their plants. Third was the choice of supply-side planning; scheduling new capacity to meet a base target reserve margin of 23% vs. a higher target reserve margin of 30%.
The demand-side options were combined into two option-sets, the Collaborative process option-set (COM/Elec's current level of demand-side management programs), and an Enhanced Collaborative process option-set.
Futures were combined from three uncertainties; 1) low, medium and high load growth, 2) low, medium and high customer response to DSM programs, and 3) medium and high natural gas prices relative to base oil prices.
All possible combinations of these different strategies and futures gave a total
of 1152 scenarios which were modeled using the LMSTM production costing model. For each scenario, the analysis team calculated over sixty different attributes to use in measuring and understanding the four consumer advisory groups' concerns. Based on these concerns of environment, cost, reliability, and efficiency, a subset of primary attributes were designated to measure cost of service, rateshock, total sulfur dioxide and carbon dioxide emissions, and reliability.
Results for these scenarios told a number of stories. The predominant stories
are listed below for the major choices.
Technology Choice Option-Sets - The choices of technology mix, fuel, and reserve margin had major effects on cost, emissions and reliability.
However these impacts were mixed, with each choice having good and
bad effects for different environmental, cost, and reliability attributes. For this reason, no set of choices was a clear winner, but several
appeared most often as dominant choices for different attribute
tradeoffs. Repowering and Coal & Repowering did well for cost vs. S02
and cost vs. CO2, while the Nuclear & Gas dominated for S02 vs. CO2.
Photovoltaics and refueling the Canal plant with coal gas were inferior
* Demand-Side Option-Sets - The Enhanced Collaborative programs option-set
was a clear winner over the Collaborative programs option-set for both cost and emissions. Increasing Demand-Side Management measures was cleaner and cheaper for most futures, but movement in the results was small
compared to other options.
* Fuel Oil Sulfur Content - Requiring the use of low sulfur Oil 6 made a major and consistent reduction in SO02 emissions for all supply-side option-sets, and the reduction was cheaper than that by any choice of technology mix.
* Target Reserve Margin - Increasing the reserve margin yielded significantly higher reliability, whether from choice of higher target reserve margin, or from linkage to load growth or technology mix option-set. Cost for this benefit was relatively low, due to increased generation from newer, cleaner and more fuel efficient plants.
The analysis team draws the following conclusions about the Open Planning Process for the policy planning and technical analysis results.
As a public policy planning process, this project succeeded in its goals "to provide integrated resource planning assistance" and "to enhance planning
processes and develop a framework for useful public discussion of utility planning issues." The process developed was successful in e';dting participants' relative
concerns about major issues, generating significant new alternative options, and
receiving participant feedback. The modeling effort was successful in automating analysis so that meetings could be held on a reasonable schedule. Results in achieving consensus were mixed. Where clear winning options were revealed, consensus was possible, but where difficult tradeoffs existed, more time and possible
alternate strategies were needed. Despite sometimes limited attendance, the
enthusiasm, and a better understanding of the complexities and tradeoffs of the planning process.
The results of the technical analysis led to the following overall conclusions.
" There must be a balanced consideration between generation and end-use
efficiencies to obtain the most good from new capital expenditures.
Concentrating on either supply or demand options to extremes may reduce benefits.
* Analysis of new options must take into consideration their interactions with the existing system and with each other, rather than simply looking at their individual technology specific characteristics.
*. Systemwide analysis must be extended to strategies that contain specific
components related to system operation options. Choice of fuels and other
planning and operating policies can be as important as choice of new supply or
demand investment.
Both policy process and technical analysis results confirm the value of the
Open Planning Process in gathering concerns from the public and revealing back to
them how power planning options interact on a systemic basis with tradeoffs
between different attributes. The M.I.T. Analysis Group for Regional Electricity
Alternatives thanks Commonwealth Electric for the opportunity to work with them
in developing this Open Planning Process, and looks forward to the process being of
continuing service as COM/Elec seeks to meet the requirements of the Integrated
1.0 Introduction
The electric power planning process involves making choices among options that have significant cost, environmental, reliability, and other impacts.
Participants in. the electric power planning debate differ widely in the way that they value these impacts, and therefore differ in the choices they would make.
Discussions which have considered only a single issue such as cost or air emissions, or which have valued different issues with a common denominator, have had on!v a limited impact on electric power problems facing the region. To achieve the desired impacts, all participants must acquire a better understanding of the overall picture - an understanding of the relationships between the issues, and the tradeoffs implicit in the variety of options available to improve the way electric service is provided. It is important to look at the electric power system as a system, and to understand the interactions within the system. By understanding these
interactions, debate can focus on the best available set of options; options which are clear winners or which embody the best possible tradeoffs. This understanding can form the basis for consensus on positive action, not just for today's problems, but to avert future crises.
1.1 Bac
kpound
Consensus-building on technically complex electric power planning issues is
both an analytical and procedural challenge. It requires public explanation of the
performance of many options across a variety of uncertain future conditions using
Several years ago, a group of Massachusetts Irstitute of Technology faculty, staff, and graduate students offered to provide the analytic support for such an effort in order to help a deadlocked policy debate get back on track for the New England region as a whole. By early 1988, regulators, environmentalists, utility personnel, and electricity customers started meeting at MIT on a regular basis. Funding from a consortium of regional utilities and industrial customers allowed the group to expand its analytic capabilities, and by 1989 every state in the region was represented on the advisory group for the New England project.
On December 8, 1988, one of the officers of the Commonwealth Electric Company (COM/Elec) attended our presentation to the NEPOOL Policy
Planning Committee of the New England Project's first round of regional tradeoff analysis. The following month, Mr. Donald LeBlanc (Vice President, Resource Planning and Development) asked the MIT Energy Lab to help develop an analytic capability at COM/Electric similar to that being developed for the entire region.
This request was motivated by several things. First, COM/Electric had been ordered by the Massachusetts Energy Facilities Siting Council (EFSC Decision No. 86-4) to improve its resource planning method so that (among other things) it would in the future: (1) include demand-side programs using a "level playing field," (2) plan more thoroughly for contingencies; (3)
compare a larger range of generation and non-generation alternatives; and (4) model supply plans in a more plausible manner.
Second, the Massachusetts Department of Public Utilities had issued an
Order (DPU 86-36-F) on November 30, 1988 that paved the way towards
requiring utilities to use an "all resource solicitation" process within an
"integrated resource management" framework, for future resource plans (see discussion of this order in Chapter Five). Two major implications of this
order were the need to account for environmental externalities in the planning process, and the need to better integrate demand-side and supply-side planning. The Department was casting around for ideas about the best way to include something as subjective as environmental externality' evaluation in a rigorous, reviewable planning framework.
In January 1989 COM/ Electric contracted with MIT to provide "integrated resource planning assistance" in order to "enhance their planning processes and develop a framework for useful public discussion of utility planning issues". Specific tasks included reviewing current planning methods, expanding the company's ability to function in open planning processes, developing their multi-attribute tradeoff analysis capabilities, performing public education on utility
planning issues, and exploring issues relating to the interactions between the utility and the region.
1.2 The Open Planning Process
The process developed for both the New England project and the
Commonwealth Electric project involves the iterative interaction of an analysis
team and an advisory group. The advisory group indicates its concerns in the electric planning process. These concerns may be either issues that can be addressed
by the choice of various options, or uncertainties about the future which cannot be
controlled. Options and uncertainties are defined and combined into scenarios by the analysis team. The data to model these scenarios is then collected and checked, and the software chosen, developed, and integrated to automate the modeling
process. The results of the scenario analysis are evaluated statistically and then
between various issues when evaluating different strategies, and to elicit their
preferences on current or improved strategies which should also be considered in the analysis.
For the Commonwealth Electric project, the analysis team was composed of the MIT Energy Lab's Analysis Group for Regional Electricity Alternatives (AGREA), and staff of Commonwealth Electric's planning department. An initial "internal" advisory group was formed, consisting of Commonwealth Electric staff from several departments. Regular meetings with the internal advisory group provided feedback about COM/Elec's concerns, the choice of test scenarios, interim results, and the methods developed to present results and elicit opinions from an "external" advisory group.
The process developed for interacting with an advisory group and performing scenario analysis was then employed to bring some of COM/Elec's customers into
the planning process, using four external, consumer advisory groups (CAGs). These groups were composed of community activists and decision makers representing
the broad range of interests from COM/Elec's four service territories. Through a series of three meetings these consumer groups were asked to express their
concerns, to confirm that the scenarios chosen by the analysis team reflected these concerns, and to attempt to reach a consensus based on the tradeoffs and other
information presented in the 720 scenarios analyzed in response to their input. Based in part on consumer input, COM/Electric may then select a strategy
(i.e., a specific portfolio of options) to pursue. COM/Elec could then incorporate the consumer advisory groups' preferences into their third party bids to implement specific options, rank proposals, test to see that actual award group projects formed a
similarly attractive portfolio as its generic precursor (considering multiple attributes
1.3 Organization of the Report
This report presents the methodology and results of the Commonwealth Electric Open Planning Project, and is divided into two main sections. Chapters 2 through 4 present the theory, development, and application of the methodology. Chapters 5 through 7 describe the final set of scenarios analyzed, present the results, and give the conclusions of the report, based on the analysis and experiences with the consumer advisory groups. Appendices A through D present the details of the consumer advisory group participants, the attributes calculated, the LMSTM model inputs and assumptions, and the graphical results.
2.0 Theory of Analytic Apprnach
This chapter describes the approach used by the MIT Analysis Team to
interact with the advisory groups and perform scenario analysis in the COM/Electric Open Planning Project. First described is the general method of interaction between the Analysis Team (MIT) and the Advisory Groups (first with the COM/Elec
internal advisory group and later with the external consumer advisory groups). Next, the terms used to describe the open planning process are defined - in the order used - as the planning process is followed. Finally, the methods of analyzing,
understanding and presenting the results are discussed.
2.1 Advisory Group/Analysis Team Interactions
The interactions between the consumer advisory groups and the MIT analysis team were set up in the form of a public public policy analysis exercise. The diverse concerns of participants in the exercise (the advisory group) were channeled into analyzable form by the MIT analysis team and results were then presented back to the advisory group for further consideration. This interactive, iterative approach was intended to reduce the "black box" nature of the analysis work, and to build the
advisory groups' confidence in the results. It was also designed to tap the creativity of the advisory group members, in order to invent better options than those
currently on the table. Figure 2.1 below shows this Analysis Team/Advisory Group
Figure 2.1 - Interaction and Analysis Procedure
The Advisory Group
ICommunication with Constituencies in the Open
' Decision Environment
Discussion of Issues, Options, Uncertaintres and
Tradeoff Results
Results and
Team
Tradeoffs
1) Identify Issues and Attributes
2) Develop & Analyze Scenarios
3) Understand Tradeoffs & Elicit Consensus
The objective of the group's first meeting with the MIT analysis team was to
identify the issues of concern to the various advisory group members, and the
attributes by which these concerns may be measured. These were formulated by the
analysis team into specific option-sets of actions available to Commonwealth
Electric (strategies) and specific sets of uncertainties which mapped out relevant futures of concern. Individual supply-side and demand-side management (DSM) options were solicited from the advisory group as part of the first meeting, but due to their technical knowledge it was the responsibility of the analysis team toconstruct realistic strategies which addressed the issues important to the advisory group.
These strategies and futures were then presented back to the advisory group to make sure that they accurately reflected their concerns. Appropriate changes were then made, and the strategies and futures were combined into scenarios for analysis
by computer. The results of these runs were then reviewed by the analysis team to
make sure that they were reasonable and consistent before interpretation of the underlying stories began. These results were then presented to the advisory group
in a variety of formats, so that the tradeoffs could be clearly presented and the stories explaining them supported. With this knowledge the advisory group could then attempt to reach a consensus on which strategies produced the most acceptable and robust results in response to their concerns.
Both the advisory groups and the analysis team had certain roles to play within the framework. The responsibilities of the advisory group members in this process were to:
* Identify issues and concerns
* Accept or reject modeling approaches and assumptions
* Express the concerns of their constituencies in discussions about the tradeoffs among options
* Work creatively towards a consensus on the choice of favored sets of
The responsibilities of the analysis team in this process were to:
* Assemble data and models* Construct scenarios
* Articulate assumptions, methods, and results clearly (minimize black
box modeling)
* Respond to the interests, queries, and proposals of advisory group members
Assist the advisory groups in inventing better options and packaging them into coordinated strategies
Assist the advisory group in moving towards a shared understanding of problems, options and system interactions.
The interactions between the advisory groups and the analysis team were structured so that three steps carry them through a full iteration of the process. These steps are listed below, with step three described in detail in Section 2.3.
I. Identify issues to focus the analysis upon, and attributes by which to
compare the performance of different strategies.
2. Develop scenarios examining the performance of combinations of options (strategies) across a variety of uncertain future events (futures). Learn about their behavior in the context of a complex electric power system, and test the credibility of the anLalysis by sharing interim results.
3. Explore the tradeoffs between strategies, given the uncertainty about the future, and the multiple-attribute impacts of each strategy as revealed by the analysis, and understand preferences of different
2.2 Definition of Terms
Even the brief description above has used a handful of terms that have specific meanings in the context of the open planning process. These terms are defined here so that their consistent use will clearly understood.
Concerns - Any concern which a member of the advisory group has about an aspect of the electrical utility planning and operation problem. Concerns which reflect desired goals in operation are referred to as issues. Concerns over uncontrollable events such as changes in fuel prices or the customer response to company sponsored DSM programs are referred to as
uncertainties.
Issues - An issue is any concern about the utility planning problem which can be controlled by a choice or decision in the plan. For example, cost, emissions, and reliability of service are all issues which are influenced by planning
decisions. Issues may be influenced by factors which cannot be controlled, called Uncertainties (defined below).
Attributes - An attribute is some measure by which performance relative to some issue can be determined. For example, air pollution is an issue which can be measured by attributes such as tons of sulfur dioxide (SO2) or carbon dioxide (CO2) emitted over time. The choice of attributes to measure various issues is an important task. The issue of cost can be measured by total dollars spent to provide electrical service over the study period, by the discounted present value of those dollars, by the cost per kWh paid by the consumer, or bysome cost of service which accounts for energy services provided by utility DSM measures as well. In addition, volatility of cost may also be an
important factor. The way an issue is resolved is, in part, determined by the way the problem is defined and measured.
Uncertainties - An uncertainty is a specific concern about the future which cannot be controlled. For example, electrical load growth is an uncertainty which depends on economic growth, and which cannot be accurately
predicted. Uncertainties are analyzed by choosing several values (e.g. low,
base, or high load growth), and modeling utility plans for all of them.
Futures - A future is defined as some combination of uncertainties. For example, a specific future may be composed of high load growth, high fuel prices, and poor public response to DSM measures. The number of futures is given by all possible combinations of the uncertainties (e.g. 3 load growths x 3 fuel prices = 9 futures).
Options - An option is a specific action which the utility can choose to take. For example, building combustion turbines or subsidizing household weatherization are both options.
Option-Sets - Because there are a very large number of possible options, they are combined into programs of combined options called option-sets. These are generally divided into supply-side option-sets (such as a mix of new gas and coal generation technologies) and demand-side option-sets (which combine different DSM programs like appliance standards, new building standards, etc.).
Strategies - Option-sets are combined into strategies, as uncertainties are combined into futures. The number of strategies is determined by all the possible combinations the individual sets (e.g. 10 supply-side option-sets x 2 demand-side option-option-sets = 20 strategies).
Scenarios - Strategies and futures are then combined into scenarios.
However, the number of scenarios may not be simply the number of
strategies multiplied by the number of futures. In some instances,
combinations of strategies and futures may be meaningless (for example, a strategy without any DSM programs could not be combined with a DSM
program cost overrun uncertainty).
This process of combining individual uncertainties and options into
diagram omits the intermediate step of forming option-sets from options before combining them into strategies.
The number of computer model runs which must be performed is generally determined by the number of scenarios, although some calculations (usually
financial) may be done afterwards. This means that the choice of option-sets and uncertainties must balance the number of possible future plans which can be analyzed against the time the analysis team has to evaluate them. Increasing supply-side option-sets from 10 to 12 will increase model runs by 20% while introducing a new uncertainty will double the runs required.
2.3 Analytic Methodology
Once model runs are complete and the data base of input and output results has been assembled, the task of understanding these results still remains. The multiple-attribute results of the scenario analysis must be systematically evaluated in a way that provides useful information to the participants in the open planning process. It is the task of the analysis team to understand and present both the results of the analysis and the underlying stories/explanations contained in those results, in a form that is both conceptually and graphically comprehensible to the advisory group. This analysis has three primary goals in informing the advisory group; 1) to
develop in them a shared understanding of the tradeoffs involved in different choices, 2) to help them invent better strategies than are currently on the table, and
3) to seek their informed consensus on a course of action.
There are two major steps in the tradeoff analysis effort:
1) Explore system behavior by observing the the impacts of uncertainties, the single attribute impacts of different option-sets and strategies, and the multi-attribute tradeoffs between strategies, for a variety of possible
uncertain future conditions. Develop better strategies based on this
information.
2) Elicit participants' preferences by observing which strategies interest each party, what uncertainties concern them, and how they weigh the various attributes relative to one another. Develop strategies with the potential for consensus based on this information.
Both of these steps are explored below, although there is more emphasis is on the first step of building analytical understanding which must underlie the
presentation, and less on the preference elicitation and consensus building process which follows.
Exploring System Behavior.
In general, the scenario analysis process produces such an overwhelming number of results that they must be interpreted using a relatively powerful statistical software package (such as Systat"', which we used, or SAS).
Understanding the graphs produced by such packages can be aided by asking a structured series of questions.
1) Single Attribute Analysis. The first step is to graph single attributes as they vary by both 1) uncertainty, and 2) option-set. These may be either
individual uncertainties or option-sets (e.g. by load growth or reserve margin), or combined uncertainties or options-sets (these may be fewer than a complete future or strategy). These graphs show the attributes'
absolute and relative magnitudes and their variability. The following
questions should be asked.
a) Over what range do the attributes vary? b) How relevant are the different uncertainties? c) How different are the various futures?
d) How consistent is the performance of each option-set across various possible futures? e) How consistent is the performance of each strategy across various possible futures?
f) How sensitive are particular strategies to individual futures? g) How do individual options perform along various attributes?
h) How does each option-set perform along various attributes? i) How does each strategy perform along various attributes?
In general, the process is one of discovering trends and explaining variability. Do these trends vary in the direction you expect? Are the
trends consistent for comparable option-sets, or across different futures? Do the trends reverse, or are there exceptions in some cases? Do the trends established by single option-sets or uncertainties show up
consistently when you look at a combined future or strategy? What is the relative size of various trends (especially competing or reversing ones)? Can variability be explained? For example, are variations in emissions explained by relative changes in fuel prices, or consistently low for nuclear supply options? Figure 2.3 gives an example of the statistical output in the graphical form called a box plot, along with its interpretation.
In the process of developing stories which explain these results, it may be useful to look at the correlation coefficients for different attributes and scenario characteristics. Although correlation does not necessarily imply causality, a strong correlation (e.g. high S02 emissions are highly correlated with high sulfur Oil 6 consumption) may help explain how the system behaves.
Figure 2.3 below shows a sample single attribute graph for total S02 emissions versus load growth. This graph is a called a box plot, and the different statistics it shows are labeled with arrows. This information can also be shown with column charts or other forms of graphs that show
Figure 2.3 -Single Attr.bute 3raph (Box Plot) Quartile Limit + 800 1. * I[nterquartile Range (Fence) 600 • Quartile Limit 40 0 . . (Hinge) Median Value 200 a %95% Confidence 0 Interval Limit
Low Base High (Notch)
Load Growth Outlier
The central line on each notch shows the median value of the distribution (half the values are above the median and half below).
The end of each box is the quartile limit (or hinge). For the upper quartile one quarter of all values are above this line and three quarters below, and vice versa for the lower quartile limit.
The notch on each box shows the 95% confidence interval limit. If the notches on two boxes do not overlap, then the probability is 95% that the median values are different. For example, the low and base notches overlap so the median values shown have less than a 95% chance of being different, but the low and high notches do not overlap and therefore the median values are significantly different with over a 95% confidence.
The outer limit bar (or fence) is given by the most extreme value within the range between the upper (or lower) quartile limit and that quartile limit plus (or minus) one and a half times the interquartile range. That is, the value of the upper fence equals the maximum value between the upper hinge value and that value plus one and a half times the difference between the upper and lower hinge values.
If there are values in the distribution beyond the fences, they are called outliers and shown with asterisks or stars. The outlier shown above was not in the real results, but added for the purpose of showing an
2) Multi-Attribute Analysis. Due to cognitive limitations, it is only possible to examine the tradeoffs between three attributes (in three dimensions) at a time, and graphic presentation usually limits this to tradeoffs between two attributes simultaneously. Thus, multiple attribute analysis is normally performed as a succession of pairwise tradeoffs between numerous attributes. The task of evaluating strategies using multi-attribute analysis can be structured by following the steps below.
a) Observe the performance of strategies -considering multiple attnbutes.
i. How does each strategy perform for different attribute pairings? ii. How consistent is the performance of each strategy across various
possible futures?
iii. How does each strategy perform considering all attributes?
b) Observe the performance of the system.
i. Do different attributes correlate with one another? ii. Do some attributes explain others?
c) Invent better strategies and explore more relevant uncertainties.
i. Based on what we have learned about the system's behavior, which additional strategies need to be evaluated?
ii. Are there other uncertainties to consider?
Repeat the steps above if necessary_...
Several concepts related to multi-attribute tradeoff analysis need to
be discussed and illustrated. The first and most important is the concept of
dominance. A strategy is said to dominate another if it is better or equal in
every regard or for every attribute. All strategies which are dominated by
some other strategy are members of the dominated set, and all strategies
These definitions are illustrated by Figure 2.4 below. Strategies 'b' and 'c' dominate 'd' but not each other for the two attributes shown. Strategy 'a' does not dominate 'd' and is not itself dominated by any other strategy shown. Because the dominated set contains strategies which are clearly worse in every way than at least one other, the strategies which form the decision set are the only ones which are worth arguing about.
Figure 2.4 - Evaluating Tradeoffs
Evaluating Tradeoffs...
This discussion assumes that the value of each attribute is exactly known for each strategy. However, these values may not be exact due to sources of error like uncertainty in modeling assumptions. This raises the concepts of uncertainty, sensitivity, and significance as they relate to
The graph on the left shows each strategy as a single point in multi-attribute space, with all three points forming a decision set in the form of a tradeoff knee. The graph on the right shows how dominance works under uncertainty - there is a range surrounding each point representing the uncertainty in its coordinate values. Thus, while strategy 'f' significantly dominates 'h', it does not significantly dominate 'g' because 'g' lies within the range of uncertainty. Different parties' sensitivities to changes in attribute values could lead to the same effect - the difference between strategies 'f and 'g' may be functionally irrelevant to some parties - again making the difference insignificant.
Figure 2.5 - Uncertainty, Sensitivity, and Significance
The tradeoff curves shown above are all for a single future which is
considered fixed or certain. In the open planning process, each strategy is modeled for many different futures. This leads to the important concept of robustness. A robust strategy is one that performs well under a range of futures. Under a single attribute analysis, this may be seen where a strategy has a good value for some attribute and a low variance across the range of futures. Under a multi-attribute analysis, a robust strategy will be one that is consistently on or near the tradeoff
curve. Robustness is illustrated in Figure 2.6 below. In this example only strategy 'c' is considered robust, as both 'a' and 'b' moved well away from the tradeoff curve in at least one future.
Figure 2.6 - Robustness
Robustness
aIFuture B
Future A
0 0 0 0 0 0 b 0 aoC 0Better Environmental Quality Better Environmental Quality
0 0 0 O 0 0
a
0 0 0Robustness is closely related to the questions of how probable different futures are, and to how risk averse stakeholders are to bad results. In the current analysis, both these issues have been set aside. Futures were initially assumed to be equally likely in the evaluation of average results. For tradeoff analysis, performance was examined for the range of futures by looking at three different futures. The best and worst futures were those that consistently had the lowest and highest cost, emissions, reliability, etc.. A questionaire was used to determine advisory group preferences for the future of highest interest, or greatest concern
(hereafter called the "highest-interest" future).
In analyzing tradeoff curves, the analysis team and the advisory group have two different goals, as shown in Figure 2.7. The analysis team has the responsibility to create appropriate scenarios and identify the resulting tradeoffs to the advisory groups. The left hand graph shows this
identification of strategies comprising the decision set. The advisory group then has the responsibility to add normative decisions regarding equity and other subjective issues to the facts presented. The right hand
graph shows how the advisory group may shift back and forth along the decision set to form a consensus on the strategy which best balances their concrns.
Figure 2.7 -Tradeoff Objectives
Tradeoff Obiectives
Eliciting Participants' Preferences
In order to guide this process of (hopefully) reaching consensus, the analysis team guides the advisory group by presenting the trends and tradeoffs, and then eliciting their preferences. This process is guided by the steps outlined below.
While only the advisory group can bring their own, varying positions to this task, it is helpful if the analysis team fully understands the dominant strategies and how robust they are, in order to inform and guide the discussion.
a) Sort through the strategies - slowly adding decision guiding rules.
i. Which strategies are dominated by others across all attributes and futures? ii. Assuming no risk aversion and equally likely futures, how do participants
rank the strategies, based on their tradeoffs?
iii. Assigning different weights to different attributes, how does the ranking change?
iv. Assigning different probabilities to different futures, how does the ranking change?
v. Adding the assumption of risk-aversion, how does the ranking change?
b) Elicit stakeholder values.
i. How do different parties pnontize attributes, rank the likelihoods of vanous futures, view different strategies?
c) U'ndcrtake conflict analysis.
i. What are different parties willing to trade? i i. Where are the gaps and overlaps?
iii. What are the characteristics of the most widely favored strategies?
d) Invent better strategies.
i. Are there new packages of options that have more of the characteristics everyone prefers?
i i. What new strategies have the potential for consensus?
Repeat steps above if necessary...
e) Seek consensus on a preferred strategy.
This tradeoff analysis approach allows the advisory group members to explore
r
the relative performance of different strategies without initially attaching dollar
values to such intangible or hard to quantify - on a cost basis - items as pollution
impacts. Unlike cost-benefit analysis, which requires such social costs to be valued
in dollar terms, tradeoff analysis keeps attributes in their original units (e.g. tons of
SO2). This allows parties with very different perspectives to evaluate the relative
characteristics of the proposed strategies. By the time that parties get down to hard
bargaining on the relative importance of electricity costs, environmental impacts,
and reliability levels, they will be choosing among a much better group of strategies.
These strategies are included in the decision sets by virtue of their physical
performance, and not by an implicit or unquantifiable impact/cost calculation. The
parties are also more likely, having gone through the analysis as a group, to have a
better understanding of the relative importance of each issue in the big, overall
picture.
3.0 Developing the Open Planning Process
This chapter takes the group process and analysis theory, and describes how the open planning process was developed through interactions with COM/Elec's internal advisory group, prior to use with the external consumer advisory groups. This development included finding out COM/Elec's goals and concerns for the open planning process, identifying issues and attributes, and developing scenarios to test the process. The more technical workperformed at this stage included collecting and checking data, developing the computer tools, and automating and integrating the computer modeling procedure. Both process development and technical work proceeded concurrently during the project, punctuated by internal advisory group meetings, and came together in the development of graphical presentation techniques to show the scenario results and tradeoffs to the internal advisory group.
3.1 Identifying Issues, Uncertainties and Attributes
The process of developing trial issues, uncertainties and attributes began at the first meeting of the internal advisory group on June 27, 1989. A
wide set of issues, attributes, uncertainties and options (divided into utility, consumer, and societal areas) were shown on viewgraphs to facilitate
discussion, and then distributed in the form of a questionnaire. This was returned by mail following the meeting, and used as a basis for discussion during the next meeting on July 25, 1989. From the results of the
questionnaire, the following overlapping issues and uncertainties were
selected as predominant, although not exhaustive;
Predominant Issues
*
Cost of Electricity (includes marginal costs, etc.)*
Environmental AirQuality
(emissions, regulations, etc.)* Quality/ Reliability of Electricity
* Fuel Availability and Fuel Use Flexibility
*
DSM Potential/Impacts (real vs. expected costs, savings, etc.)*
Regulatory Environment (externalities, siting, regulatedcompetition, treatment of investments, etc.)
* Availability/ Ability to Use New Technologies (technology advances, lead times, technology regulation, etc.)
Predominant Uncertainties
*
Changes in Fuel Prices and Availability* Changing Environmental Regulations
* Changes in Peak Demand and Energy
* Interactions between DSM Efforts and Third-Party Generation
* Technology Cost and Availability
* DSM Impacts and Implementability
Although the first meeting included a list of sample attributes, the
second meeting did not focus on the actual choice of attributes. They were
developed during the course of subsequent advisory group presentations and
meeting discusions. Examples of such attributes or measures include
Averagw.Unit Cost of Electric Service (to measure both the supply-side and
demand-side electrical service provided), a rate shock measure (the
maximum percentage change in the unit cost of service), and supply,
demand, -. I total system efficiency measures. In all, over 50 attributes were
calculated for each scenario (see Appendix B for a complete list of these
attributes and the methods of their calculation).
3.2 Developing Scenarios
The issues and uncertainties raised in the first advisory group meetings were translated into analyzable form by defining scenarios. As briefly
described in Section 2.2 above, supply and demand options available to
COM/Elec are combined into separate option-sets. These option-sets are then combined into strategies. Likewise, uncertainties are combined into futures (each one a possible combination of events), and strategies and futures are combined into Scenarios.
Following the first internal advisory group meeting on June 27, three initial supply-side option-sets were proposed at the July 25 meeting, as shown in Figure 3.1. An initial choice was also made of four demand-side option-sets (No further DSM, the present Collaborative process, an Extended Collaborative process, and the Technical Potential DSM limiting case). The predominant uncertainties were also codified into an initial set of six uncertainties, which are also shown in Figure 3.1.
Figure 3.1 - Initial Strategies and Futures
Strategies
Qptzoons are combined 1t o Option Sets
u ich arte I tUrw
combaned into Strategsu.
Demand-Side Option Sets
Collaborative Progams
xtendd Collaborative rograms
ecnical Potential
No Further DSM
Supply-Side Option Sets
Utility Gas NUG Gas Coal and
Technology Options Dependent Dependent+ Cogeneration
(New Capacity) (%-New MW) (%-New 'MW) (%-New MW)
Combuon Turbue 0 40% 20%
-Combined Cycle 100 60% 30% 20%
Cogener m n 30 - 30%
ICCC 20 - - %
. . . . . . . . . . . . . . . . . . . . . . .. . . . . .
CLomtnMed Stratetfes (kev)
CU CN C
TU E N E C
:7
T
TNU NN I NC
t Note: NUG a Non-Utility Generation
Futnctat re cbid fiet
Uncertantis ame ombiam ijnto flaw"
Load KeyLoed Growk
L Low
B Base
H High
D M Key Demata.aSid Pogm Deta S On Schedule D P Dey
E
s
U Fuel Prices L Low B Base H HighDSM Key Dema.d-Side Progam Costs
L On Budget
H Cost Overrun
'V outate
H 20% of Contracted MW H 60% of Contracted MW
These initial strategies and futures were revised following the second
meeting, and an exchange of correspondence and phone calls. The revised set of
options and uncertainties is shown below in Figure 3.2.
_ :* __ _~__ __ _~_
-
--Figure 3.2 - Revised Strategies and Futures
Futures
Uncertemta are ombined into future
Load KeyLo id Growth
L Low B Base H High
IOn
Schedule D Progmm Delay H C OvermmnNoew All model t as dm wh se o n bud~t. Cc
uel Key Fuel Prices
L Low
B Base
H High
S On Schedule
D Progam Delay
SS Ke ISVPP i Pror a am Costs
H KO Overrun
Sovmrrns ean be aliculam a swhity analysis without ta rums.