HAL Id: hal-02089747
https://hal.sorbonne-universite.fr/hal-02089747
Submitted on 4 Apr 2019HAL is a multi-disciplinary open access
archive for the deposit and dissemination of sci-entific research documents, whether they are pub-lished or not. The documents may come from teaching and research institutions in France or abroad, or from public or private research centers.
L’archive ouverte pluridisciplinaire HAL, est destinée au dépôt et à la diffusion de documents scientifiques de niveau recherche, publiés ou non, émanant des établissements d’enseignement et de recherche français ou étrangers, des laboratoires publics ou privés.
On the corrosion mechanism of Mg investigated by
electrochemical impedance spectroscopy
Maurilio Pereira Gomes, Isolda Costa, Nadine Pébère, Jesualdo Rossi,
Bernard Tribollet, Vincent Vivier
To cite this version:
Maurilio Pereira Gomes, Isolda Costa, Nadine Pébère, Jesualdo Rossi, Bernard Tribollet, et al.. On the corrosion mechanism of Mg investigated by electrochemical impedance spectroscopy. Electrochimica Acta, Elsevier, 2019, 306, pp.61-70. �10.1016/j.electacta.2019.03.080�. �hal-02089747�
On the corrosion mechanism of Mg investigated by
electrochemical impedance spectroscopy
Maurilio Pereira Gomes,
a,bIsolda Costa,
bNadine Pébère,
cJesualdo Luiz
Rossi,
bBernard Tribollet,
aVincent Vivier
a(a)
Sorbonne Université, CNRS, Laboratoire Interfaces et Systèmes Electrochimiques,
LISE, F-75005 Paris, France
(b)
Instituto de Pesquisas Energéticas e Nucleares, Centro de Ciência e Tecnologia de
Materiais, Av. Prof. Lineu Prestes, 2242, Cidade Universitária, CEP 05508-000 São
Paulo SP, Brasil
(c)
CIRIMAT, Université de Toulouse, CNRS, INPT, UPS, ENSIACET, 4, allée Emile
Monso, BP 44362, 31030 Toulouse cedex 4, France
Abstract
This work reported a detailed analysis of the electrochemical impedance spectra obtained for the Mg electrode during immersion in a sodium sulfate solution. A model was proposed which took into account the presence of: (i) a thin oxide film (MgO) which progressively covered the Mg electrode surface, (ii) film-free areas where the Mg dissolution occurs in two consecutive steps, (iii) a thick layer of corrosion products (Mg(OH)2), (iv) an adsorbed
intermediate Mg#$%& which is responsible for the chemical reaction allowing the negative
difference effect to be explained. From the impedance data analysis, various parameters were extracted such as the thin oxide film thickness, the resistivity at the metal/oxide film interface and at the oxide film/electrolyte interface, the active surface area as a function of the exposure time to the electrolyte, the thickness of the thick Mg(OH)2 layer and the kinetic
constants of the electrochemical reaction.
Keywords: Magnesium; Oxide film; Power-law model; Negative difference effect (NDE);
1. Introduction
The corrosion mechanism of Mg has been the subject of a huge amount of work [1-5], and despite its ubiquity and history, the elementary mechanism remains little understood. This is mainly due to an anomalous phenomenon called the negative difference effect (NDE) which results in an increase of the hydrogen evolution rate when the magnesium is anodically polarized [6, 7]. Indeed, even if this phenomenon has been well documented in the literature [4, 7-9] and has been observed from various techniques [10-14], the mechanism itself is tricky and the subject has become controversial. At the corrosion potential, there is a good agreement with the global reaction:
Mg + H&+ H *O
Mg*&+ OH,+ H
* (Eq. 1)
and the formation of corrosion products: Mg*&+ 2OH, Mg OH
* (Eq. 2)
The rate of the NDE has been deeply investigated as a function of impurities contained in the Mg [15-18]. Metal impurities (e.g. Fe, Cu, Ni) result in large overpotential for the hydrogen evolution reaction at the Mg corrosion potential. However, from a thermodynamic point of view, even if these impurities act as local cathodes, any shift of the potential towards the anodic domain should result in a decrease of the hydrogen production reaction. Consequently, the metal impurities cannot be the only ones responsible for the NDE, but such behavior has been further investigated for alloying elements [19, 20].
Other developments, including film based model [4, 21], formation of magnesium hydride [22, 23], or formation of univalent Mg [24-26] have been used to make an attempt to explain the NDE. For the latter, the existence of soluble univalent species dissolved in solution remains questionable [4]. Thus, there is still a need to understand how the NDE occurs at the electrode surface. Additionally, the overall corrosion of Mg also leads to the formation of a thin oxide film (in the nanometer range) on the Mg surface in different corrosive environments that has been evidenced using X-ray photoelectron spectroscopy (XPS) [27, 28] or time-of-flight secondary ion mass spectroscopy (ToF SIMS) depth profiles [29, 30].
Interestingly, the use of electrochemical impedance spectroscopy (EIS) has already shown to give reliable and reproducible results for the study of Mg corrosion [31-34]. However, the analysis of the impedance spectra was usually limited to the study of the charge transfer resistance and of the polarization resistance [35]. Recently, a mathematical model for describing the inductive loop has been devised in order to account for the production of the excess of hydrogen [36]. This model took into account the evolution of the electrode surface over time, but it was uncorrelated from any kinetic aspect allowing the NDE to be linked to the corrosion mechanism of Mg. Moreover, plotting EIS data in different representations allows further analysis, in particular the determination of the interfacial capacitance [37]. For
instance, the use of complex-capacitance representation allows thin oxide layers formed on passivable metals [38-41], or on Mg alloys [42] to be characterized, leading to the evaluation of the oxide layer thickness.
In the present work, a detailed analysis of the corrosion mechanism of Mg in a sodium sulfate solution was undertaken, based on the use of EIS. A particular attention was paid to the interfacial capacitance analysis and to the inductive loop. For the latter, the previous model involving the relaxation of an adsorbed intermediate was further developed [34] and the fitting of the EIS spectra allowed the variation of the kinetic parameters to be obtained as a function of the immersion time in the Na2SO4 solution.
2. Experimental
The working electrode consisted in a Mg rod (5 mm in diameter) with a purity of 99.9%; purchased from Goodfellow. The impurity contents of this commercial pure Mg (given by the provider) are (in ppm): Al = 70, Cu = 20, Fe = 280, Mn = 170, Ni < 10, Si = 50 and Zn < 20. The lateral part of the cylinder was insulated with a cataphoretic paint and in sequence with an epoxy resin thus exposing a disk electrode of 19.6 mm2 surface area. Before the
electrochemical experiments, the electrode was ground with successive SiC abrasive papers up to grit P4000.
All the experiments were performed using a rotating disk electrode (RDE) and a Gamry Ref 600+ potentiostat. The electrode rotation rate was fixed at 1000 rpm. During the experiment, the temperature was maintained at 25 °C and the electrolyte was in contact with air. The experiments were performed in a 0.1 mol.L-1 Na2SO4 electrolytic solution (pro
analysis grade) with an initial pH of 5.6. It is generally accepted that SO42- anions are less
aggressive than Cl-. Leleu et al. [42] have shown that the corrosion rate of a commercially
pure Mg was about four times higher in a NaCl solution than in a Na2SO4 solution. Thus, in
the present study a less aggressive electrolyte was chosen to reduce the dissolution of the Mg rod for performing EIS measurements over extended time periods.
The reference and the counter electrodes were a mercury sulfate electrode (MSE) in a saturated potassium sulfate solution (EMSE = 0.64 V/SHE) and a platinum gauze of large
surface area, respectively.
The anodic and cathodic current / potential curves were plotted separately (two independent measurements) after a preliminary hold time of 2 h at the corrosion potential (Ecorr). The
potential sweep rate was fixed at 0.167 mV s-1. The polarization curves were corrected from
the ohmic drop, experimentally determined from the high-frequency limit of the impedance diagrams.
Impedance diagrams were obtained under potentiostatic regulation, Ecorr, over a frequency
range of 100 kHz to a few mHz with 8 points per decade, using a 10 mVrms sinusoidal voltage.
performed. The obtained impedance diagrams were always consistent with the Kramers-Kronig relations [43, 44].
3. Results and discussion
3.1. Steady-state measurements
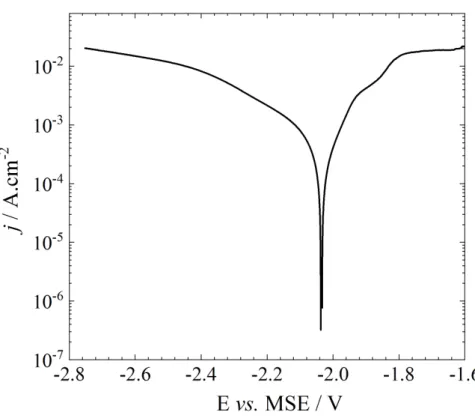
Fig. 1 shows the current / potential curve obtained on the Mg electrode in a 0.1 mol.L-1
Na2SO4 solution after a preliminary 2 h hold time at Ecorr. As previously reported, the anodic
polarization curve shows 3 different domains [34]. The first domain, close to the corrosion potential, is almost linear. This behavior might be explained by the formation of a monovalent adsorbed intermediate followed by the formation of the divalent Mg2+ ion (vide
infra). The second domain starts at about -1.9 V/MSE for which a significant change in the slope of the curve can be observed. Such behavior could be ascribed to a change of the limiting process in the dissolution mechanism. The last domain, for potentials larger than -1.8 V/MSE, is characterized by a plateau of current of about 20 mA cm-2. In the present
work, we mainly focused on the study around Ecorr, thus limiting the investigation on the
corrosion / dissolution mechanism to the first domain for low dissolution rate.
The cathodic polarization curve corresponds to the hydrogen evolution reaction and shows two different slopes that are difficult to interpret due to the formation of hydrogen bubbles at the electrode surface.
3.2. Electrochemical impedance measurements
3.2.1. Impedance diagrams at E
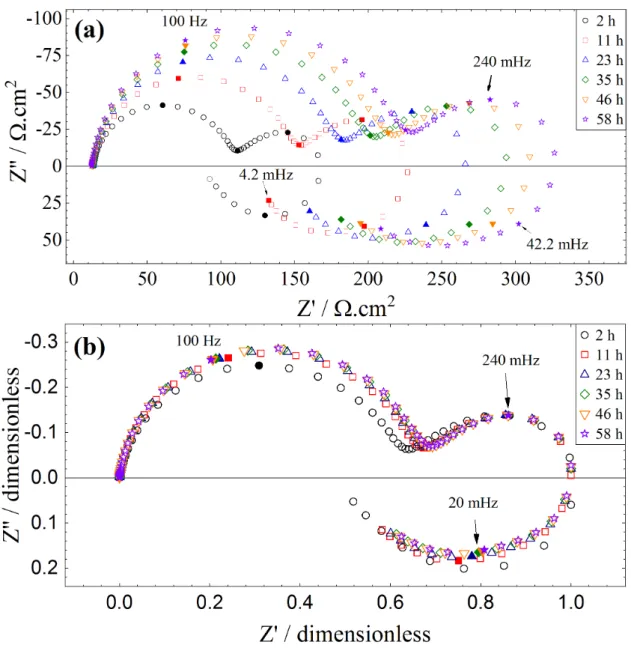
corrFig. 2a shows the impedance diagrams (Nyquist coordinates) for the Mg electrode obtained at Ecorr as a function of immersion time in the Na2SO4 solution. Independently of the
immersion time, the shape of the diagrams is very similar and shows three distinct time constants. In the high-frequency range, the first capacitive loop corresponds to the charge transfer resistance in parallel with the interfacial capacitance. This capacitance will be thoroughly discussed in the following. The medium-frequency time constant is attributed to the diffusion of species inside the porous layer formed by the corrosion products (it has been previously shown that this time constant was independent of the electrode rotation rate) [32]. The low-frequency inductive loop is ascribed to the relaxation of adsorbed intermediates. Such mechanism, involving a monovalent species adsorbed on the electrode surface, has already been observed for the corrosion of different metals, including Fe [45, 46], Cr [47] or Zn [48, 49], that is for multi-step reaction mechanism involving adsorbed species [45, 50, 51]. Interestingly, the impedance diagrams in Fig. 2a are homothetic to each other. This can be better visualized in Fig. 2b (each diagram was normalized by the maximum value of the real
part of the impedance). With such a dimensionless representation, all the EIS diagrams superimpose and the three time constants remain unchanged regardless of the immersion time except for the first times (here 2 h). This difference can be ascribed to the reactivity of the bare Mg during the first hours of immersion which will be detailed in a next section. Moreover, the characteristic frequency of the first capacitive loop slightly varies with time. Conversely, the second characteristic frequency corresponding to the diffusion process is constant, in agreement with the RDE theory for the diffusion in a finite-thickness layer. As a result, whatever the frequency domain considered, the variation of the amplitude of the impedance response of each process follows the same proportionality law. This behavior can be attributed to a variation of the active surface area with the immersion time. In other words, the increase of the impedance translates into a decrease in current, that is, in a decrease of the active surface area of the electrode on which the Mg dissolution occurs. It should be noticed that this active surface area is small by comparison with the surface area covered by MgO (see below). This conclusion is in agreement with scanning electrochemical microscopy experiments performed above a corroding Mg substrate that showed a decrease of the surface area of the reactive domain as a function of the immersion time [34].
3.2.2. Impedance diagrams at low anodic over potentials: inductive
contribution analysis
Fig. 3a shows the impedance diagrams of the Mg electrode after 11 h of immersion in 0.1 mol L-1 Na
2SO4 solution at Ecorr (black circles) and for two low anodic over potentials (blue
and red circles for Ecorr + 10 mV and Ecorr + 20 mV, respectively). These polarization
potentials correspond to steady-state anodic current densities of 100 µA cm-2 and 220 µA
cm-2, respectively (Fig. 1). It can be seen that the global shape of the two impedance
diagrams is independent of the applied potential and shows the same time constants as those previously described, indicating that the same mechanism occurs at Ecorr and for low anodic
over potentials. Fig. 3b shows the dimensionless representation of the EIS diagrams obtained from the normalization by the maximum value of the real part of each spectrum presented in Fig. 3a. It can be seen that each time constant slightly depends on the potential. In particular, the amplitude of the low-frequency inductive loop increases with the potential, regardless of the variation of the active surface area. Such observation has been already reported for this inductive feature, but only to evaluate the Mg dissolution rate [35]. Indeed, this inductive contribution can be ascribed to an adsorbed intermediate relaxation and fulfill the hypothesis of the surface coverage relaxation with the potential. In the present case, within the small anodic investigated potential domain, the Mg./0& surface coverage
intermediates has been proposed for many different systems, regardless of the technique used, impedance spectroscopy or polarization curves [52-54].
The intermediate frequency domain corresponding to the diffusion of species through the Mg(OH)2 layer is slightly affected by the change in potential.
3.2.3. Interfacial capacitance: graphical analysis and power-law model
The impedance results, presented in Fig. 2 and in Fig. 3
,
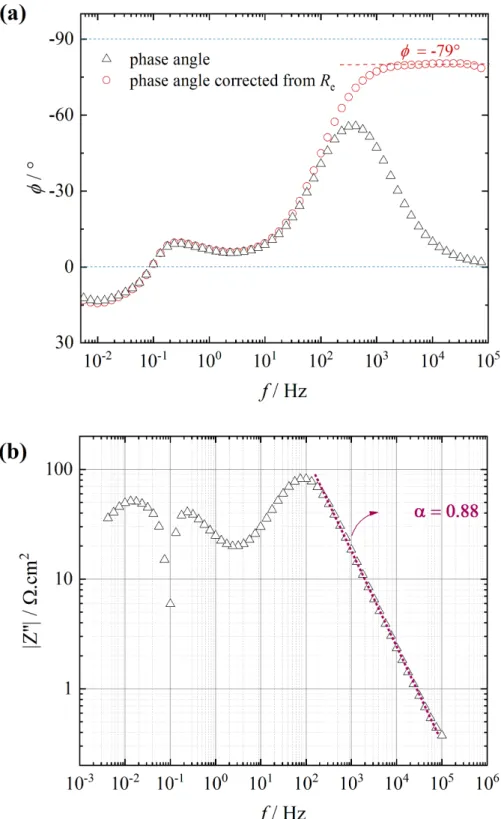
show that the high-frequency response corresponding to the charge transfer resistance in parallel with the interfacial capacitance is characterized by a flattened capacitive loop. Graphical analysis of the results allows a constant phase element (CPE) to be clearly evidenced in the high-frequency domain (Fig. 4a) and the a parameter of the CPE (the impedance of which is given by 𝑍234 =6
7 89:) to be determined from the variation of the imaginary part of the impedance (in
absolute value) as a function of frequency (Fig. 4b) [37, 55]. In Fig. 4a, it can be seen that the phase angle value on the plateau, for the corrected curve, is -79°. Thus, the CPE parameter is equal to 79:90 = 0.88, in agreement with the value determined in Fig. 4b. The plateau observed at high-frequency is characteristic of a pure CPE behavior which may be the consequence of a resistivity distribution along the thin oxide film thickness. This CPE behavior can be analyzed by the power-law model [56, 57]. However, the use of the power-law model introduces a large number of parameters. The capacitance of the oxide film can be extracted from the impedance data by using the complex-capacitance representation [58, 59] and then, the oxide film thickness can be calculated. It was shown that this methodology allows an easy determination of the oxide film thickness that agrees well with the results obtained with other techniques, such as XPS [38] or reflectometry [41]. A similar methodology has been recently used to investigate the stability of the oxides film formed on a Mg alloy containing rare-earth elements [42]. Thus, in a first step, the film capacitance was graphically determined from the EIS response through the relationship:
𝐶 𝜔 =89 = 6
>9 ,?@ (Eq. 3)
Where 𝑍A is the impedance of the Mg electrode and 𝑅C is the electrolyte resistance, which
can be determined from the high frequency limit of the impedance diagram.
The results presented in Fig. 5 shows an example of the complex-capacitance plot obtained from the impedance response of the Mg electrode after 35 h of immersion at Ecorr in 0.1 mol.L -1 Na2SO4 solution (Fig. 2). From the HF frequency limit of the impedance, 𝐶
D, the dielectric
capacitance of the thin MgO oxide film formed at the electrode surface can be determined. The thin oxide film thickness, 𝛿FG, was afterwards calculated from the usual relationship
𝐶D= HHI
where 𝜀 and 𝜀N are the relative permittivity of the thin oxide film and the vacuum
permittivity (𝜀N= 8.85 10,6T Fcm,6), respectively. Assuming a permittivity value of 9 for
MgO, this leads to an oxide film thickness of 6.6 nm for the results presented in Fig. 5. The oxide film thickness was calculated from all the impedance spectra obtained at Ecorr. The 𝛿FG
values are reported in Fig. 6 as a function of the immersion time in the Na2SO4 solution. The
film thickness slightly increases with time from 5.4 nm up to 7 nm after 60 h of immersion. Then, the power-law model, previously introduced to account for a normal distribution of the time constants at an interface [56, 57], was used for describing the impedance contribution of the oxide film and is given by the general formula
𝑍FGX/C 𝜔 = Y G
6&89HHIY G 𝑑𝑥
JKL
N (Eq. 5)
in which 𝜔 is the pulsation, 𝑗 the imaginary number solution of 𝑗*= −1, and 𝜌 𝑥 the
resistivity distribution inside the film, which is expressed as a function of the normal coordinate, 𝑥, to the film as
𝜌 𝑥 = 𝜌J Y_ YI+ 1 − Y_ YI G JKL ` ,6 (Eq. 6)
where 𝜌N and 𝜌J are the boundary values of the resistivity at the metal / oxide interface and
at the oxide / solution interface, respectively.
It has been previously shown that this impedance has an analytical solution in a restricted frequency domain depending on the value of 𝜌N and 𝜌J [56, 57]. In the present work, the
non-linear regression analysis was performed with the integral formula, which is valid over the whole frequency domain.
The parameters, 𝜌N and 𝜌J, corresponding to the interfacial capacitances were determined
and are reported as a function of the immersion time in Fig. 7. Both at the metal / oxide interface and at the oxide / solution interface the resistivity values remain relatively constant. These values show that the MgO conductivity changes by about 6 orders of magnitude over a nanometric distance. This should be explained by the hydration of the layer that should decrease along the thin film thickness. These constant values are also in agreement with the fact that the oxide film (MgO) mainly grows laterally over the electrode surface decreasing the active surface area as it can be observed on the variation of the impedance diagrams with the immersion time.
Finally, it can be assumed that the thin MgO oxide film dominates the capacitive response of the interface, that is, the surface area covered by the MgO is higher in comparison with the film-free area and thus, the double layer capacitance is negligible.
3.3. Corrosion mechanism
3.3.1. Kinetics model
From the above results, a detailed description of the impedance response can be provided accounting for both, the corrosion mechanism of the Mg in sulfate solution and the interfacial capacitance of the electrode. Unlike most of the literature, we provide a mechanistic description of the corrosion mechanism in terms of elementary reactions together with the analysis of the CPE behavior accounting for the thin oxide film at the Mg surface. Such an approach allows to avoid the use of electrical equivalent circuits, and allows to demonstrate the significant role played by the adsorbates on the corrosion mechanism.
At Ecorr, the description of the corrosion mechanism of a metal accounts for both the anodic
and the cathodic processes, resulting in a null net current. In the case of Mg, the impedance results (Fig. 2 and Fig. 3) showed that, at Ecorr and for low anodic potential values, the
impedance diagrams shows the same time constants, the impedances only increased by a multiplying factor depending on the immersion time. Thus, it can be concluded that the Mg dissolution dominates the impedance response and in the following, only the anodic reaction was taken into account to describe the dissolution mechanism of Mg that is valid at Ecorr and
for low anodic over potentials. Moreover, the anodic steady-state curve and the inductive loop observed on all the EIS diagrams suggest that the mechanism involved an adsorbed intermediate. Hence, it is proposed a corrosion mechanism involving the Mg./0& species that
remains as an active site on the electrode surface. Interestingly, such an intermediate has been previously proposed by Baril et al. [34] and is also in agreement with the recent works of Taylor [60] and Yuwono et al. [15] involving the formation of adsorbed intermediates at the electrode surface leading to the formation of hydrogen bubbles.
Thus, on the film-free areas, two successive anodic reactions occur
Mg ab Mg./0& + e, (Eq. 7)
and Mg./0&
ac
adc
Mg*&+ e, (Eq. 8)
where 𝑘X and 𝑘,X are the forward and the backward rate constants of the reaction,
respectively and expressed in cm-2 s-1. Assuming that the kinetic constants of the
electrochemical reactions follow the Tafel’s law, each reaction has a normalized time constant 𝐾X corresponding to its rate constant 𝑘X by
𝐾X = 𝑘X exp ±𝑏X 𝐸 − 𝐸N (Eq. 9)
where 𝑏X is the charge transfer coefficient, and 𝐸 − 𝐸N the applied over potential with
oxidation reaction and negative for a reduction reaction. In the following, the origin of potentials is chosen as the corrosion potential obtained after reaching the steady-state in solution, and thus 𝑉 = 𝐸 − 𝐸kFll.
For the NDE, which is a chemical reaction of the Mg./0& , formed on the Mg surface, with
water to produce dihydrogen (Eq. 10) the increase of the magnitude of the inductive loop, observed on the EIS diagrams as a function of the applied potential (Fig. 3), indicated that the surface coverage by the adsorbed species also increased with the potential. Such a behavior is in agreement with the relaxation of adsorbed species [37, 61] and also with the increase of the H2 formation when the potential of the Mg electrode is shifted towards anodic
values. It is thus proposed that the NDE occurs only with the Mg./0& , and expresses as
Mg./0& + H *O
am
Mg*&+ OH,+6
*H* (Eq. 10)
Assuming that the adsorbate Mg./0& obeys a Langmuir’s isotherm with a maximum number
of sites per surface unit 𝛽, and a fraction of surface coverage 𝜃, the charge and mass balance express as
𝛽/p/q = 𝐾6 1 − 𝜃 − 𝐾*𝛽𝜃 + 𝐾,*𝐶Mg2+− 𝑘r𝛽𝜃 (Eq. 11)
𝐷2JMg2+
tKuu = 𝐾*𝛽𝜃 − 𝐾,*𝐶Mg2+ + 𝑘r𝛽𝜃 (Eq. 12)
where 𝐶Mg2+ is the interfacial concentration of Mg2+ in solution. 𝛿kFll is the total thickness of
the corrosion product layer. It should be recalled that 𝛿kFll accounts for the thickness of the
Mg(OH)2 and is different from the the MgO film thickness ( 𝛿FG), previously determined from
the capacitance plots (Fig. 5). The faradaic current expresses as
𝑖A = 𝐹𝐴 𝐾6 1 − 𝜃 + 𝐾*𝛽𝜃 − 𝐾,*𝐶Mg2+ (Eq. 13)
where F is the Faraday constant and A is the electrode surface area.
At steady-state, /p/q = 0, which leads to the determination of steady-state Mg2+ concentration
and surface coverage as 𝜃0q.q=yb&ydc2Mg2+
yb&ycz&amz (Eq. 14)
and 𝐶Mg2+ = yc&a~m zp{|}| _tKuu&ydc (Eq. 15) thus 𝜃0q.q= yb _tKuu~ &ydc
The linearization of the governing equations allows the calculation of the faradaic impedance as the solution of the linear system of equations (Eqs. 17-19):
𝑗𝜔𝛽Δ𝜃 = − 𝐾6+ 𝐾*𝛽 + 𝑘r𝛽 Δ𝜃 + 𝐾6𝑏6− 𝐾6𝑏6𝜃 − 𝐾*𝑏*𝛽𝜃 − 𝐾,*𝑏,*𝐶Mg2+ Δ𝑉 + 𝐾,*Δ𝐶Mg2+
𝑗𝜔𝛽 + 𝐾6+ 𝛽 𝐾*+ 𝑘r Δ𝜃 = 𝐾6𝑏6 1 − 𝜃 − 𝐾*𝑏*𝛽𝜃 − 𝐾,*𝑏,*𝐶Mg2+ Δ𝑉 + 𝐾,*Δ𝐶Mg2+
∆𝑖A
𝐹𝐴 = 𝐾*𝛽 − 𝐾6 ∆𝜃 + 𝐾6𝑏6− 𝐾6𝑏6𝜃6+ 𝐾*𝑏*𝛽𝜃 + 𝐾,*𝑏,*𝐶Mg2+ ∆𝑉 − 𝐾,*∆𝐶Mg2+
The concentration variation ∆𝐶Mg2+ inside a finite diffusion layer of thickness 𝛿kFll is given
by the solution of the second Fick’s law using the Nernst hypothesis [37].
∆2Mg2+ ∆X> = − 6 A•‚ ƒ#„… JtKuu †‡~ †‡ ~ = − 6 A•𝑁 𝜔 (Eq. 20) with 𝑁 𝜔 = ƒ#„… JtKuu †‡~ 89‚ (Eq. 21)
then, the faradaic contribution to the impedance can be calculated 𝑍A 𝜔 = ∆‰
∆X>=
6&yccŠ 9 6,†‡Œ•‹b•Œ ‹c•Žm‹cŒd‹b
A• lb&lc&†‡Œ•‹b•Œ ‹c•Žm‹cŒd‹b ubduc (Eq. 22)
with
𝑟6= 𝐾6𝑏6 1 − 𝜃 (Eq. 23)
and
𝑟*= 𝐾*𝑏*𝛽𝜃 + 𝐾**𝑏**𝐶Mg2+ (Eq. 24)
The overall impedance is then obtained by taking into account the contribution of the interfacial capacitance, 𝑍FGX/C 𝜔 , and the electrolyte resistance, 𝑅C:
𝑍 𝜔 = 𝑅C+=>9 ×=KL‘’@ 9
=>9 &=KL‘’@ 9 (Eq. 25)
Fig. 8 shows the EIS diagrams in Nyquist representation for the Mg electrode after 35 h immersion (black circles). On the same graph, the result of the non-linear regression with the proposed model (Eqs.22 & 25) is reported (red crosses). This non-linear regression was performed with an in-house made software based on a simplex algorithm allowing analytical expression of the impedance and of the conductivity to be used. A detailed analysis of the EIS diagrams presented in Fig. 2 and 3 was performed with the model, and in the following,
the results of this analysis and the variations of the most significant parameters are presented and discussed. The electrolyte resistance remains constant as a function of the immersion time. Such behavior is expected since Re is measured in the high-frequency domain
and only depends on the geometry of the electrochemical cell, and in particular of the electrode size. Thus, for the fitting procedure, the Re value was graphically determined and
then used as a constant. Similarly, the thin oxide film thicknesses ( 𝛿FG) determined from the
complex-capacitance diagrams (Fig. 6) were also fixed in the fitting procedure. Thus, the number of parameters to be adjusted was smaller allowing a greater accuracy for the remaining parameters to be obtained. It should also be underline that this model enables to explain both the dissolution kinetics of Mg with a two-elementary-step reaction mechanism and the NDE phenomenon, is in agreement with the experimental results of the literature [2-6].
3.3.2. Modeling of the electrochemical response
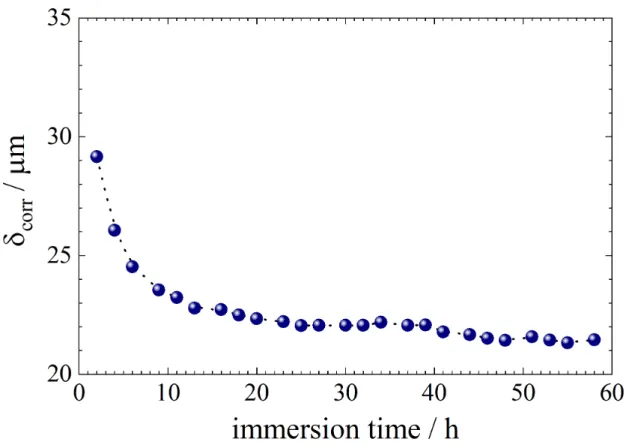
From the fitting procedure, the thickness of the Mg(OH)2 layer formed on the electrode
surface during the corrosion process can be readily obtained. Its variation as a function of the immersion time in the Na2SO4 solution is presented in Fig. 9. It slightly decreases from
29 µm to 21 µm after about 60 h of immersion. A thickness, in the same order of magnitude (15 µm), has been measured from ex situ SEM examination of the cross-section of the Mg(OH)2 layer formed at a Mg sample after 21 h of immersion in a sodium sulfate solution
[32]. Most of the variation of the layer thickness is observed during the first hours of immersion. Indeed, no corrosion product was initially present, and the thickness variation in the first hours is a result of two phenomena: the convective diffusion of redox species in solution for short immersion time (i.e. during the formation of the corrosion layer, the thickness of the Nernst layer being in the range of 20 µm for a RDE at 1000 rpm), and then the diffusion inside the corrosion layer for longer immersion time. After 20 h, it is assumed that a steady-state is reached between the formation and the dissolution of the Mg(OH)2
layer. A general sketch of the interface is presented in Fig. 10
.
The calculation of the surface coverage by the adsorbate Mg./0& with Eq. 16 and the
regressed parameters showed a variation of 𝜃0q.q that increased during the 10 first hours from
2×10⁻³ to 4×10⁻³, and then decreased down to 3×10⁻³, in agreement with the progressive
formation of the corrosion products layer that partially hindered the surface reactivity. Moreover, from Eq. 15, the interfacial concentration of Mg2+ was calculated. Values in the
range of a few 10-7 molL-1 were obtained, that is 2 to 3 orders of magnitude lower than the
solubility limit of Mg(OH)2 for a pH of about 10 [31, 32]. Such a value is in agreement with a
local pH increase at the Mg surface and the presence of a concentration gradient in the close vicinity of the electrode.
In contrast, the variation of the different kinetic constants, which were obtained from the fitting of the different time constants, cannot be directly interpreted. Indeed, the evolution of the EIS diagrams as a function of the immersion time strongly depends on the variation of the active surface area, and thus the fitted parameters, obtained from the raw data, must be corrected from the surface area variation. The evolution of the active surface area was calculated from the charge transfer resistance, determined from the diameter of the first capacitive loop of the impedance diagram for each immersion time and by using the first measurement (after 2 h of immersion) as reference value. The results are presented in Fig. 11. It should be noted that the same result is obtained if the active surface area is calculated from the maximum value of the real part of the impedance diagrams as it was done for performing the normalization of the EIS spectra presented in Fig. 2. A significant decrease of the active surface with time can be observed (in other words, an increase of the electrode surface area covered by the oxide layer), which is about twice smaller after 60 h of immersion. Even if the active surface area cannot be accurately determined and should represent a small fraction of the whole electrode surface, the obtained variation underlines that the oxide film does not completely cover the electrode surface (free-film area still remains present on the Mg surface). This is in agreement with the Pilling-Bedworth (PB) ratio. For pure MgO, the PB ratio is smaller than 1 (0.8 [5, 62]) indicating that the MgO oxide film cannot fully cover the Mg surface.
The fitting procedure allows all the parameters of the model to be determined. The variations of the kinetic constants, k1 and k2, and the related Tafel parameters, b1 and b2, are
presented in Fig. 12 as a function of time. The variation of the raw values of k1 (open blue
circles - Fig. 12a) shows a decrease of the kinetic constant with time. However, the active surface area also varies as a function of time (Fig. 11) and the apparent kinetics parameters obtained from the impedance variations can be described as extensive parameters. The variations of k1 have to be corrected from the active surface area variations (plain blue circles
- Fig. 12a), thus showing an almost constant behavior with time. The Tafel’s coefficient, b1
(red squares - Fig. 12a) is independent of the immersion time. It should be noted that this parameter, the units of which are V-1, is to be seen as an intensive parameter, i.e.
independent of the surface variation. It is thus concluded that the first step of the anodic dissolution is not modified by the formation of the corrosion product or by the minute change of the interface. Conversely, the second kinetic constant k2 (Fig. 12b) varies
whatever the representation, whereas b2 remains constant. Thus, the second step (dissolution
rate of Mg, from adsorbed species, Mg./0& , to Mg2+) is governed by the immersion time.
These kinetic parameters allowed the steady-state current to be calculated, using Eq. 13, which corresponds in this case to the corrosion current density. After 2 h of immersion, the value is about 115 µA cm-2, which is in agreement with the current densities measured on the
current/potential curve (Fig. 2). This value is close to that obtained in similar conditions (commercially pure Mg in Na2SO4 solution with a RDE)[63].
It can be concluded that the impedance measurements which allowed the evaluation of the corrosion rate from the charge transfer resistance, showed that the variation of the active surface area of the Mg electrode is mainly responsible for the apparent decrease of the corrosion rate as a function of time.
4. Conclusions
In the present work, a model was proposed to fully describe the three time constants observed on the impedance diagrams as a function of the immersion time in a sodium sulfate solution. The Mg dissolution was described by an elementary mechanism involving the exchange of two electrons in two steps and including an adsorbed intermediate (Mg./0& ). The
Mg./0& is involved in a chemical reaction to describe the NDE (Eq. 10). All the impedance
diagrams were perfectly adjusted with the model.
First, the increase of the impedance magnitude with time was ascribed to the decrease of the active surface area. In the high-frequency range, the charge transfer resistance in parallel with the interfacial capacitance allows a fine description of the thin oxide MgO film formed on the Mg surface. Its thickness was obtained from the analysis of the complex capacitance plot, whereas the CPE behavior was explained and analyzed by using the power-law model that describes the resistivity variations inside the film [56, 57].
The second time constant was attributed to the diffusion of electroactive species inside the thick-layer of corrosion products (Mg(OH)2), as previously described in the literature [34].
Finally, the inductive loop in the low-frequency domain was ascribed to the relaxation of the adsorbate on the Mg surface. It was shown that its magnitude increased with the anodic over potentials, showing that the adsorbed intermediates can be specific sites on which the NDE occurs.
Acknowledgments
The authors acknowledge FAPESP (2013/13235-6) and CAPES-Cofecub (806-14) for the financial support to this research and also for the grant of Maurilio Pereira Gomes (88881.154406/2017-01).
References
[1] G. Song, A. Atrens, Corrosion mechanisms of magnesium alloys, Advanced Engineering Materials, 1 (1999) 11-33.
[2] G. Song, A. Atrens, Understanding magnesium corrosion: a framework for improved alloy performance, Advanced Engineering Materials, 5 (2003) 837-858.
[3] A. Atrens, G. Song, M. Liu, Z. Shi, F. Cao, M.S. Dargusch, Review of Recent
Developments in the Field of Magnesium Corrosion, Advanced Engineering Materials, 17 (2015) 400-453.
[4] S. Thomas, N.V. Medhekar, G.S. Frankel, N. Birbilis, Corrosion mechanism and hydrogen evolution on Mg, Curr. Opin. Solid State Mat. Sci., 19 (2015) 85-94.
[5] M. Esmaily, J.E. Svensson, S. Fajardo, N. Birbilis, G.S. Frankel, S. Virtanen, R. Arrabal, S. Thomas, L.G. Johansson, Fundamentals and advances in magnesium alloy corrosion, Progress in Materials Science, 89 (2017) 92-193.
[6] G.L. Makar, J. Kruger, Corrosion of magnesium, International Materials Reviews, 38 (1993) 138-153.
[7] G.S. Frankel, S. Fajardo, B.M. Lynch, Introductory lecture on corrosion chemistry: a focus on anodic hydrogen evolution on Al and Mg, Faraday Discuss, 180 (2015) 11-33. [8] G.S. Frankel, A. Samaniego, N. Birbilis, Evolution of hydrogen at dissolving magnesium surfaces, Corros. Sci., 70 (2013) 104-111.
[9] S. Fajardo, G.S. Frankel, A kinetic model explaining the enhanced rates of hydrogen evolution on anodically polarized magnesium in aqueous environments, Electrochem. Commun., 84 (2017) 36-39.
[10] G. Williams, N. Birbilis, H.N. McMurray, The source of hydrogen evolved from a magnesium anode, Electrochem. Commun., 36 (2013) 1-5.
[11] G. Song, A. Atrens, Recent insights into the mechanisms of magnesium corrosion and research suggestions, Advanced Engineering Materials, 9 (2007) 177-183.
[12] S. Fajardo, G.S. Frankel, Gravimetric Method for Hydrogen Evolution Measurements on Dissolving Magnesium, J. Electrochem. Soc., 162 (2015) C693-C701.
[13] J. Swiatowska, P. Volovitch, K. Ogle, The anodic dissolution of Mg in NaCl and Na2SO4 electrolytes by atomic emission spectroelectrochemistry, Corros. Sci., 52 (2010) 2372-2378.
[14] V. Shkirskiy, A.D. King, O. Gharbi, P. Volovitch, J.R. Scully, K. Ogle, N. Birbilis, Revisiting the electrochemical impedance spectroscopy of magnesium with online inductively coupled plasma atomic emission spectroscopy, Chemphyschem, 16 (2015) 536-539.
[15] J.A. Yuwono, N. Birbilis, R. Liu, Q. Ou, Q. Bao, N.V. Medhekar, Aqueous
Electrochemical Activity of the Mg Surface: The Role of Group 14 and 15 Microalloying Elements, J. Electrochem. Soc., 164 (2017) C918-C929.
[16] S. Fajardo, O. Gharbi, N. Birbilis, G.S. Frankel, Investigating the Effect of Ferrous Ions on the Anomalous Hydrogen Evolution on Magnesium in Acidic Ferrous Chloride Solution, J. Electrochem. Soc., 165 (2018) C916-C925.
[17] O. Gharbi, N. Birbilis, Clarifying the Dissolution Mechanisms and Electrochemistry of Mg2Si as a Function of Solution pH, J. Electrochem. Soc., 165 (2018) C497-C501.
[19] A. Samaniego, N. Birbilis, X. Xia, G.S. Frankel, Hydrogen Evolution During Anodic Polarization of Mg Alloyed with Li, Ca, or Fe, Corrosion, 71 (2014) 224-233.
[20] S. Fajardo, J. Bosch, G.S. Frankel, Anomalous hydrogen evolution on AZ31, AZ61 and AZ91 magnesium alloys in unbuffered sodium chloride solution, Corros. Sci., 146 (2019) 163-171.
[21] J.L. Robinson, P.F. King, Electrochemical Behavior of the Magnesium Anode, J. Electrochem. Soc., 108 (1961) 36-41.
[22] G.G. Perrault, Potentiostatic study of the magnesium electrode in aqueous solution, J. Electroanal. Chem., 27 (1970) 47-58.
[23] E. Gulbrandsen, J. Taftø, A. Olsen, The passive behaviour of Mg in alkaline fluoride solutions. Electrochemical and electron microscopical investigations, Corros. Sci., 34 (1993) 1423-1440.
[24] Z.M. Shi, J.X. Jia, A. Atrens, Galvanostatic anodic polarisation curves and galvanic corrosion of high purity Mg in 3.5% NaCl saturated with Mg(OH)(2), Corros. Sci., 60 (2012) 296-308.
[25] Z.M. Shi, F.Y. Cao, G.L. Song, A. Atrens, Low apparent valence of Mg during corrosion, Corros. Sci., 88 (2014) 434-443.
[26] A.D. Atrens, I. Gentle, A. Atrens, Possible dissolution pathways participating in the Mg corrosion reaction, Corros. Sci., 92 (2015) 173-181.
[27] H.B. Yao, Y. Li, A.T.S. Wee, An XPS investigation of the oxidation/corrosion of melt-spun Mg, Applied Surface Science, 158 (2000) 112-119.
[28] M. Santamaria, F. Di Quarto, S. Zanna, P. Marcus, Initial surface film on magnesium metal: A characterization by X-ray photoelectron spectroscopy (XPS) and photocurrent spectroscopy (PCS), Electrochim. Acta, 53 (2007) 1314-1324.
[29] A. Seyeux, M. Liu, P. Schmutz, G. Song, A. Atrens, P. Marcus, ToF-SIMS depth profile of the surface film on pure magnesium formed by immersion in pure water and the
identification of magnesium hydride, Corros. Sci., 51 (2009) 1883-1886.
[30] D. Mercier, J. Światowska, S. Zanna, A. Seyeux, P. Marcus, Role of Segregated Iron at Grain Boundaries on Mg Corrosion, J. Electrochem. Soc., 165 (2018) C42-C49.
[31] N. Pebere, C. Riera, F. Dabosi, Investigation of magnesium corrosion in aerated sodium sulfate solution by electrochemical impedance spectroscopy, Electrochim. Acta, 35 (1990) 555-561.
[32] G. Baril, N. Pebere, The corrosion of pure magnesium in aerated and deaerated sodium sulfate solutions, Corros. Sci., 43 (2001) 471-484.
[33] G. Baril, C. Blanc, M. Keddam, N. Pebere, Local electrochemical impedance
spectroscopy applied to the corrosion behavior of an AZ91 magnesium alloy, J. Electrochem. Soc., 150 (2003) B488-B493.
[34] G. Baril, G. Galicia, C. Deslouis, N. Pebere, B. Tribollet, V. Vivier, An impedance investigation of the mechanism of pure magnesium corrosion in sodium sulfate solutions, J. Electrochem. Soc., 154 (2007) C108-C113.
[35] A.D. King, N. Birbilis, J.R. Scully, Accurate Electrochemical Measurement of
Magnesium Corrosion Rates; a Combined Impedance, Mass-Loss and Hydrogen Collection Study, Electrochim. Acta, 121 (2014) 394-406.
[36] M. Curioni, L. Salamone, F. Scenini, M. Santamaria, M. Di Natale, A mathematical description accounting for the superfluous hydrogen evolution and the inductive behaviour observed during electrochemical measurements on magnesium, Electrochim. Acta, 274 (2018) 343-352.
[37] M.E. Orazem, B. Tribollet, Electrochemical Impedance Spectroscopy, 2 ed., Wiley, Hoboken, New Jersey, 2017.
[38] M. Benoit, C. Bataillon, B. Gwinner, F. Miserque, M.E. Orazem, C.M. Sánchez-Sánchez, B. Tribollet, V. Vivier, Comparison of different methods for measuring the passive film thickness on metals, Electrochim. Acta, 201 (2016) 340-347.
[39] T.T.M. Tran, B. Tribollet, E.M.M. Sutter, New insights into the cathodic dissolution of aluminium using electrochemical methods, Electrochim. Acta, 216 (2016) 58-67.
[40] S. Chakri, I. Frateur, M.E. Orazem, E.M.M. Sutter, T.T.M. Tran, B. Tribollet, V. Vivier, Improved EIS Analysis of the Electrochemical Behaviour of Carbon Steel in Alkaline Solution, Electrochim. Acta, 246 (2017) 924-930.
[41] S. Chakri, A.N. Patel, I. Frateur, F. Kanoufi, E.M.M. Sutter, T.T.M. Tran, B. Tribollet, V. Vivier, Imaging of a Thin Oxide Film Formation from the Combination of Surface
Reflectivity and Electrochemical Methods, Anal. Chem., 89 (2017) 5303-5310.
[42] S. Leleu, B. Rives, J. Bour, N. Causse, N. Pébère, On the stability of the oxides film formed on a magnesium alloy containing rare-earth elements, Electrochim. Acta, 290 (2018) 586-594.
[43] C. Gabrielli, M. Keddam, H. Takenouti, Kramers-Kronig transformation in relation to the interface regulating device, ASTM Special Technical Publication, STP 1188 (1993) 140-153.
[44] J.R. Macdonald, Some new directions in impedance spectroscopy data analysis, Electrochim. Acta, 38 (1993) 1883-1890.
[45] I. Epelboin, C. Gabrielli, M. Keddam, H. Takenouti, Model of the anodic behavior of iron in sulfuric acid medium, Electrochim. Acta, 20 (1975) 913-916.
[46] I. Epelboin, M. Keddam, O.R. Mattos, H. Takenouti, The dissolution and passivation of iron and iron-chromium alloys in acidified sulfate medium. Influences of pH and chromium content, Corros. Sci., 19 (1979) 1105-1112.
[47] J.A.L. Dobbelaar, J.H.W. de Wit, Impedance Measurements and Analysis of the Corrosion of Chromium, J. Electrochem. Soc., 137 (1990) 2038-2046.
[48] C. Cachet, F. Ganne, G. Maurin, J. Petitjean, V. Vivier, R. Wiart, EIS investigation of zinc dissolution in aerated sulfate medium. Part I: bulk zinc, Electrochim. Acta, 47 (2001) 509-518.
[49] C. Cachet, F. Ganne, S. Joiret, G. Maurin, J. Petitjean, V. Vivier, R. Wiart, EIS investigation of zinc dissolution in aerated sulphate medium. Part II: zinc coatings, Electrochim. Acta, 47 (2002) 3409-3422.
[50] I. Epelboin, M. Keddam, J.C. Lestrade, Faradaic impedances and intermediates in electrochemical reactions, Faraday Discuss. Chem. Soc., 56 (1973) 264-275.
[51] D. Klotz, Negative capacitance or inductive loop? – A general assessment of a common low frequency impedance feature, Electrochem. Commun., 98 (2019) 58-62.
[52] J.O.M. Bockris, D. Drazic, A.R. Despic, The electrode kinetics of the deposition and dissolution of iron, Electrochim. Acta, 4 (1961) 325-361.
[53] K.E. Heusler, R. Knödler, Die kinetik der zinkelektrode in wässrigen malonatlösungen, Electrochim. Acta, 18 (1973) 855-861.
[54] W.J. Lorenz, J.R. Vilche, Zur kinetik der anodischen eisenauflösung im neutralen medium, Corros. Sci., 12 (1972) 785-798.
[55] M.E. Orazem, N. Pebere, B. Tribollet, Enhanced Graphical Representation of Electrochemical Impedance Data, J. Electrochem. Soc., 153 (2006) B129-B136.
[56] B. Hirschorn, M.E. Orazem, B. Tribollet, V. Vivier, I. Frateur, M. Musiani, Constant-Phase-Element Behavior Caused by Resistivity Distributions in Films: II. Applications, J. Electrochem. Soc., 157 (2010) C458-C463.
[57] B. Hirschorn, M.E. Orazem, B. Tribollet, V. Vivier, I. Frateur, M. Musiani, Constant-Phase-Element Behavior Caused by Resistivity Distributions in Films: I. Theory, J. Electrochem. Soc., 157 (2010) C452-C457.
[58] A.K. Jonscher, Dielectric characterisation of semiconductors, Solid-State Electronics, 33 (1990) 737-742.
[59] A.K. Jonscher, Dielectric relaxation in solids, Journal of Physics D-Applied Physics, 32 (1999) R57-R70.
[60] C.D. Taylor, A First-Principles Surface Reaction Kinetic Model for Hydrogen Evolution under Cathodic and Anodic Conditions on Magnesium, J. Electrochem. Soc., 163 (2016) C602-C608.
[61] R. Antaño-López, M. Keddam, M. Turmine, V. Vivier, The Impedance Response of a Passive Film Revisited by a Double Modulation Technique, ChemElectroChem, 6 (2019) 202-210.
[62] F. Cao, G.-L. Song, A. Atrens, Corrosion and passivation of magnesium alloys, Corros. Sci., 111 (2016) 835-845.
[63] S. Leleu, B. Rives, N. Causse, N. Pébère, Corrosion rate determination of rare-earth Mg alloys in a Na2SO4 solution by electrochemical measurements and inductive coupled plasma-optical emission spectroscopy, Journal of Magnesium and Alloys, (2019),
Fig. 1 : Current/potential curve obtained after 2 h immersion at Ecorr in a 0.1 molL-1 Na
2SO4solution (W = 1000 rpm, v = 0.167 mVs-1). The anodic and cathodic branches were obtained separately from
Ecorr (independent measurements) and the curves were corrected from the ohmic drop.
Fig. 2: Electrochemical impedance diagrams of Mg after different immersion times at Ecorr in a
0.1 molL-1 Na
2SO4solution (W = 1000 rpm): (a) raw impedance diagrams (Nyquist representation); (b) normalized impedance diagrams (each diagram was normalized by the maximum value of the real part of the impedance).
Fig. 3: Electrochemical impedance diagrams of Mg in a 0.1 molL-1 Na
2SO4solution (W = 1000 rpm) at Ecorr and for two anodic over potentials: (a) raw impedance diagrams (Nyquist representation); (b) normalized impedance diagrams (each diagram was normalized by the maximum value of the real part of the impedance).
Fig. 4 : Electrochemical impedance response of Mg after 35 h immersion at Ecorr in a 0.1 molL-1
Na2SO4 solution (W = 1000 rpm). (a) Variations of the phase angle (circle) and corrected phase angle from the ohmic resistance (triangle) as a function of the frequency; (b) variations of the absolute value of the imaginary part of the impedance as a function of the frequency.
Fig. 5: Complex-capacitance plot obtained from the electrochemical impedance response of Mg after 35 h immersion in a 0.1 molL-1 Na
2SO4 solution (W = 1000 rpm) – from the data presented in Fig. 4 using Eq. 3. The axis is not orthonormal to make the extrapolation to the C’ axis better visible.
Fig. 6: Oxide film thickness formed on the Mg surface as a function of the immersion time in a
0.1 molL-1 Na
2SO4 solution (W = 1000 rpm) – Each point of this curve corresponds to the analysis of the complex-capacitance plot as shown in Fig. 5.
Fig. 7: (a) Resistivity at the metal / oxide interface and (b) at the oxide / solution interface of the MgO thin film as a function of the immersion time for the corrosion of Mg in a 0.1 molL-1 Na2SO4 solution (W = 1000 rpm). These data were obtained from the fitting procedure assuming a power law model for the description of the interfacial capacitance (see text).
Fig. 8: Impedance response of Mg after 35 h immersion in a 0.1 molL-1 Na2SO4 solution (W = 1000 rpm) in a Nyquist representation (black circles) and fitting of the EIS response with the model (Eqs. 22 & 25) (red crosses). The fitted diagram corresponds to the following parameters: 𝑏6=
28.9 V-1, 𝑏
*= 11.8 V-1, 𝑏,*= 9.3 V-1, 𝑘6= 2.32 10,6N cm2s-1, 𝑘*= 9.35 10,* cm2s-1, 𝑘,*=
7.58 10,T cm2s-1, 𝑘
r= 8.16 10,r cm2s-1, 𝛿kFll= 22.2 µm, 𝛿FG = 6.7 nm, 𝐷 = 3 6 cm2s-1, 𝛽 = 10,œ mol
Fig. 9: Total thickness of the corrosion layer formed on Mg surface as a function of the immersion time in a 0.1 molL-1 Na2SO4 solution (W = 1000 rpm) – obtained from the fitting of the impedance
Fig. 10 : Sketch of the interface describing the different layers formed during the Mg corrosion. According to the impedance data analysis, the MgO layer thickness is about 5-7 nm (Fig. 7) and the Mg(OH)2 layer thickness is about 20-30 µm (Fig. 9).
MgO
Mg
Mg(OH)
2Electrolyte
Fig. 11: Active surface area as a function of the immersion time for Mg in a 0.1 molL-1 Na2SO4 solution (W = 1000 rpm). The relative surface area was calculated from the charge transfer resistance, determined from the diameter of the first capacitive loop of the impedance diagram for each immersion time (Fig. 2) and by using the first measurement performed after 2 h of immersion as reference value.
Fig. 12: Kinetic parameters as a function of the immersion time for the corrosion of Mg in a 0.1 molL-1 Na2SO4 solution (W = 1000 rpm) – the blue open circles correspond to the raw kinetic constant determined from the fitting procedure; the blue plain circles are the same data corrected from the surface variations (see text); the red squares correspond to the variation of the Tafel coefficient.