Publisher’s version / Version de l'éditeur:
Vous avez des questions? Nous pouvons vous aider. Pour communiquer directement avec un auteur, consultez la première page de la revue dans laquelle son article a été publié afin de trouver ses coordonnées. Si vous n’arrivez pas à les repérer, communiquez avec nous à PublicationsArchive-ArchivesPublications@nrc-cnrc.gc.ca.
Questions? Contact the NRC Publications Archive team at
PublicationsArchive-ArchivesPublications@nrc-cnrc.gc.ca. If you wish to email the authors directly, please see the first page of the publication for their contact information.
https://publications-cnrc.canada.ca/fra/droits
L’accès à ce site Web et l’utilisation de son contenu sont assujettis aux conditions présentées dans le site LISEZ CES CONDITIONS ATTENTIVEMENT AVANT D’UTILISER CE SITE WEB.
Paper (National Research Council of Canada. Institute for Research in
Construction), 1986
READ THESE TERMS AND CONDITIONS CAREFULLY BEFORE USING THIS WEBSITE. https://nrc-publications.canada.ca/eng/copyright
NRC Publications Archive Record / Notice des Archives des publications du CNRC :
https://nrc-publications.canada.ca/eng/view/object/?id=a078a6f4-732c-4695-ab28-c90850c6381f https://publications-cnrc.canada.ca/fra/voir/objet/?id=a078a6f4-732c-4695-ab28-c90850c6381f
NRC Publications Archive
Archives des publications du CNRC
For the publisher’s version, please access the DOI link below./ Pour consulter la version de l’éditeur, utilisez le lien DOI ci-dessous.
https://doi.org/10.4224/20377605
Access and use of this website and the material on it are subject to the Terms and Conditions set forth at
"Postflashover fires": an overview of the research at the National
Research Council of Canada (NRCC) 1970-1985
-
'
Research Conseil national Ser Canada de recherches Canada THJ. for lnstitut deN21d h in recherche en no.
1418
ition constructionc. 2 B r n G
- --/
"Posfflashover FiresH- An Overview of the
Research at the National Research Council
of Canada (NRCC) 7970
-
7985
by T.Z. Harmathy
I ,e,tj,~~!":gYZEeZ
Reprinted from Fire Technology
Vol, 22, No. 3, August 1986 p. 210-233
(IRC Paper No. 1418)
Price $2.00 NRCC 26641
Canad3
1111
3IIIIII
111
I[I~![
9 021II~I~~
IIIIII
0811
1
IIIIIII
&sum?
6tude du modsle du CNRC pour feux de compartiment en pleine
I combustion. Les mathdmatiques en jeu sont fort simples, mais
le modsle permet une simulation assez ddtaillb du processus d'incendie. I1 fournit une explication des conclusions voulant que le "contrble de la ventilation" soit lie au mecanisme de la pyrolyse et ne r'esulte pas de la raret'e de l'air dans le compartiment en feu, et que la retroaction thermique joue un rale secondaire dans la combustion (pyrolyse) des produits cellulosiques. L1originalitB de ce modsle tient aussi a l'introduction du concept de charge calnrifiqile normalis&. I1 s'agit d'une quantite scalaire qui depend de la chaleur globale absorb'ee par l'enveloppe du compartiment au cours de l'incendie, et est pratiquement inddpendante de 116volution des
- - - temperatures per,' *rd exp'erimentaleme 'I ddcrire de fact de charge calc convertir les resistance au facon a ce qu' incendie.
cd
des incendia de plastique1
"Postflashover FiresM-An Overview of
the Research at the National Research
Council of Canada (NRCC) 1970-1 985
T.
Z.
Harmathy
Reprinted from FIRE TECHNOLOGY Vol. 22, No. 3, August 1986
Pages 21 0-233
O 1986, National Fire Protection Association Batterymarch Park, Quincy, MA 02269, U.S.A.
Postflashover Fires
-
An Overview of the
Research at the National Research Council
of Canada (NRCC), 1970-1
985
T. Z. HARMATHY
National Research Council of Canada
(Paper submitted September 1985, accepted April 1986)
The NRCC model of fully developed compartment fires is dis- cussed. Although the mathematics involved is quite simple, it allows a rather comprehensive simulation of the fire process. The model of- fers an explanation for the findings that 'ventilation control' is related to the pyrolysis mechanism and is not a result of scarcity of air in the fire compartment, and that thermal feedback is of secondary importance in the "burning" (pyrolysis) of cellulosic fuels. Another feature of the model is the introduction of the normalized heat load concept. The normalized heat load is a scalar quantity that depends on the total heat absorbed by the compartment boundaries during the fire incident, and is practically independent of the temperature history of the fire. A simple explicit formula has been praposed and proved experimentally to describe the normalized heat load for real- world fires with fair accuracy. The normalized heat load concept of- fers a simple means for converting fire severities into fire resistance requirements, and makes it possible to design buildings for p r e scribed levels of structural fire safety. The potential of fires to spread by convection and the expected characteristics of fires of noncharring plastics are also discussed.
ESEARCH ON POSTFLASHOVER FIRES looks back on a history of
R
almost 30 years. Fourteen models of postflashover fires were reviewed in a recent paper;' there are probably a few more models not dealt with in the review. These models have, no doubt, been developed with the implicit purpose of checking the validity of various fire safety requirements pre- scribed by building regulations. Unfortunately, the work has not yet brought the result researchers have hoped for. Fire safety measures, espe- cially fire resistance requirements, are still laid down by the writers of building codes on the basis of their experience and judgment. Their reluc- Reference: T. Z. Harmathy, "Postflashover Fires - An Overview of the Research at the Na- tional Research Council of Canada (NRCC), 1970-1985." Fire Technology, Vol. 22, No. 3, August 1986. p. 210.Key Words: Postflashover fires, pyrolysis, cellulosic fuels, stoichiometry, char, reactor model, burning regimes, modeling, normalized heat load, thermal absorptivity.
Postflashover 211 tance to take advantage of the postflashover fire models is understandable to some extent. The contradictory concepts reflected by the existing models have not inspired much confidence. There has also been a lack of convincing evidence to demonstrate their accuracy.
By the end of the 1970s. research on postflashover fires lost momentum as increasing numbers of researchers turned their attention to the challeng- ing area of preflashover fires. Realizing that some important aspects of postflashover fires still awaited clarification, the NRCC researchers kept up their work on postflashover fires. The following is a summary of the more important results of that work.
Theories of postflashover fires have so far been based mainly on room- burn experiments conducted with cellulosic fuels. Consequently, the valid- ity of some of the conclusions to be discussed is, in a strict sense, restricted to those (by no means uncommon) fires which are fueled mainly by cellulosics.
A CRITIQUE OF THE WELL STIRRED REACTOR MODEL Postflashover fires are usually modeled (see the references listed under
1.6-1 in Table 1 of Reference 1) on the assumption that the conditions in a room containing a fully developed fire are fairly uniform; the burning com- partment is, for all intents, equivalent to a well stirred reactor. This way of modeling has no doubt been instrumental in the evolution of the popular concept regarding ventilation- and fuel-bed-controlled fires. According to this concept, the fuel burns at a rate allowed by the combustion stoichiometry: the higher the rate of entry of air into the compartment, the faster the rate of burning. There is, however, an upper limit to the rate of burning, which is determined by the quantity of fuel and the nature of the fuelbed.
The stoichiometric air requirement for burning cellulosics can be estimated from an approximate forpula for a typical wood:2
Assuming that all the carbon oxidizes into CO,, the stoichiometric air re-
quirement is 5.11 kg airlkg fuel. If a more realistic reaction scheme is
assumed, in which 40 percent of the carbon oxidizes into CO rather than CO,, the air requirement is 4.13 kg airlkg fuel.
I t is known from hundreds of experiments that in a poorly ventilated compartment the rate of "burning" of the fuel (or more accurately: its rate of mass loss), is proportional to the rate of inflow of air. Their ratio is ap- proximately
rate of inflow of air ,5.4
rate of mass loss of fuel
212 Fire Technology stoichiometric oxidation of the fuel within the confines of the compartment. Yet, observations indicate that external flaming through broken windows or open doors is a common occurrence rather than an exception. That there is enough air and yet, that the combustion process is not completed inside the compartment, is an indication that the mixing of the gaseous pyrolysis products and the air is not perfect. This conclusion clearly contradicts the well stirred reactor model.
The well stirred reactor model can be objected to on another ground. I t can be shown that some aspects of the burning* of cellulosic fuel cannot be explained unless the existence of distinct zones in the compartment is postulated.
What is loosely referred to as "rate of burning" is in fact rate of mass loss, which is an approximate measure of the rate of pyrolysis. In this light, the experimental finding concerning the rate of air flow and the rate of burn- ing should be correctly stated as follows: in poorly ventilated fires, the rate of pyrolysis of the fuel is controlled by the air flow rate. But the air flow rate can control pyrolysis, a heat activated process, only in a roundabout way: by controlling a reaction that evolves heat which, in turn, controls pyrolysis. There is only one reaction that fits into this scheme: the oxidation of char, the solid product of the pyrolysis.
The following model has been suggested to explain the approximate pro-
portionality between the rate of pyrolysis and the air flow rate.'.'."n poorly
ventilated fires, the air entering the compartment can feed the oxidation of char only in a relatively narrow zone near the ventilation opening (window, door) before the bulk of its oxygen content is depleted. As the pyrolysis of fuel progresses, this zone, while remaining roughly unchanged in size, gradually moves toward the end of the compartment opposite to the open- ing. In this way the rate of mass loss by the fuel remains roughly constant a s long as undecomposed fuel is present in the compartment.
According to this model, there is a zone of intense pyrolysis in the fuel bed, s2 (see Figure 1). and above that a flame zone, g2, where the volatile products of the pyrolysis intermix with air and combust. Next to these zones toward the opening are zone sl, where the oxidation of the collapsed fuel network, consisting mainly of char, takes place, and the gaseous zone, gl, occupied mainly by fresh air. Behind the zone of intense pyrolysis lies zone 93 where, under the effect of mainly radiant heat feedback, the fuel net- work pyrolyzes at a slow rate, and above that the gaseous zone, g3, con- sisting of a mixture of volatile pyrolysis products and combustion gases.
This model again contradicts the concept of the well stirred reactor. The question is now whether this model can be supported on experimental grounds. One should, of course, keep in mind that a model is only a practical tool for making a complex phenomenon accessible to mathematical treat- ment.
*
It has been suggested3 that the word "burning" be used as an umbrella term. covering the three types of reactions that go on simultaneously in a compartment on fie: pyrolysis, gas- phase combustion, and char-oxidation.Post flashover
.
- ,Figure 1. Modeling of fully developed compartment fires: char forming fuels.
M A S S F L O W R A T E O F A I R Ua k g s-'
214 Fire Technology Two experimental findings support the model. ,The first concerns the claim that it is the presence of oxidizing char that makes the pyrolysis of char forming fuels respond to the flow rate of air. Figure 2 shows the rate of mass loss of piles of five different fuels as a function of air flow rate through the pile.6 Three of the fuels are char forming: pine and two phenolic plastics; two, PMMA and polylite, are noncharring. Clearly, the rate of mass loss for char forming fuels increases almost in proportion to the air flow rate, while that for noncharring fuels is practically independent of it.
The second finding concerns the claim that in poorly ventilated fires a zone of intense pyrolysis exists, which moves slowly from the ventilation opening toward the opposite side of the compartment. Figure 3 shows tem- peratures recorded by thermocouples embedded in a pile of cellulosic fuel in a small scale room-burn experiment.' A shift of the temperature levels in- dicates the movement of the zone of intense pyrolysis. Similar observations have been made in full scale room-bum experiments.
THE ROLE OF THERMAL FEEDBACK
The fact that the oxidizing surface char plays a significant part in the burning process for cellulosics has a further implication. Clearly, if the fuel draws much of the heat needed for its pyrolysis from the oxidizing char, the rate of pyrolysis is not expected to depend strongly on thermal feedback to
TIME, rnin
Figure 3. Illustration of zonal pyrolysis in ventilation-controlled fires of cellulosics in a small scale room-burn experiment. Thermocouples: 1 - near window, 2 - middle o f room, 3 - near
Postflashover 215
the fuel from the fire gases and the hot compartment boundarie~.~ This ex-
pectation has been confirmed by experiments.
If the thermd feedback to the fuel were important, the pyrolysis would,
because of the predominance of radiation in the feedback, depend on some
higher power of the temperature in the burning compartment.
Yet,
hun-dreds
of experiments suggest that (at law ventilation) the relationship be- tween the rate of mass loss, R (kg s-'), and the air flow rate,U,,
(kg s-'), is of the formnot
R = const X U,,
R = f (U., temperature)
For noncharring fuels, such as many plastics, there is no such "built-in" heat source (char oxidation), and therefore their pyrolysis relies entirely on thermal feedback. For such fuels the temperature level in the burning com- partment is an important factor in the fire process.
THE TWO REGIMES OF "BURNING"
Returning to the claim of zonal burning, it is assumed that the size of the
zone of intense pyrolysis is approximately proportional to the rate of inflow
of air. One can expect, therefore, that if the air flow rate were gradually in- creased, a point would be reached where the zone of intense pyrolysis ex- tended over the entire fuel bed. Beyond t h a t point, the pyrolysis (rate of
mass loss by the fuel) wouId depend on the extent of char covered surfaces
(and in turn on the total surface area of the fuel), and would remain indepen- dent of the air flow rate.
Based on this reasoning, a model was formulated for the rate of mass loss by the fuel. With input from a multitude of experimental data, the rate of mass loss was expressed as a function of ventilation and of fuel surface area, so as to allow the separation of the ventilation-controlled and fuel-
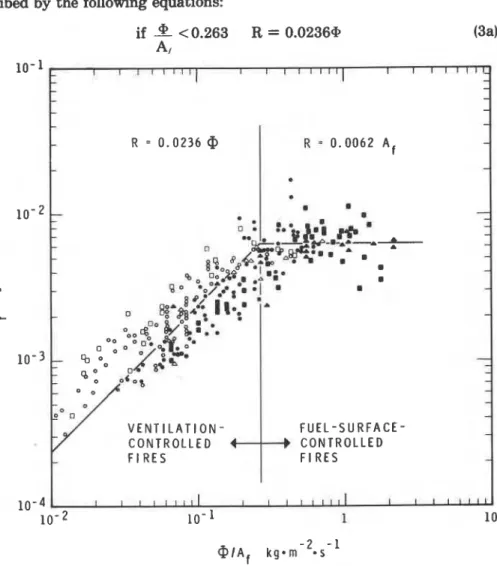
surface-controlled regimes of burning. In Figure 4 experimental values of
the rate of mass loss, R, are plotted against the ventilation factor, @ (kg s-I);
both variables are normalized by dividing them by the surface area of the fuel, A, (m2). As will be shown presently, the ventilation factor is closely related to the air flow rate, U,,
.
CP is minimum if the inflow of air is notaugmented by wind or draft. a,,, is related to the ventilation opening (win-
dow, door),
where
e ,
(kg m-3) is the density of air entering the compartment, Av (m2) isthe area of the ventilation opening, hv (m) is the height of the ventilation
opening, and g (m s - ~ ) is the gravitational constant.
Part of the ventilation opening is taken up by the outflow of fire gases (combustion and pyrolysis products), which in turn is related to the rate of
216 -Fire Technology
mass loss by the fuel. The following approximate relationship holds be- tween the flow rate of air, the ventilation factor, and the rate of mass loss:5
The considerable spread of the points in Figure 4 is due to two factors: (1) Many of the experimental results used were not reported in a way suitable for obtaining all the information needed for the plot; judgment often had to be used to fill the gaps; (2) to keep the model simple, the less important variables were deliberately disregarded, such as the porosity of the fuel bed,g and the temperature of the fire gases which, as discussed, is of second- ary importance in the pyrolysis of cellulosic fuel.
The full line curve in Figure 4 represents the "best fit." I t can be de- scribed by the following equations:
- I - -
-
- - - - - - --
V E N T I L A T I O N - F U E L - S U R F A C E - - C O N T R O L L E D C O N T R O L L E D - @ I A ~ kg0111 -2 . s - 1Figure 4. Correlation of experimental data/concening mte of consumption o f cellulosic fuel in fuUy developed compartment fires.
Postfilashover 217
The first of these equations describes the rate of mass loss by the fuel in the ventilation controlled regime; the second, in the fuel surface controlled regime.
The surface of the fuel, A , can be expressed with the aid of the specific surface area, cp (m2 kg-'), and the total mass of the fuel, G (kg),
The fuel mass is usually calculated from statistical data on the specific fire load, L (kg m-2), and the floor area-of the compartment, AF (m2),
Table 1 gives some information on the spec@ fire load in various occupan- cies, based on Swedish data.1° In the Table, L(kg m-2) is the mean for L, and
a, (kg m-2) is the standard deviation.
I t can be seen that the existence of ventilation controlled and fuel sur- face controlled regimes has nothing to do with combustion stoichiometry; only fires involving char forming fuels can exhibit such dual behavior.
THE MODELING OF POSTFLASHOVER FIRES
Modeling implies scrutinizing the input variables, keeping those that seem to be the most important, and disregarding the rest. In the NRCC m ~ d e l , ~ , " . ' ~ there are six input variables:
AF floor area of compartment, m2
A, total area of compartment boundaries, m2 hc height of compartment, m
a c thermal absorptivity (thermal inertia) of compartment bound- aries, J rn-2s-1'2K-1
cP ventilation factor, kg s-'
L specific fire load (mass of fuel per unit floor area), kg m-2. TABLE 1. Information on fire load 'O
Specific Fire Load kg m-'
QL
L Standard
Occupancy Mean Deviation
Dwelling 30.1 4.4
Office 24.8 8.6
School 17.5 5.1
-
Hospital 25.1 7.8218 Fire Technology
The specific surface area of the fuel is not included in this list. I t has been taken as 0.13 m2 kg-', a quantity that applies to a wide range of con- ventional furniture.
Values for the first three variables are available from the building plans; the fourth is known from the planned use of building materials. The last two, ventilation factor and specific fire load, are random variables. In laboratory experiments these two are controlled (the first a t its minimum value; see Equation 1) so that the output (process) variables that characterize the fire can be derived without resorting to statistical methods. An analysis of the problem7." will reveal six process variables:
U, rate of inflow of air, kg s-' R rate of mass loss of fuel, kg s-'
Q rate of evolution of heat from the fuel within the compartment, W T, average temperature of gases in zones g2 and g3, K
q average heat flux penetrating the compartment boundaries, W m-* T duration of the fully developed fire, s.
Of these process variables, the first five are, in general, time dependent. To define them as functions of time, one needs six equations. These equa- tions can then be solved by employing a numerical follow-up scheme. Three energy balances can be written: one over the ventilation opening, another over the fuel surface, and a third over the surface of the compartment. The other three equations are: one for the rate of inflow of air (Equation 2), a sec- ond for the rate of evolution of heat from the fuel, and a third for the dura- tion of a fully developed fire. In general, these six equations are coupled.
The NRCC has used a simple technique for solving the problem.',"" First, based on the argument that the first three of the six process variables, U,, R, and Q, are not strongly time dependent, and that the nature of the problem does not require an accuracy higher than what can be obtained by deriving average values for the next two process variables, T, and q, the need for a follow-up scheme has been eliminated. Second, drawing on the approximation expressed by Equations 3a and 3b, R has been decoupled from all process variables except U,. Finally, a factor, 6 (to be de- fined empirically), has been introduced to quantify that part of the fuel energy which is released inside the compartment boundaries. With these simplifications the problem has collapsed into the simultaneous solution of two equations, one for
q
(W m-'), the surface and timeaveraged heat flux penetrating the compartment boundaries, and another for T, (K), the space and time averaged temperature of fire gases.I
THE NORMALIZED HEAT LOAD CONCEPTOf the six process variables, two are of particular interest:
q
and T. Theproduct
q~
is the total heat absorbed, per unit area, by the compartment boundaries during the fire incident. This product has been referred to as "heat load."13 Of special interest is a parameter referred to as "normalized heat load," H' (sl"K). I t is defined as\ I Postflashover 219
I
,
-
q7 H' = - 6 c ment fires, as opposed to standard test fires.16)
i
where the prime is used as a reminder that H relates to real-world compart- The more general definition of the normalized heat load is"
I
H = & c l b d t (7) !
where t (s) is time. The normalized heat load is a scalar quantity which, as
1
will be seen. is excellently suited for characterizing the severity of fires.
1
For two decades the term "fire severity" has been used without a clear- cut definition, with the tacit understanding that it has something to do with the destructive potential of fires. The way fire resistance tests are con-i
ducted has no doubt been instrumental in the widespread practice of regard- ing the temperature history of a fire as the descriptor of its severity. The temperature of the fire gases in an enclosure used to be looked upon as the embodiment of the fire itself, and the boundaries of the enclosure merely as passive participants in the fire, responding to the temperature conditionsi
imposed upon them. This simplistic view can be objected to on two grounds.i
First, a fire is more than just the presence of hot gases in an enclosure; it is a I process involving a strong and complex interaction between the fire gases1
and the enclosure boundaries. Second, since the thermal attack of the firea I I 4 6 5 - 0 r E *
-
-
I?
- -9 rE L. 4 3'
2 2)
o; 1;
1;
- 1;
I
!
5
1 0 a , r l / 2 T l / 2 a , K l / 2 T l / 2I
Figure 5. Dimensionless presentation o f .the Figure 6. The influence o f the nonconstancy maximum temperatures attained a t apoint in of the penetration heat flu on the maximum a semi-infi nite solid temperature attained a t a point in a semi-
infinite solid
I
I , , I I I I I C A S E A C A S E B C A S E C ,,,OO'];i qo 0 -L
".. - 5q f i ii-
1;.
-
- c C aj
- i - 0.1 - -1
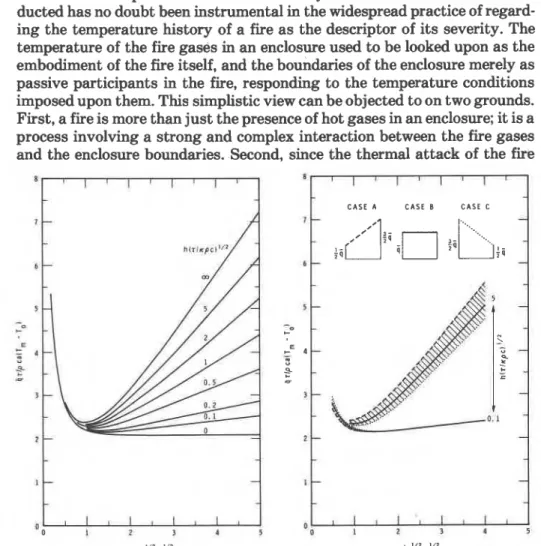
220 Fire Technology gases on the enclosure boundaries is mainly by radiative heat transfer (which depends on the fourth power of the temperature of fire gases), the first power temperature history of the fire gases has no direct relevance to the destructive potential of the fire.To understand the significance of fire severity, the following problem was studied:'" semi-infinite solid is penetrated by a heat flux
q
for a period7; then the solid is allowed .to cool. Using dimensional analysis, a large
number of computer generated results were correlated by an equation of the following form:
where a (m) is a distance in the solid from the surface,
T,
(K) is the max- imum temperature reached a t that distance, To (K) is the initial tempera- ture, Q (kg m+) is the density of the solid, c (J kg-'K-') is the specific heat of the solid, x (mass-') is the thermal diffusivity of the solid, and h (W m-' K-') is the heat transfer coefficient of cooling after heat penetration has ceased.A plot of Equation 8 is shown in Figure 5. Apparently, at a distance cor- responding to a Fourier number between 0.8 and 1.2, the maximum temper- ature reached is practically independent of the rate of cooling, a s characterized by the group h(~"~l&iic). Picturing now the solid as the boundary of an enclosure, one will see that this distance into the solid cor- responds roughly to the location of the important load bearing components (e.g., steel reinforcing bars in concrete).
The curves in Figure 5 were derived for the case of constant heat flux into the solid. What happens if the heat flux is variable? To answer this question, some further studies were conducted with heat fluxes varying linearly, as illustrated in Figure 6. The results indicate that, within reasonable limits, the heat flux history has only a minor effect on the max- imum temperatures reached at any point inside the solid. This finding im- plies that the harm from the exposure of a solid to high temperatures depends mainly on the total heat absorbed by it, and is practically indepen- dent of the temperature history of the medium that imparts heat to the solid.
Figures 5 and 6 show that for Fourier numbers between 0.8 and 1.2
-
This equation can be rearranged into the following form:
Post flashover 221
Equation 10 suggests that the maximum temperature rise at a critical distance below the enclosure boundary depends on two factors: the nor- malized heat load and the thermal diffusivity of the boundary. For a given type of boundary (i.e., for a given value of x ) the maximum temperature rise will depend on H only. The normalized heat load can, therefore, be looked upon as a measure of the detrimental effect of various fires on one given type of enclosure boundary. With this interpretation, it can be used for com- paring the performance of an enclosure boundary in two different fires; e.g., in a real world fire and a test fire.$
The theorem of uniformity of the normalized heat loadI5 states that for an enclosure bounded by different materials, the normalized heat load is ap- proximately the same for each boundary and that, in addition, it is equal to the normalized heat load for the enclosure as a whole. This theorem is ex- pressed by the following equations:
7 7
I
J
qdt q,dt =-L
JT
q,dt = . ..
G c a z z 2 ,, where and A, = A l + A 2 + . . .and the numerical subscripts indicate values related to the various bound- ary surfaces.
Since the normalized heat load concept has been based on studies of heat penetration into semi-infinite solids with constant thermal properties, some researchers have questioned its general applicability. Recent studies (not yet reported) have offered the following conclusions:
1. The normalized heat load is a measure of the maximum temperature rise a t some critical depth in a construction, regardless of the surface geometry of the construction. The actual value of the maximum tempera- ture rise is, of course, dependent on the surface geometry. For example, it is higher at a location below a rectangular comer than at another location below a plane surface. One is reminded, however, that the utility of the nor- malized heat load is in facilitating the comparison of the performance of a given construction in various fires; it is, per se, not a failure criterion.
2. Under practical circumstances the finite thickness of the enclosure boundaries has hardly any effect on the value of the normalized heat load. 3. The most common use of the normalized heat load is to relate the per-
'
formance of a given construction in a real world fire to its performance in a
3 A cautionary note: the normalized heat load concept cannot be applied to compartment
boundaries containing important load bearing components in, or in the immediate vicinity of, the enclosure surface. For example, it cannot be applied to enclosures built with unprotected steel.
222 Fire Technology
standard test fire. I t is a fair assumption that some factors not taken into consideration in quantifying H in the two fires; e.g., the nonconstancy of the thermal properties or the presence of moisture, will lead to errors of similar magnitude in two fires characterized by equal values of H.
NORMALIZED HEAT LOAD IN REAL WORLD FIRES The model outlined in the section "Modeling of Postflashover Fires" was used to develop information on the normalized heat load in real world fires. With the aid of the iterative technique mentioned briefly in that section and described in detail in Reference 11, a large number of solutions were generated and used to find, by trial and error, an explicit expression for H'. That expression is as follow^:'^
where
0.79
d
m
whichever is less 1
The meaning of 6 in these equations is not clear-cut. For poorly ven- tilated fires it represents roughly that part of the fuel energy which is re- leased inside the compartment.' For well ventilated fires it is merely a cor- rection factor which seems to improve the accuracy of Equation 14.
Seventeen full scale room burn experiments have so far been conducted16 with the purpose of obtaining answers to two questions: (1) does the NRCC model predict reasonably well the normalized heat load imposed on the room boundaries by real world fires? and (2) does the theorem of uniformity of normalized heat load hold under practical circumstances?
The experimental compartment was a cinder block room. One wall was fitted with either a door or a window. The walls, ceiling, and floor were lined with panels of selected materials. The dimensions of the room were: floor, 2.4 m by 3.6 m; height, 2.6 m. The total surface area was about 48 mZ.
Eight wooden cribs were used for fuel. Made from pine sticks, 4 by 4 by
84 cm, they were supported on bricks 10 cm above the floor. To drive the fire to the fully developed stage as quickly as possible, all the cribs were ignited
TABLE 2. Thermd absorptivities of lining materials used in
room bum experiments.
Jrcec
Material !J m-2s-'12K-1!
Normal weight concrete 2192
Brick 1260
Gypsum wallboard 742
Insulating firebrick 425
Fiberfrax board 131
Postflashover 223
simultaneously. The quantity of fuel per unit floor area was chosen to be representative of that found either in hotel rooms, 15 kg m-2, or in offices, 27 kg m-2.
Brick, insulating firebrick, fiberfrax board, gypsum wallboard, and nor- mal weight concrete were used as lining paneld These materials were selected to span the whole range of thermal absorptivities likely to be en- countered in buildings. Their thermal absorptivities are listed in Table 2. Brick, insulating firebrick, and fiberfrax board were used most frequently on account of their excellent thermal stabilities.
A summary of the experiments and the experimental results is shown in Table 3. In each experiment a t least two of the five materials were present as lining. In runs A-D the floor and ceiling were lined with fiberfrax and the walls with brick; in E-J, the floor and ceiling were lined with fiberfrax, the two long walls with brick, and the two short walls with insulating firebrick; in
K-M,
the floor and ceiling were lined with fiberfrax and the walls with in- sulating firebrick; and in N-Q, the ceiling was lined with fiberfrax, the floor with normal weight concrete, and the walls with gypsum wallboard. The overall thermal absorptivity of the experimental room is also given in Table 3. These values were calculated from Equation 12, assuming that half the floor area was lined with wood.To determine the normalized heat load, nine thermocouples were in- stalled approximately one Fourier number deep into each of the walls, the ceiling, and the floor.
The ventilation opening was chosen to be roughly 9.12, or 16 percent of the compartment floor area. In two cases, experiments G and J , the opening was a doorway; in all other cases it was a window.
The fire load, the overall thermal absorptivity of the boundaries, and the size of the window were varied from test to test, as shown. The last four col-
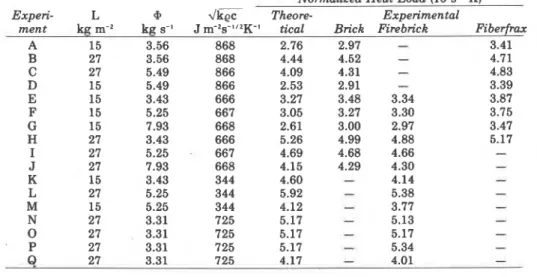
TABLE 3. Information on room bum experiments.
Normalized Heat Load (104s'/'K)
Exneri- L 9 w'k? Theore- Exnerimental
i
224 Fire Technologyumns in Table 3 give the values of the normalized heat load, both as
calculated from Equation 14, and as calculated from the maximum tempera-
ture rise in three different lining materials using Equation 10, Clearly, there
is fair agreement between the theoretical and the experimental values. The agreement was even better if, instead of Equation 14, the iterative tech- nique was used to calculate the six process variables and, in turn, the nor- malized heat load.
The experimental values of the normalized heat load with respect to brick, insulating firebrick, and fiberfrax panels, are compared in Figures 7,
i- 8 and 9 with theoretical values. The agreement is within f 10 percent for
N O R M A L I Z E D H E A T L O A D N O R M A L I Z E D H E A T L O A D C ( U N I T S l o 4 s112 K t ( U N I T S s112. K )
_
I N S U L A T I N G F I R E B R I C K - 0 1 2 3 4 5 6 1 T H E O R E T I C A LFigure 7. Comparison of measured normal- ized heat loads and model predictions for brick. Points falling between the dashed lines represent an agreement better than +lo% be-
tween experiment and theory.
N O R M A L I Z E D H E A T L O A D ( U N I T S l o 4 ill2 K I
T H E O R E T I C A L
Figure 8. Comparison of measured normal- ized heat loads and model predictions for in- sulating firebrick. Points falling between the dashed lines represent an agreement better than f 10% between experiment and theory.
N O R M A L I Z E D H E A T L O A D ( U N I T S l o 4 s112 K )
T H E O R E T I C A L M A T E R I A L 2
Figure 9. Comparison of measured normal- Figure 10. Comparison of measured normal- ized heat loads and model predictions for ized heat loads absorbed by different lining fiberfrax board. Points falling between the materials. Fiberfrax compared with insulat- dashed lines represent an agreement better ing firebrick (A), fiberfrax with brick (O), in-
Postflaehover 225
both brick and insulating firebrick, despite the large differences in their thermal properties. For fiberfrax board the agreement is somewhat poorer,
f 20 percent.
All but one of the experiments described in Table 3 represented ventila- tion controlled fires. Seven more experiments have been carried out since the completion of the first series, with conditions set to produce fuel surface controlled fires. The results of these latter experiments (not yet reported) have revealed that the predictive capability of the NRCC model is somewhat lower under such conditions.
The information presented in Figure 10 proves the approximate validity of the theorem of uniformity of normalized heat loads. In this figure nor- malized heat loads, as determined from the maximum temperature rise, are compared for three pairs of lining materials: fiberfrax and insulating firebrick, fiberfrax and brick, and insulating firebrick and brick. Values for the material with the lower thermal absorptivities are plotted along the y-axis.
There are some signs, however, that the accuracy yielded by the NRCC model, using either the iterative technique or the approximate expression, Equation 14, is somewhat fortuitous. The problem is the 6 factor. 6 was originally introduced to quantify the fraction of energy released by combus- tion of the pyrolysis gases inside the compartment. On the reasoning that this fraction is governed by the rate of entrainment of air into the pyrolysis gases, two sets of semi-empirical equations2 were suggested for 6.' Results
of a series of experiments performed in seemed to support the validity of these equations. Unfortunately, the room burn experiments reported in Table 3 did not fully bear out their validity. Flaming above the ventilation opening was observed in all experiments, even though the semi- empirical equations yielded, in some cases, a value of 1, suggesting that the combustion of the combustion gases was completed inside the room.
At this time, inadequate understanding of the energy release outside the fire compartment is the weakest point of all models of postflashover fires.
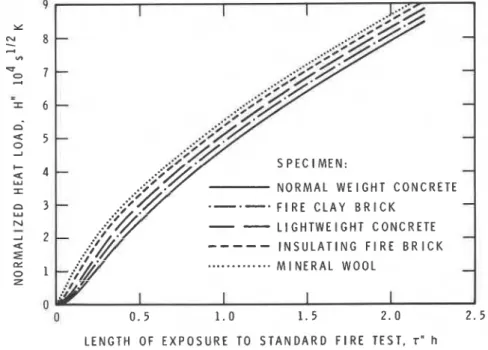
NORMALIZED HEAT LOAD IN STANDARD FIRE TESTS Since the temperature history of standard test fires is defined and unique, one would expect that the normalized heat load for standard test fires, H" (two primes are used as a reminder that H relates to standard test fires) will depend on a single input variable: the duration of the test fire, rN(h). The curves in Figure 11 show that the thermal absorptivity of the test specimen has also some effect on the normalized heat load. (In addition, there are some other factors of lesser importance; they are discussed in Reference 15.) Since the curves represent specimens with a wide range of thermal absorptivities, from 86 (mineral wool) to 2200 J m-2s-"ZK-' (normal
t
Equation 15 represents one of these sets. It was originally recommended for ventilation con- trolled fires only. When used in connection with Equation 14,6 becomes basically an empirical correction factor.226 Fire Technology
weight concrete), one may conclude that the effect of thermal absorptivity on H" is not very significant, and that representing the normalized heat load versus testing time relation with a single curve is, therefore, an accept-
able approximation. Curve 1 in Figure 12 is such a curve. I t was calculated
on the assumption that the test is performed in a high efficiency furnace.
For real werld test furnaces the curve will follow a flatter course. Curve 2
in the same figure represents the normalized heat load versus testing time relation for the NRCC floor test furnace. That curve can be approximated by the following equation:
where 7'' is in hours.
DESIGNING FOR A PRESCRIBED LEVEL OF STRUCTURAL FIRESAFETY
The fire resistance of a compartment boundary is quantified by r", the duration of a test fire successfully withstood by a specimen of that compart- ment boundary. Clearly, the boundaries for a compartment subject to a nor- malized heat load H' should be selected (from among fire tested construc-
tions) in such a way as to satisfy the condition H" r H'. I t appears,
therefore, that finding the fire resistance requirement is as simple as
substituting H' (real world fire) for H" (test fire) in Equation 16. In reality,
-
-
-
-
-
-
-
S P E C I M E N :-
N O R M A L W E I G H T C O N C R E T E F l R E C L A Y B R I C K-
--
L l G H T W E I G H T C O N C R E T E-
---
I N S U L A T I N G F I R E B R I C K. . .
.
. . . .
.
M I N E R A L W O O L-
L E N G T H O F E X P O S U R E T O S T A N D A R D F l R E T E S T , T" hFigure 11. The H" versus 7" relation for standard fire tests conducted in high-efficiency fire
Post flashover 227 the problem is more complex. As previously mentioned, in Equation 14 the
specific fire load, L, and the ventilation parameter, (P, are random variables,
and consequently H' is also random. Furthermore, due to differences in fur- nace construction, heating fuels, workmanship of test specimens, and loading and restraining conditions, the fire resistances yielded by standard fire tests (as characterized by the duration of test fire, 7 " ) are subject to
some uncertainties.
With respect to the effect of ventilation, a glance at Equation 14 will reveal that H' decreases monotonically with an increase in the ventilation
factor, (P. Since fire safety decisions must be made on the assumption of
reasonably adverse conditions, it would seem logical to select
a,,,
(Equation1) as the design value for (P. This selection is supported by the finding that
H' at (P,,, is rarely more than twice that which may arise at very large
values of (P, such as those at draft augmented ventilation.
The other random variable is the specific fire load, .L. Although it is possible to find an extreme value for L (assuming that the compartment is filled up from floor to ceiling with combustibles), using this value (about 900
kg m-2) in the design would hardly be justified. According to statistical data
(see Table I), the mean specific fire load in a building is usually between 15 and 30 kg m-2, and rarely exceeds 100 kg m-2. Clearly, the design should be based on probabilistic considerations.
Regarding the randomness of the results of standard fire tests, T " , a re-
cent ASTM study19 indicated that the coefficient of variation for T" is
L E N G T H O F E X P O S U R E T O S T A N D A R D T E S T F I R E , T " h
Figure 12. Correlations between H" and r" fir standard fire tests. Curve 1 - high-efficiency furnace; Curve 2 - floor test furnace in DBR/NRCC labomtory (estimated).
228 Fire Technology
somewhere between 0.02 and 0.15, depending on the type of construction.
The task, then, is to assign a design value to the fire resistance require-
ment, rd (h), so as to ensure that in a real world fire the probability of failure
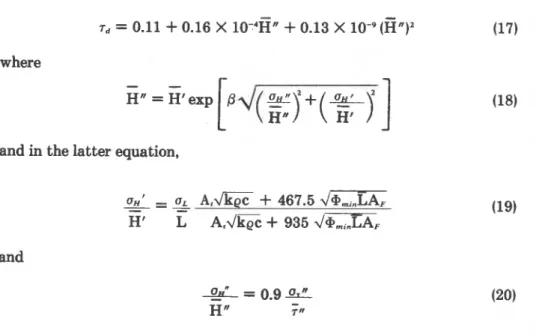
of the compartment boundaries will remain below a specified level. The following design formulas have been derived,'O using the technique referred to as second-moment a n a l y s i ~ : ~ ' , ~ ~
where
/34(5J+(2$-J] (18)
and in the latter equation,
and
where the a's are standard deviations for the variables shown in the
0
0.001 0.01 0.1
" f
Postflashover 229
subscripts, the bars over the symbols indicate mean values, and 0 is a factor (dimensionless), the value of which depends on the specified allowable failure probability, P, (dimensionless), as shown in Figure 13. 0 ~ ~ 1 2 " is the coefficient of variation for the results of standard fire tests and, as men- tioned before, usually 0.02
<
0,~/?"<0.15.In keeping with the earlier recommendation, the minimum value of the ventilation factor,
a,,.,
is used as the design value in Equation 19. Figure 14 shows the effect of increasing ventilation on the fire resistance requirement for a particular construction. For a 5 percent allowable failure probability, the fire resistance requirement for this construction was calculated as 1.23 h. The figure suggests that drafts or windy conditions may lower the fire resistance requirement by as much as 50 percent.CONVECTIVE SPREAD POTENTIAL
So far, the potential of fires of cellulosics to spread by destruction has been discussed, together with the design procedure to counter such a spread by using fire resistant compartment boundaries. I t is well known, however, that fires rarely spread by successive destruction of the compartment boundaries. The most common mechanism of spread is convection: the ad- vance of flames and hot gases through windows, open or burned out doors, or any other opening. Irrespective of the nature of the surface lining materials in the spaces adjoining the fire compartment, fuels and conditions conducive to massive combustion of pyrolysis gases outside the compart-
Figure 14. The effect of ventilation on the fire resistance requirement at a given failure probability.
230 Fire Technology ment boundaries present a very real danger from the point of view of fire spread.
A factor has been introduced to characterize the convective spread
potential of fires. I t is denoted by p and defined as the ratio:
C c = rate of evolution of heat outside fire compartment (21)
total rate of heat evolution from fuel
Once the process variables for the fire are known (from calculations using
the iterative technique, as described in Reference 11). p can be evaluated.
For cellulosic fuel, an approximate expression for p is
Although the potential of fires to spread by convection can be quantified by the p-factor, there is as yet no established method on how to use its value in fire safety design. An acceptable approach would be to require some extra
measures of countering the convective spread potential whenever p exceeds
some specified limit, say 0.4. A number of such measures have been de- scribed in Reference 23.
FIRE INVOLVING NONCELLULOSIC FUELS
For reasons discussed in the section "The Role of Thermal Feedback," char forming plastics can be expected to behave on the whole similarly to
Figure 15. Modeling of filly developed compartment fires: pool fires of liquids and
Post flashover 231
cellulosics. One can expect, therefore, that (1) the rate of mass loss by the
fuel will not strongly depend on the temperature level in the fire compart- ment, (2) in calculating the process variables, the rate of mass loss may be decoupled from all the process variables except the flow rate of air, and (3) the burning of the fuel will be ventilation controlled or fuel surface con- trolled, depending on the level of ventilation.
The development of a mathematical model for noncharring plastics seems to be a challenging problem. Since the pyrolysis of such materials relies on thermal feedback from the hot gases and compartment boundaries, the rate of mass loss by the fuel can be expected to depend on that part of the fuel surface which sees the hot gases and compartment boundaries, rather than, (as with cellulosics) on the total fuel surface.
A model has been suggested5 for a very simple case: the burning of a plastic fuel in a pool configuration on the floor of a compartment. Figure 15 shows the main features of the model. Again, the existence of six zones has been postulated which are somewhat similar to those discussed in connec-
tion with the model for cellulosics (see Figure 1). The main difference is that,
although zone s l is still the zone of intense pyrolysis, the pyrolysis of the fuel in zone s2, under the effect of (mainly) radiant feedback from the hot gases and compartment boundaries, is not insignificant. The result is a very high rate of production of pyrolysis gases, especially if the pyrolysis tem- perature of the fuel is relatively low.
Since the entry of air into the fire compartment is restricted by the ven- tilation opening, a large portion of the pyrolysis products will, by necessity, leave the compartment uncombusted. Although, from the point of view of the heat load on the boundaries of the fire compartment, it is advantageous to have a major portion of the pyrolysis gases burn outside the compart- ment, outside burning is clearly extremely dangerous and undesirable from the point of view of convective fire spread.
The model developed for pool burning5 was used to generate information on the spread potential of noncharring plastics, as compared with cellulosics. The following conclusions have been drawn:
1. From the point of view of potential for destructive spread, fires of
cellulosics are usually more dangerous than fires of noncharring plastics. From the point of view of potential for convective spread, the opposite is true.
2. For both types of fuel, the destructive spread potential decreases with increasing ventilation.
3. The convective spread potential of fires decreases with increasing ventilation if the fire load consists of noncharring plastics, and in- creases with increasing ventilation if the fire load consists of cellulosics.
Whether these conclusions are justifiable will be seen when the results of a series of room burn experiments using noncharring plastics, now in the planning stage, become available.
Fire Technology
a distance in the solid from the surface, m A area, surface area, m2
c specific heat, J kg-'K-'
g gravitational acceleration, -9.8 m s-I
G total mass of fuel, kg h (with subscript) height, m
h (without subscript) heat transfer coefficient, Wm-'K-'
H normalized heat load, sW2K
H' normalized heat load for real world fires, s'12K
-
H' mean of H', sw2K
H" normalized heat load for test fires, sIJ2K
tt mean of H", s'12K
k thermal conductivity, W m-'K-'
JTGjZ thermal absorptivity (thermal inertia), J m-2s-'J2K-1
L_ specific fire load, kg m-' L mean of L, kg m-2
q_ heat flux penetrating the surface, W m-2 time and space averaged value of q. W m-2
$
rate of heat evolution from the fuel within the compartment, W R rate of mass loss (rate of "burning"), kg s-'t time, s T temperature, K
time and space averaged value of T, K U mass flow rate, kg s-'
GREEK LETTERS
(loosely) fraction of energy of gaseous pyrolysis products released within the com- partment, dimensionless
thermal diffusivity, m2s-'
factor characterizing the convective spread potential of fires, dimensionless density, kg m-'
standard deviation, various dimensions
duration of fully developed fire, duration of exposure to a heat flux
q,
s duration of test fire (= fire resistance time), hmean of T", h
specific surface of fuel, m2kg-' ventilation factor, kg s-I
SUBSCRIPTS of air entering the compartment
of the compartment design of the fuel of the floor pertaining to H' pertaining to H"
of the fire gases in zones g2 and g3 pertaining to L
maximum minimum initial
total for the compartment of the ventilation opening pertaining to T"
Post flashover
233
REFERENCES
' Harmathy, T. Z., and Mehaffey. J. R., "Post-flashover Compartment Fires," Fire and
Materials, Vol. 7, 1983. p. 49.
' Harmathy, T. Z., "A New Look a t Compartment Fires," Parts I and 11. Fire Technology,
Vol. 6, 1972, pp. 196. 326.
'
Harmathy, T. Z., "Burning. Pyrolysis, Combustion and Char-oxidation: Need for Clari-fying Terminology," Fire and Materials, Vol. 8, 1984, p. 224.
' Harmathy, T. Z., "Mechanism of Burning of Fully-developed Compartment Fires,"
Combustion and Flame, Vol. 31. 1978, p. 265.
Harmathy, T. Z., "Effect of the Nature of Fuel on the Characteristics of Fully-developed
Compartment Fires," Fire and Materials. Vol. 3. 1979, p. 49.
Harmathy, T. Z., "Experimental Study of the Effect of Ventilation on the Burning of
Piles of Solid Fuels," Combustion and Flame, Vol. 31, 1978, p. 259.
Harmathy, T. Z., "Some Overlooked Aspects of the Severity of Compartment Fires,"
Fire Safety Journal, Vol. 3, 1981. p. 261.
Harmathy, T. Z., "The Role of Thermal Feedback in Compartment Fires," Fire Technol-
ogy, Vol. 11, 1975, p. 48.
Nilsson, L.. "The Effect of the Porosity and Air Flow Factor on the Rate of Burning for
Fire in Enclosed Space." National Swedish Building Research Summaries. R22, 1971.
l o Pettersson, 0.. Magnusson, S. E., and Thor, J., "Fire Engineering Design of Steel Struc-
tures," Swedish Institute of Steel Construction, Stockholm, Bulletin 50, 1976.
" Harmathy, T. Z., "Fire Severity: Basis of Fire Safety Design," in Fire Safety o f Concrete
Structures, ACI Publication SP-80, American Concrete Institute, Detroit, 1983, p. 115.
'' Mehaffey, J. R. and Harmathy. T. Z., "Assessment of Fire Resistance Requirements,"
Fire Technology, Vol. 17, 1981, p. 221.
l 3 Harmathy, T. Z., "The Possibility of Characterizing the Severity of Fires by a Single
Parameter." Fire and Materials, Vol. 4, 1980, p. 71.
Harmathy, T. Z., and Mehaffey, J. R., "Normalized Heat Load: A Key Parameter in Fire
Safety Design," Fire and Materials, Vol. 6, 1982. p. 27.
l 5 Harmathy, T. Z., "The Fire Resistance Test and I t s Relation t o Real-world Fires," Fire
and Materials, Vol. 5, 1981, p. 112.
l6 Mehaffey, J. R., and Harmathy. T. Z.. "Thermal Response of Compartment Boundaries
o f Fire," presented a t the First International Symposium on Fire Safety Science, National
Bureau of Standards, Gaithersburg, MD, October 1985.
l 7 Butcher, E. G., Chitty. T. B., and Ashton, L. A., "The Temperatures Attained by Steel in
Building Fires," Fire Research Technical Paper No. 15. Joint Fire Research Organization, En-
gland 1966.
'Wutcher. E. G., Bedford, G. K., and Farden, P. J., "Further Experhmts on Tempera-
tunes Reached by Steel in Buildings," Paper 1, Proceading~ of Symposium held a t Fire
Rasearch Station, January 1967, Joint Fire Remarch Organization, England, 1968. p. 1.
I" ASTM E5.11 task group on "Repeatability and Reproducibility of Retadts of ASTM
E-119 Fire Tests,'* Research Raport No. RR: E5-1003 available from ASTM, Philadelphia, PA,
1982.
'O Harmathy, T. Z., and Mehaffey, J. R., "Design of Buildings for Prescribed Levels of
Structural Fire Safety." in Fire Safety: Science and Engineering, ed. T. Z. Harmathy. ASTM
STP 882. Philadelphia, PA 1985.
" Zahn, J. J., "Reliability-based Design Procedures for Wood Structures," Forest Prod-
ucts Journal, Vol. 27, 1977, p. 21.
" Woeste, F. E., and Schaffer, E. L., "Second Moment Reliability Analysis of F i e Ex-
posed Wood Joist Floor Assemblies," Fire and Materials, Vol. 3, 1979, p. 126.
" Harmathy, T. Z.. "Design t o Cope with Fully Developed Fires," in Design of Buildings
for Fire Safety, eds, E. E. Smith and T. Z. Harmathy, ASTM STP685, Philadelphia, PA, 1979,
T h i s p a p e r i s b e i n g d i s t r i b u t e d i n r e p r i n t form by t h e I n s t i t u t e f o r Research i n C o n s t r u c t i o n . A l i s t of b u i l d i n g p r a c t i c e and r e s e a r c h p u b l i c a t i o n s a v a i l a b l e from t h e I n s t i t u t e may be o b t a i n e d by w r i t i n g t o t h e p u b l i c a t i b n s S e c t i o n , I n s t i t u t e f o r R e s e a r c h i n C o n s t r u c t i o n , N a t i o n a l Research C o u n c i l of C a n a d a , O t t a w a , O n t a r i o , K1A 0R6. Ce document e s t d i s t r i b u 6 s o u s forme de t i r 6 - 3 - p a r t p a r 1 ' I n s t i t u t de r e c h e r c h e e n c o n s t r u c t i o n . On p e u t o b t e n i r une l i s t e d e s p u b l i c a t i o n s d e 1 ' I n s t i t u t p o r t a n t s u r l e s t e c h n i q u e s ou l e s r e c h e r c h e s e n m a t i k r e d e b a t i m e n t e n 6 c r i v a n t 3 l a S e c t i o n d e s p u b l i c a t i o n s , I n s t i t u t de r e c h e r c h e en c o n s t r u c t i o n , C o n s e i l n a t i o n a l d e r e c h e r c h e s du Canada, Ottawa ( O n t a r i o ) , K1A 0R6.