CLEARANCE PRICING OPTIMIZATION AT ZARA
By
Rodolfo Carboni Borrasé
B.S. 2004, Electrical Engineering, University of Costa Rica
Submitted to the MIT Sloan School of Management and the Department of Electrical Engineering and Computer Science in Partial Fulfillment of the Requirements for the Degrees of
Master of Business Administration AND
Master of Science in Electrical Engineering and Computer Science
In conjunction with the Leaders for Manufacturing Program at the
Massachusetts Institute of Technology June 2009
© 2009 Massachusetts Institute of Technology. All rights reserved.
Signature of Author _________________________________________________________ May 8, 2009 Electrical Engineering and Computer Science, MIT Sloan School of Management Certified by ________________________________________________________________
Jérémie Gallien, Thesis Supervisor Associate Professor of Operations Management, MIT Sloan School of Management Certified by ________________________________________________________________
Felipe Caro, Thesis Supervisor Assistant Professor, UCLA Anderson School of Management Certified by ________________________________________________________________ David Hardt, Thesis Reader Ralph E. and Eloise F. Cross Professor, Department of Mechanical Engineering Accepted by _______________________________________________________________ Terry Orlando, Professor of Electrical Engineering and Computer Science
Chair, EECS Committee on Graduate Students Accepted by _______________________________________________________________ Debbie Berechman, Executive Director of MBA Program
CLEARANCE PRICING OPTIMIZATION AT ZARA by
Rodolfo Carboni Borrasé
Submitted to the Sloan School of Management and the Department of Electrical Engineering and Computer Science on May 1, 2009 in Partial Fulfillment of the
Requirements for the Degrees of Master of Business Administration and Master of Science in Electrical Engineering and Computer Science
A
BSTRACTIn almost thirty-four years after opening the doors to its first store, the Inditex Group has grown to be one of the largest fashion distributors in the world. Today the group operates more than four thousand retail stores in seventy-three different countries and under eight different brand concepts.1
Inditex’s Zara brand division is renown for its high degree of vertical integration that allows it to maintain a tight control over the different stages of its supply chain and endows it with the flexibility to quickly react to current fashion trends.
With a yearly average of 173 new store openings, Zara’s accelerated growth rate has forced it to seek innovation and continuous improvement in its operations in order to maintain the competitive advantages that characterize it. One of its biggest challenges deals with the management of its clearance sales where the remaining inventory at the end of its sales campaign must be sold at a discounted price. These clearance sales are fast-paced and pricing decisions must be made for more than 11,000 different fashion designs that Zara introduces each year, and considering the different market conditions that exist in the more than 70 countries where Zara operates.
The proposed project consists in the development of a pricing mathematical model based on a sales forecasting model that estimates consumer’s reactions to price discounts and a linear optimization model that makes profit-maximizing optimal price assignments. The current thesis details the design, implementation, and live test of the proposed model based pricing methodology that resulted in an approximate increase of six percent to Zara’s clearance sales profits.
Thesis Supervisors:
Jérémie Gallien
Associate Professor of Operations Management MIT Sloan School of Management
Felipe Caro
Assistant Professor
UCLA Anderson School of Management
A
CKNOWLEDGEMENTSI would like to start by thanking all the people from Zara who significantly contributed to the
development of this project. I owe immense gratitude to my internship supervisor, Francisco Babío, for his profound commitment, support, and contributions to the project and for helping me get established and feel welcome in La Coruña and Zara (and not to mention, introducing me to the best Galician cuisine). Along the same lines, I would like to thank Christian Montejo for his inputs and continued support to the project, both during the good and the bad times. Also, this project would not have been possible without the support and vote of confidence from Miguel Díaz and Javier García: Thank you for all the time you devoted to the project, your invaluable feedback and for always keeping us motivated to do our best. I would also like to extend my most sincere appreciation to Felipe Peña, César Suárez, and Pepe Corredoira from the IT department, for all the work that they contributed to this project, and especially to Felipe who did a noteworthy job in dealing with the project’s taxing and constantly changing requirements: it was a pleasure working with persons as talented and hard-working as yourselves. Also very important to the development of this project was Lorena Rodríguez, whose knowledge of the business and immense patience in answering all of our questions was crucial during the development of the project models. I also want to thank Martín Pein, Montse Garmón, and Denis Loi for their trust and constant support of the project. And to everyone in Zara whom I interacted with in one way or another: Today I present this thesis with the great satisfaction that not only have we accomplished successful results but we have created good friendships along the way.
To my Thesis Advisor Felipe Caro, I am forever indebted for all the dedicated coaching, advice, and guidance that you provided throughout the last year; your involvement made this process a very rewarding and fruitful one. To my Advisor Jérémie Gallien, I am truly thankful for having had your mentoring during the development of this project; your support gave me the confidence to stride forward and face the numerous challenges involved.
I would also like to thank Professor Dave Hardt for his valuable feedback, and the MIT Leaders for Manufacturing Program for making this great opportunity possible.
Last, but most certainly not least, I would like to thank my family for all their support, and especially my mother Daniela: looking back, never in my wildest dreams would I have imagined all the
wonderful opportunities and experiences that I have had in the last years, and to a great extent I owe them all to you. Thank you.
T
ABLE OFC
ONTENTS Abstract...3 Acknowledgements...5 Table of Contents ...7 List of figures...9 List of Tables ...10 1 Introduction ...111.1 Motivation for Thesis ...11
1.2 Project Development...13
1.3 Chapter Outline ...15
2 Background ...16
2.1 Company Background ...16
2.2 Clearance Period Management Process ...17
2.3 Legacy Clearance Pricing Decision Flow...23
3 Pricing Problem ...28 3.1 Pricing Challenges ...28 3.2 Manual Solution...29 3.3 Proposed Solution...33 4 Forecasting Model...36 4.1 Introduction ...36 4.2 Data Mining...36 4.3 Measuring Sales...39 4.4 Explanatory Variables...44 4.5 Regression Analysis...46
4.6 Measuring Price Elasticity of Demand...51
4.7 Demand Forecasting at Different Prices ...54
4.8 Final Sales Forecasting...55
4.9 Forecasting Process Summary...57
5 Clearance Profit Optimization ...60
5.1 Introduction ...60 5.2 Model Formulation ...60 5.3 Implementation ...75 6 Live Testing...79 6.1 Introduction ...79 6.2 Experimental Design ...79 6.3 Experiment Execution...82 6.4 Experimental Results ...85
6.5 Economical Impact to Zara...92
6.6 Key Learnings and Observations...94
7 Conclusion...104
7.1 Impact to Zara ...104
8 Bibliography ...110 Appendix ...112 Appendix A: Optimization Model, AMPL Model Implementation ... A-1 Appendix B: Optimization Model, AMPL Input Data Loading ...B-5 Appendix C: Optimization Model, AMPL Run File ...C-6
L
IST OF FIGURESFigure 1: Zara's Sale Campaigns and Seasons...11
Figure 2: Inventory Sales Distribution...12
Figure 3: Project Timeline...14
Figure 4: Sample Price Tag ...17
Figure 5: Clearance Season Price Tag ...21
Figure 6: Regular Versus Clearance Season Store Layouts...22
Figure 7: Master Price List Flow Summary...23
Figure 8: Clearance Period Pricing ...25
Figure 9: Sample Clearance Group Sales Report ...30
Figure 10: Sample Clearance Group Sales Report, Country Summary...31
Figure 11: Proposed Solution...34
Figure 12: Sample Intra-Week Seasonality Weights for the Summer Campaign ...39
Figure 13: Sample Inter-Week Seasonality Weights for the Summer Campaign ...40
Figure 14: Optimization Model Results Screenshot ...77
Figure 15: Pilot Test Groups...80
Figure 16: Summer Campaign Pilot Test Design...81
Figure 17: Winter Campaign Field Test Design...82
Figure 18: Field Test Price Trajectory...95
Figure 19: Pilot Test Price and Stock Trajectory...96
Figure 20: Case Study Revisited, Price Elasticities...101
Figure 21: Case Study Revisited, Revenue Forecasts...102
L
IST OFT
ABLESTable 1: Winter Campaign Field Test Acceptance...84
Table 2: Summer Campaign Y-Metric Comparison for 2008 ...86
Table 3: Summer Campaign Y-Metric Comparison for 2007 ...87
Table 4: Summer Campaign Y-Metric Comparison for 2006 ...87
Table 5: Summer Campaign, Clearance Group level Y-Metric Performance...88
Table 6: Summer Campaign Average Inventory Levels...88
Table 7: Winter Campaign Y-Metric Comparison for 2008...89
Table 8: Winter Campaign Y-Metric Comparison for 2007...90
Table 9: Winter Campaign Y-Metric Comparison for 2006...90
Table 10: P-value Statistical Significance Legend...91
Table 11: Winter Campaign Y-Metric Comparison for 2008 (w/o Ireland Group 20)...91
Table 12: Economical Impact Calculation, Summer Campaign...92
Table 13: Economical Impact Calculation, Winter Campaign...93
Table 14: Field Test Revenue Forecasting Errors...94
Table 15: Case Study Revisited, Price Suggestions ...100
1 Introduction
1.1 Motivation for Thesis
The current thesis marks the conclusion of a collaboration internship between the MIT Leaders for Manufacturing (LFM) program and the fashion retailer and distributor chain Zara and its parent company Inditex, one of the largest fashion distributors in the world.2 This thesis and internship
also constitutes the second LFM internship that has been developed on-site at Zara’s headquarters in the city of Arteixo in Spain, and is based on the research work of Professors Felipe Caro from the UCLA Anderson School of Management and Jérémie Gallien from the MIT Sloan School of
Management3. The collaboration effort for the current project began early in 2007 when Professors
Gallien and Caro began discussions with Zara’s management team and proposed a project that would develop a new, data-driven methodology to make the pricing decisions during Zara’s clearance sales in which the remaining inventory at the end of the regular sales season is liquidated or sold at a discounted price.
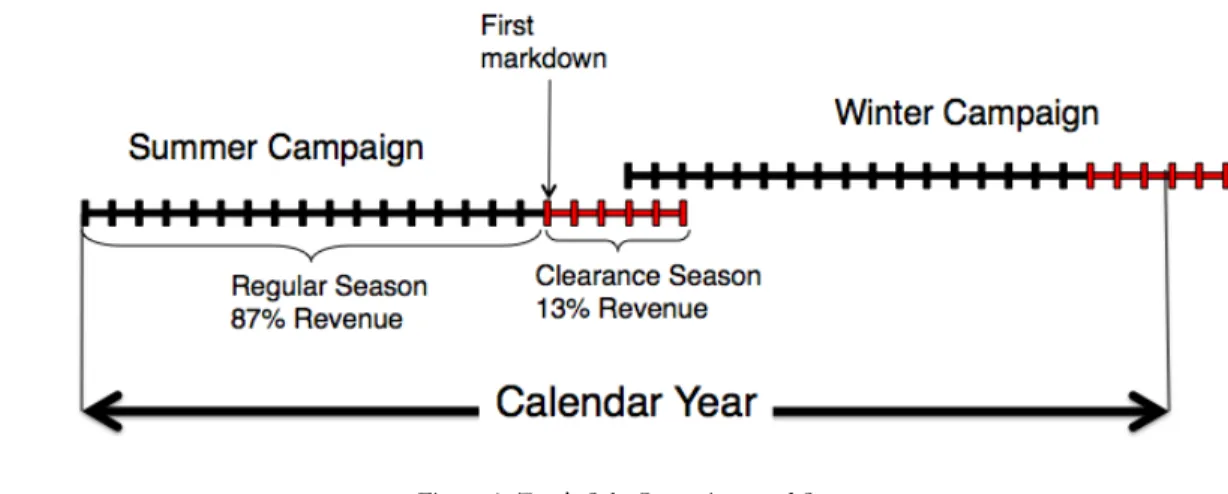
As illustrated in Figure 1, Zara’s design collections and Sales Seasons are divided into a Summer Campaign that is gradually introduced towards the beginning of the calendar year, and a Winter Campaign that is introduced towards the middle of the calendar year:
Figure 1: Zara's Sale Campaigns and Seasons
2 INDITEX Group - Our group, http://www.inditex.com/en/who_we_are/our_group (accessed April 21, 2009).
Fast-Each Regular Season (marked in black on Figure 1) extends for roughly five months after which point all of the remaining inventory from the present Season is sold at a discounted price in time for the beginning of the next Season. Clearance Seasons, indicated in red in Figure 1, extend for
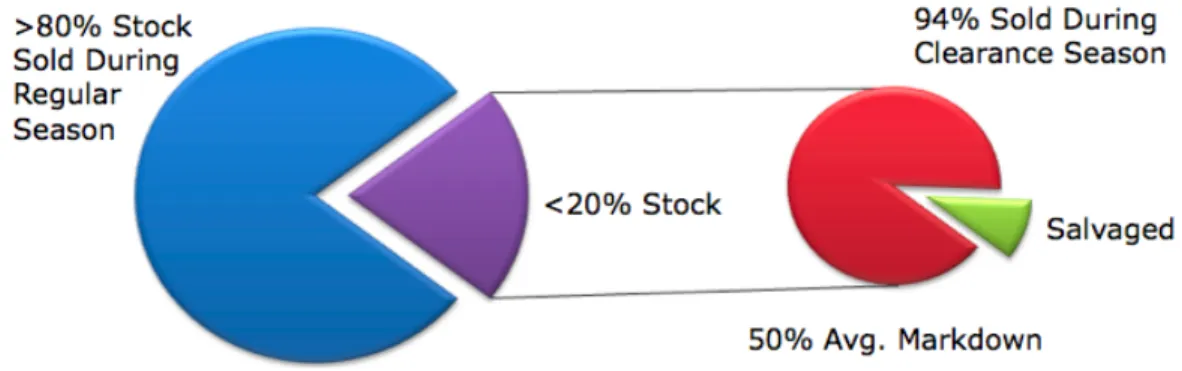
approximately two months and temporarily coexist with the introduction of the new sales Season as the transition from Summer to Winter Campaigns is made, and vice versa. During the Clearance Season, garment prices are revised on a weekly basis and gradually increasing price discounts are issued in response to the observed sales and remaining levels of inventory. As illustrated by the profit distribution captions in Figure 1, a considerable amount of Zara’s revenues are realized during the Clearance Season. However, when examining the revenue distributions, the importance of the Clearance Seasons is undermined by the fact that garments are sold at a discounted price during these Seasons. In order to better visualize the importance of the Clearance Season and its impact on Zara’s bottom line profits, Figure 2 illustrates the distributions of inventory sold during the Regular and Clearance Seasons.
Figure 2: Inventory Sales Distribution
Of the entire inventory that is available on either the Summer or Winter Campaign, roughly over eighty percent is sold during the Regular Season sales while the remaining twenty percent, lower than the industry average, is offered at a discounted price during the Clearance Season.4 Out of this
less than twenty percent, ninety four percent of the inventory is sold during the Clearance Season, and at an average price markdown of fifty percent, while the remaining six percent is sold for a salvage value to third-party distributors who operate outside of Zara’s target market.
Considering the fact that Zara posted revenues of 6,264 Million Euros in 20075, makes the prospect
of even marginal improvements in the pricing methodology currently employed by Zara a promising venture. As a result, the design of a data-driven mathematical model, capable of making profit-maximizing pricing decisions during Zara’s Clearance Season, became the motivation for this thesis.
1.2 Project Development
As mentioned earlier, work on the project on which the current thesis is based began as early as the summer of 2007 when Professors Caro and Gallien conducted a Zara store visit in order to observe and become familiarized with the operational aspects of Zara’s management of the Clearance Season sales. Shortly thereafter, ideas on process improvements that would improve the profitability of the Clearance Season were discussed with Zara’s management and a two-pronged approach was
proposed:
1. Development of a new methodology to physically allocate the remaining inventory at the end of the Regular Season amongst Zara’s stores in an optimal way that maximizes Clearance Season profits.
2. Given an initial physical distribution of the inventory, to design and implement a methodology for determining the price discounts that should be applied during the Clearance Season in a way such that an optimal balance is reached between sold inventory and its sale price, thus maximizing profits made.
In other words, the first step deals with “having the right inventory in the right place”, while the second one addresses the issue of how to price it so that the perceived profits are maximized. In order to divide the problem into more manageable sections, it was decided that the current project would address the second point while the latter would be saved for a future LFM Internship. The timeline followed for the project is depicted in Figure 3:
Figure 3: Project Timeline
Caro and Gallien began work on the mathematical models that support the developed pricing methodology during the summer of 20076. Shortly thereafter, Zara authorized what would become
its second LFM Internship, internally referred to as MIT2, which began in February of 2008 and took place on-site at Zara’s headquarters in La Coruña, Spain. A full-time IT engineer was hired to handle the data-intense requirements of the project.
Based on the forecasting model proposed by Caro and Gallien, the first part of the internship was focused on implementing the model in Zara’s IT infrastructure, experimenting with different choices for the model’s parameters and variables, and working together with Zara’s management in order to capture and incorporate part of their knowledge of the business into the model.
Approximately four months into the Internship an Optimization Model, which takes the Forecasting Model’s sales forecasts as one of its inputs and makes optimal Clearance Season pricing assignments was implemented. The third and last part of the on-site Internship consisted in the design and execution of a live pilot test in which the developed model was used to make the pricing decisions for four sample garment groups during the Summer Clearance Season for two mid-sized European countries.
During the months following the conclusion of the Clearance Season, the results obtained from the pilot test were analyzed, and based on the measured positive impact on profits, a larger-scale field test was planned for the 2008 Winter Clearance Season. For this second test, a finalized version of the developed model that incorporated improvements made throughout the summer pilot, was tested in the same two mid-sized European countries, but this time across the entire inventory collection. As shown in the Project Timeline, this field test included a two-week site visit during the first weeks of the Clearance Season in order to make final adjustments to the models and collaborate on the execution of the test.
The project was finally concluded during the present year, after the results of the field test were analyzed and conclusive positive impact results over profits were measured. Based on the project’s success, the developed model will now be extended to cover the entirety of Zara’s Clearance Season pricing methodology.
1.3 Chapter Outline
This thesis is divided into seven chapters.
Chapter 2 provides company background and an overview of how the clearance season and pricing
process are managed at Zara.
Chapter 3 describes the challenges that Zara faces when making clearance pricing decisions, how it
currently makes its pricing decisions, and the new model based solution that will be presented in this thesis.
Chapter 4 describes the design and implementation process of a forecasting model that is capable of
estimating Zara’s clearance sales under variable discounted prices.
Chapter 5 provides the formulation of the linear optimization model that works together with the
forecasting model and makes optimal clearance pricing decisions that maximize the realized profits.
Chapter 6 presents the experimental design and execution of two live tests that were conducted in
order to evaluate the performance of the developed model based pricing methodology, and details the economical impact results and observations measured during the experiments.
Chapter 7 finally summarizes the project’s impact to Zara, as well as the current status and next steps
2 Background
2.1 Company Background
The Zara brand and stores are part of the Spanish textile industry conglomerate Inditex. With a 2008 posted net income of 1,262M Euros and a 2007/2004 Compound Annual Growth Rate of 25%, Inditex has placed itself as one of the worlds top fashion distributors7. The company is
diversified across eight different store concepts, targeted at different market segments: Zara, Pull and Bear, Massimo Dutti, Berksha, Stradivarius, Oysho, Zara Home, and Uterqüe.
The history of Inditex began with the opening of the first Zara store in La Coruña, Spain in 1975 and in the last thirty-four has grown its operations into seventy-three countries where it operates 4,264 different stores and employs more than 89,000 persons.8
With 2008 net sales of 6,824 M EUR, the Zara brand represents two thirds of Inditex’s business.9
Zara’s model or approach to the retail industry is renown by its high degree of vertical integration that allows it to maintain a tight control over the different stages of its supply chain, including textiles sourcing, design, manufacture, distribution, and retail. This, together with centralized distribution centers located in Spain from which inventory is constantly delivered to all of its stores, enables Zara to quickly respond to the predominant fashion trends in the market and deliver new fashion designs on a weekly basis. For instance, in any given year, more than eleven thousand different fashion designs are introduced into Zara’s stores.
The great flexibility that Zara’s large scale of vertical integration enables has been one of the keys for its success, and has led to an accelerated growth of its business. With an average of three new stores opened on each week of 2008 and increases in net sales and gross margins of ten percent over the previous year, Zara’s growth has also presented significant challenges.10 With increased capacity
requirements and cost constraints, Zara has had to gradually move towards sourcing from locations that are geographically distant from its Spanish distribution centers, which means that it has had to
7 (2007). Grupo Inditex Annual Report.
8 Inditex. (2009). FY2008 RESULTS, 1 February 2008 to 31 January 2009 . 9 Ibid.
further improve its supply chain, production, distribution, and retail operations in order to maintain its trademark and competitive advantage as a fast-fashion company.
As part of this improvement process, Zara first started collaborating with the LFM Program at MIT in 2006 and have since worked in projects focused around optimizing purchasing decisions, store distribution and replenishment orders, and management and pricing of clearance inventory, which is the subject presented in the current thesis. Zara is internally divided into three sections: Woman, Men, and Kids. Because the Woman Section represents sixty percent of Zara’s business and revenues, it is usually chosen as the launching pad for the development and evaluation of improvement plans, which is the case for the project described in the current thesis as well.
2.2 Clearance Period Management Process 2 . 2 . 1 I n t r o d u c t i o n t o B a s i c T e r m i n o l o g y 2.2.1.1 Stock Keeping Units
Special terminology words relative to the current project and Zara’s business, some of which have already been introduced, are capitalized throughout the thesis and when applicable, are defined in the Glossary as well. Some basic terminology words will be defined in the current Section while others will be defined later on as the subjects to which they relate to are introduced.
Zara’s stock keeping units are determined by a Reference, Color, and Size coding that is visible in any of its garments’ price tags:
The Reference designation is itself composed by a four-digit number that identifies the garment’s Model and a three-digit number that identifies its Quality, where the Model relates to the garments design pattern and its Quality to the textile material it is made of. Similarly, a three-digit number determines the Reference’s Color. A single digit designates Size, but a more customer intuitive symbol, such as “M”, “L” or “XL”, is used on the printed price tags. Referring back to the example on Figure 4, it shows a designation of “5927/024/716 S”, which uniquely identifies a garment as a Model 5927 in Quality 024 (or equivalently Reference 5927/024) in the Color 716 and Size small. Additionally, Country, Store, Campaign and Season designations accompany the Reference, Size, and Color designations for a highly detailed tracking of Zara’s inventory and sales.
2.2.1.2 Sales Campaigns and Seasons
As mentioned in Chapter 1, Zara divides its design collections into two Campaigns: the Summer Campaign that is gradually introduced starting in January, and the Winter Campaign that is
introduced starting in July11. Also, as it was previously explained, each of these Campaigns is in turn
divided into a Regular Season and a Clearance Season.
2.2.1.3 Prices and Pricing
Zara’s nominal prices, i.e., the possible prices at which garments might be sold, are compiled in the Commercial Pricing List, and are chosen based on their commercial appeal or the positive
psychological impact that the numbering choice of the prices displayed on the store has on the customers. This practice is commonly followed across the retail industry and is the reason why you don’t find prices like $21.27 or $63.21 on stores, but rather ones like $24.90 or $59.99. In Zara, there are two different Commercial Price List sets, one for the Regular Season and one for the Clearance Season. For example, in Euro currency countries, items priced at values below one hundred are usually ended in “90” decimal values (e.g., 89.90, 14.90, etc.) for the Regular Season or in “95” values for the Clearance Season (e.g., 19.95, 79.95, etc.) and in no-decimal numbers ending in “9” for items priced above one hundred (e.g., 149, 169, etc.). The number of different prices on the Commercial Price List is decided based on achieving a balance between pricing flexibility and store logistics costs and customer appeal to having a limited number of prices displayed on the
stores. The Commercial Price List is based on Spain’s Euro pricing and the price lists for other currencies and countries is partially determined through a Price Equivalence Table that for every Spanish price, lists an equivalent price in each of the other currencies. This currency equivalent is influenced by currency exchanged rates, but mainly responds to including prices that appeal to the customer markets in each country, e.g., having Clearance Season pricings such as 39.99 or 19.99 USD in the United States.
2.2.1.4 Organizational Groups
When References are introduced throughout the Regular Season, the Product and Purchasing department determines their prices based on a target price markup over the product costs. Product and Purchasing is itself divided into six different groups within Zara’s Woman Division (e.g.
Woman, Basic, etc.) and each of these groups is responsible for making the design and purchasing decisions for each respective subset of Zara’s References.
Whereas initial pricing decisions during the Regular Season are made by the Product and Purchasing group, Clearance Season pricing decisions (or the price discounts applied over the original Regular Season prices) are made by the Pricing Team and Country Managers. The Pricing Team is
conformed by a group of Zara’s senior management who are knowledgeable on the product, distribution, financial, and brand image aspects of the Clearance Season. Country Managers are analysts assigned to specific countries or regions where Zara operates and who, amongst some of their responsibilities, oversee store sales performance, new product introductions, and handle general communications with store managers and clerks.
2.2.1.5 Clearance Groups and Clusters
During the Clearance Season, all References are grouped into one out of twenty two Clearance Groups, according to general garment types and Product and Purchasing ownership, e.g., Basic Jackets, TRF Dresses, T-shirts and Polos, Mesh, etc. Additionally, References within a Clearance Group are grouped into Price Clusters, based on their Regular Season prices, so that for example, the Price Cluster 59.90 within the TRF Skirts Clearance Group includes all References within this Group that were priced at 59.90 EUR during the Regular Season. Clearance Season sales and inventories are monitored on a daily basis, and new pricing decisions are made roughly on a weekly
basis, based on the perceived need to refresh the current prices. In this way, the Clearance Season is itself divided into Clearance Periods, where the end of one Period and the start of the next one are determined by every time that new pricing decisions are made. Clearance Periods may or may not correspond to a calendar week and are therefore defined only by the points in time where the pricing decisions are made.
2 . 2 . 2 C l e a r a n c e S t o r e M a n a g e m e n t
Although more than five thousand different References are introduced in Zara’s stores during each sales Campaign, they are introduced progressively throughout the Campaign so that customers visiting a store on a weekly basis will discover newly introduced garments with each visit. In order to avoid a cluttered presentation of the garments and allow customers to easily browse through the store’s collection and quickly find garments in their particular size, References are presented in their minimum assortment on the store’s exhibition floor. In general, a Reference is exhibited in each of its Colors and with one garment for each of its Sizes, or perhaps two of them for the most popular Sizes12. In order to execute this store layout concept, store clerks constantly monitor garment
placement on the shopping floor, and review sales within the last hours in order to replenish any Colors or Sizes of a Reference that have become depleted. When inventory for a particular Reference is not enough to guarantee an adequate assortment for its display, or it exceeds a certain display life-cycle or its sales fall below a minimum threshold, it is pulled off the shelves and either stored in the store’s backroom or sent back to Zara’s central warehouses for later redistribution to stores during the Campaign end Clearance Season.13
At the store level, the Clearance Season is opened when the initial Clearance Season price assignment list, which details the new discounted prices at which all of the References within the store will be sold, is sent from Zara’s headquarters some days in advance. As explained in Section 2.2.1, all References are separated into Clearance Groups and grouped by Price Clusters within them. Initially, price lists are communicated for each Clearance Group, and new prices are assigned to each Price Cluster so that for example, store clerks in charge of manually relabeling price tags
12 For a more detailed review of Zara’s store display policies, read Correa, J. R. (2007, June). Optimization of a Fast-Response
Distribution Network.
receive instructions along the lines of “all inventory within the Woman Blazer Clearance Group that was originally priced between 119 EUR and 99 EUR will now be priced at 69.95 EUR”. In this way, different Price Clusters may be consolidated under a single price or Price Category at the opening of the Clearance Season. From that point on, Clearance Season sales performance are tracked by, and future price communications are made for each of these initial Price Categories, so that following our previous example, future pricing instructions to the store could be: “within the Woman Blazer Clearance Group, the initial Price Cluster grouping of 119-99 EUR will now be priced at 49.95 EUR”.14
Once the initial price lists are received at the stores, all of the References must be manually relabeled to reflect their new discounted prices. With the exception of some countries where special
regulations regarding discounted sales apply, References are relabeled by applying a price sticker over the original price label, leaving the original Regular Season price visible so that customers may compare the current discounted price to the original one:
Figure 5: Clearance Season Price Tag
Preparations at the store begin by relabeling inventory kept in the store’s backroom, which is composed of the remnants of the Regular Season or of the inventory that is redistributed from Zara’s central warehouses prior to the start of the Clearance Season. The night before the opening
14 A small distinction between the current project’s treatment of data and the way it is handled at the store level is that the developed
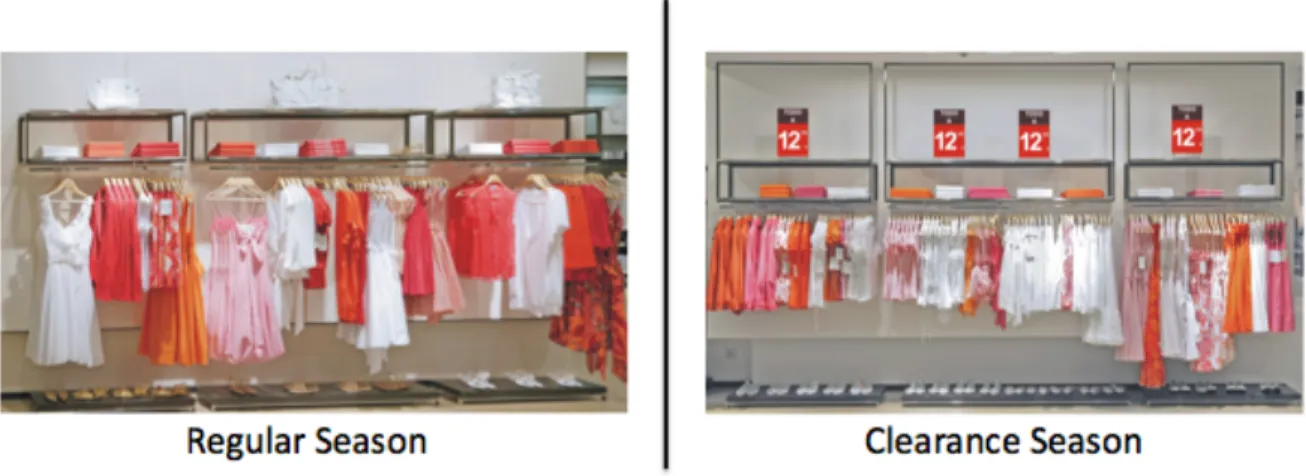
day of the Clearance Season, store clerks work hard in relabeling the entire inventory on the store’s exhibition floor and the whole store exhibition layout is rearranged. As the inventory from the backroom is brought into the store, the number of different References that coexist on the exhibition floor far surpasses that which is normally available during the Regular Season. For this reason, References are no longer presented in their minimum assortment displays:
Figure 6: Regular Versus Clearance Season Store Layouts
As shown in Figure 6, References are grouped by Clearance Group and Price Category when displayed on the store’s exhibition floor. Given the increased variety of References and assortment quantities within them, garments are presented under a more condensed space and visually grouped under large visible signs that identify the current pricing of each group.
Once the Clearance Season begins, further price discounts are communicated from Zara’s
headquarters roughly on a weekly basis. The list of new prices is received on the day before those prices become effective so that the store clerks have sufficient time for the relabeling process. Price tags are generally relabeled after closing hours and new price stickers are placed over the previous price stickers, so that only the original Regular Season price and the newly assigned one remain visible.
At the beginning of the Clearance Season, the store exhibition floor is almost entirely occupied by Clearance Season inventory. When the Clearance Season progresses, inventory levels are gradually depleted and as prices are progressively lowered, more Price Clusters are merged into a single Price
up, new, non-discounted inventory from the following Campaign’s Regular Season is gradually introduced. In this way, as it is evident from Figure 1, the Clearance Season from one Campaign briefly coexists with the Regular Season of the next Campaign. Inventory from the new Campaign is generally first placed towards the back of the store and the most visible exhibition space near the store’s entrance is saved for the Clearance Season inventory. The area allotted to the new Campaign is then gradually increased until the store layout is once again shifted and the Clearance Season inventory is moved to the back of the store towards the end of the Clearance Season, thus completing the transition to the new Campaign’s Regular Season.
2.3 Legacy Clearance Pricing Decision Flow
The current Section describes the basic process flow that is followed when determining the Clearance Season pricing assignments. The criteria utilized to make the pricing decisions themselves is described in Chapter 3.
2 . 3 . 1 M a s t e r P r i c e L i s t P r o c e s s F l o w
The process followed to determine the initial pricing lists for each Country and Clearance Group starts more than a month in advance from the actual beginning of the Clearance Season. Whereas the actual process followed by Zara encompasses more than fifteen operational steps involving 5 different department divisions, the main and most significant steps are summarized in Figure 7:
Initial Clearance Group Assignments [various] Master Price List created for Spain [Pricing Team] Master List translated into individual Country template lists [Pricing Team] Modifications made to individul Country Price Lists [Country Specialists] Country pricing list review [Pricing Team] Definitive price lists sent to stores
The process begins when, based on the Clearance Group assignments from the previous Campaign, every Reference from the current Campaign is assigned into one of the Clearance group. This association is based both on the Reference’s garment type as well as on its respective Purchasing department and product family. This initial process involves considerable manual labor, as Clearance Group assignments for the current Campaign must be manually entered into the system.
Once the Clearance Group associations have been defined, the Pricing Team begins meeting in order to define a Master Price List that corresponds to the pricing assignments for each Price Cluster and Clearance Group and that will dictate the prices at the start of the Clearance Season. This Master Price List is based on Spanish stores and sales so, when elaborating it, the Pricing Team looks at the sales history and performance of each Clearance Group in Zara’s Spain stores during the current Campaigns Regular Season, and at the behavior of the previous year’s Clearance Season. Once completed, the Master Price List is in essence the list of prices that will become effective at the beginning of the Clearance Season in Spain. Only as an initial template for the remaining countries, the Master Price List is then translated into each of the different country currencies through the Price Equivalence Table.
The next step in the process is for the Country Managers to make modifications on the template price lists for their countries. These modifications incorporate each Country Manager’s unique knowledge of their country’s market conditions, and through these modifications they ensure that the price lists remain competitive within those respective markets. For example, there might be a country where a particular style of dresses is particularly popular and so doesn’t require such a substantive discount for it to sell well, or a country where the warm summer season is particularly short and beachwear must be more fiercely discounted.
After this, each Country Manager meets with the Pricing Team in order to discuss the suggested modifications on the template price list. This final process of approval with the Pricing Team is a good way to ensure congruency or homogeneity between the pricing in different countries and allows greater control on higher-level strategic and brand management decisions. One drawback of this approach however, is the fact that the Pricing Team is generally conformed by three to four members who have to meet with all of the Country Managers and review pricing lists for more than sixty different countries, and this causes a bottleneck. Time constraints are not as significant for the
initial price lists as they can be prepared in advance to the beginning of the Clearance Season, but they in the case of the weekly decisions that must be made once the Clearance Season has begun, the time to review these lists is limited.
2 . 3 . 2 C l e a r a n c e P r i c i n g D e c i s i o n s
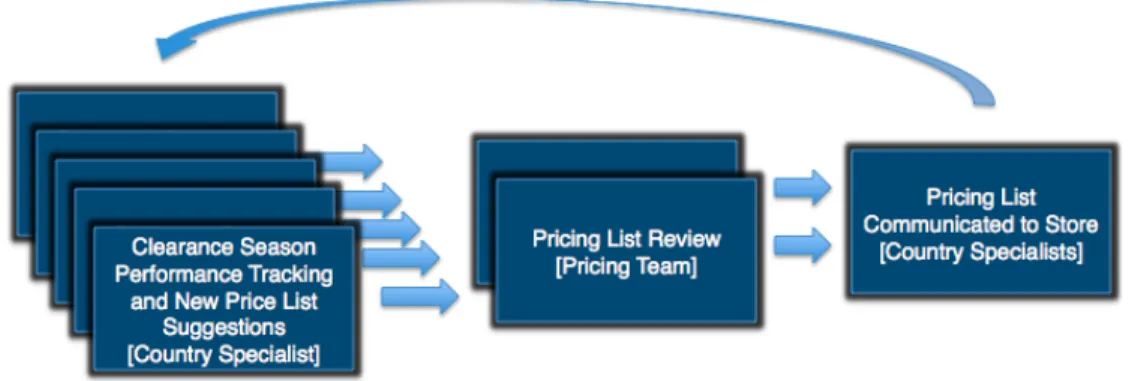
Once the Clearance Season has begun, Country Managers track the sales performance of the stores in their countries of responsibility in order to get a sense for the customers’ reactions to the current prices. In response to these, Country Managers issue new price lists that must then be revised during a meeting with the Pricing Team:
Figure 8: Clearance Period Pricing
Once the Clearance Season has begun, prices are reviewed on a weekly basis. Furthermore, new prices are usually assigned and sent to the stores on the day before its highest selling days within the week so that the respective store clerks can re-label the store’s inventory in time for the weekly peak of store visitors to find new prices when they walk into the store the next day. For this reason, most of the pricing list reviews take place towards the second half of the week, which heightens the bottleneck effect and places added strain on the Pricing Team, which has to meet with Country Managers supervising the more than seventy countries where Zara operates. To counter this, different members of the Pricing Team or two-person teams meet with different Country Managers so that the review process can be done in parallel. Once the lists are approved, each Country Manager communicates them to the stores, and the cycle illustrated in Figure 8 is then repeated roughly on a weekly basis until the end of the Clearance Season.
2 . 3 . 3 B u s i n e s s P r a c t i c e s i n P r i c i n g 2.3.3.1 Hard Rules
On top of the pricing criteria that will be explained in the next chapter, there exist a series of pricing business practices that Zara’s Pricing Team and Country Managers follow. As a business guideline, all items that were priced at a same price during the Regular Season must remain grouped under a same price all throughout the Clearance Season; this allows for grouping of different garments and so that clerks don’t have to identify individual References but rather larger groups during the price tag relabeling process. Furthermore, a Reference that during the Regular Season is priced higher than another one must always have a price that is equal or greater than the price of that other Reference. In other words, the price order or References is preserved, mainly in response to brand and store protection purposes, e.g., higher quality design garments should logically be priced higher than less elaborate ones. Also, needless to say, once a price is lowered, it cannot be raised again, as this would generate distrust in Zara’s customers. During the Clearance Season, as increasing
discounts are issued, Price Clusters within a Clearance Group will tend to consolidate under a single price, and once they do, both Price Clusters must remain joined under a same price. This guideline responds to the way in which subsequent prices are assigned, i.e., as a method to avoid having to identify individual References when price tags are relabeled and relabeling all the References that are displayed under a single price sign instead.
2.3.3.2 Soft Rules
The guidelines discussed so far can be treated as rules, in the sense that their enforcement is not open to subjectivity, i.e., they are either followed or they are not. In contrast, there are other pricing business practices that have “softer” boundaries and are more like levers that the Pricing Team and Country Managers can adjust to determine the pace and management of the Clearance Season. For example, the minimum price discount that should be applied over a Reference’s Regular Season price is usually determined to be a discount of at least fifteen percent. Minimum price discounts determine the ambience and price sensation within stores, e.g., a customer might be disappointed to walk into a store’s Clearance Season only to find that items are barely discounted from their original prices and decide to visit a different brand store where discounts are more attractive.
Along these same lines, a Clearance Group’s Exit Price denotes the highest price offered within the Group and has an important psychological impact over the customers, e.g., a higher Exit Price gives customers the impression that prices at the store in general are higher. For this reason, unless there is a critical mass in inventory that will be priced at the Exit Price, it might be preferable to liquidate that inventory at a lower price and avoid misperceptions on the brand’s image
Finally, another way in which the pace of the Clearance Season can be managed is by placing restrictions on the maximum number of different Price Categories that are created for a Clearance Group. Limiting the number of different prices offered forces the consolidation of different Price Clusters, creates a more pleasant store environment, and simplifies the relabeling operations at the store level.
3 Pricing Problem
With approximately 11,000 new References introduced every year, distributed roughly in half between the Summer and Winter Campaigns, making pricing decisions for all of them on brief intervals of time is not a trivial task.
3.1 Pricing Challenges
Granted that creating a Master Price List for all Countries at the beginning of the Clearance Sales provides some level of homogeneity among the different Countries, it is only the best-known solution yet to a data intensive, time constrained problem. As we made it clear to Zara’s Pricing Team all throughout the development of the current project, their business is extremely experience based, and given enough resources and time, their pricing suggestions would be harder to improve with a mathematical model. In other words, if the Pricing Team had infinite resources and time to review all of the References in detail, analyzing their sales during the Regular Season, identifying the specific garments they refer to, their remaining inventory levels, and then making pricing decisions for them, and on top of this, conducting a separate analysis for each individual Country, pricing decisions would more closely approach optimality. However, in reality, the time constraints are very significant and a Master Price List based on Spanish sales histories is chosen as the most
representative starting point from which initial pricing lists are rooted for all of the Countries and decisions are made on aggregate, summarized data.
Once the Clearance Season starts, pricing decisions need to be made on a weekly basis by the Country Experts and they have limited access to the main Pricing Team that must review all of the price suggestion lists created by all Country Experts. At the same time, Country Experts are faced with the challenge of analyzing the Clearance Period sales, getting a sense for the customers’ reactions to pricing, and weighting the remaining inventory against the number of days left in the Clearance Season. On top of this, Country Experts must try to adhere to the business practices just described in section 2.3.3 and assessing the economical impact of their decisions. Furthermore, having different persons making pricing decisions introduces different personal criteria into the
pricing process and makes it difficult to establish uniform and homogenous guidelines at a corporate level.
In summary, Zara’s pricing challenge during the Clearance Season can be described as making fast paced decisions that would ideally require the detailed analysis of massive amounts of information, and which influence a large percentage of its sales and inventory. For this reasons, any
improvement in the current pricing process has the potential to significantly improve Zara’s bottom line profits.
3.2 Manual Solution
As it was discussed in the previous chapter, people with store and inventory knowledge who have built their pricing expertise through years of experience are in charge of Zara’s pricing. Due to the inherent time and resource limitations, Zara’s Pricing Team and Country Managers must rely on aggregate, summarized reports to get a broad picture of how well different Clearance Groups sold during the Regular Season, how much inventory was left unsold and must therefore be sold during the Clearance Season, and in general, get a feel for how to best price this inventory during the allotted Clearance Season time.
In an effort to capture as much as possible of all the information that is available, the Pricing Team and Country Managers rely on various data reports. These reports allow them to follow the
progression of the Clearance Sales and to compare the performance of the current Campaign
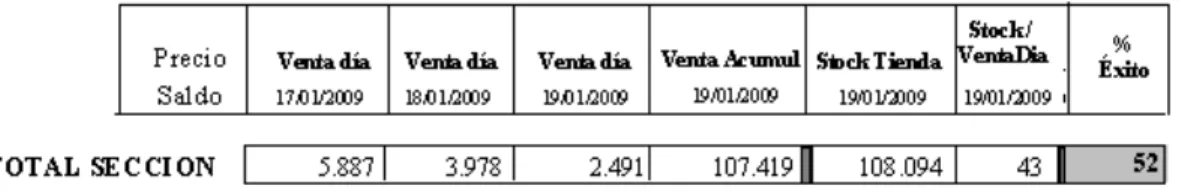
amongst different countries, Clearance Groups, and Clearance Seasons from previous years. One of the most commonly used reports is the Clearance Group Sales Report, an excerpt of which is included in Figure 9:
Figure 9: Sample Clearance Group Sales Report
In this automated report, sales results are shown for each Country and Clearance Group and a summary of average values at the Clearance Group and Country level is shown at the end of each section. The excerpt shown in Figure 9 corresponds to data for a single Clearance Group. In the report, each row corresponds to one of the initial Price Categories created at the beginning of the Clearance Period, e.g., the first row corresponds to the initial Price Category composed of the Price Clusters from 49.90 to 29.90. The data shown on the columns to the right correspond to the current Clearance Price for each Price Category (i.e., the price at which it is currently being sold), so for example, it can be seen that there are currently four distinct Price Categories within this group, one for each of the different prices on the first column of the report. The following columns show the sales figures for the last three days, the cumulative sales to date, the remaining inventory, and the number of days of sales this inventory represents based on the previous days’ sales. The right-most column that is highlighted in grey corresponds to the success rate, a measure of the percentage of inventory that has been sold during the Clearance Season. From this report, it is possible to observe the sales trend for the last days and measure the remaining inventory against the number of days left in the Clearance Season. Also, by looking at the overall average figures, it is possible to determine what Clearance Groups and Price Categories within them have days worth inventory levels above the total average level and assess whether further markdowns are needed to reactivate its sales.
Other things that the Pricing Team can look at are the remaining inventory levels in order to consolidate smaller sized price categories into a single price label so that the corresponding References may be physically consolidated in the store.
Although this Clearance Group sales report is a very useful tool that summarizes massive amounts of information in a report that can be browsed literally in seconds, it suffers from several
disadvantages. For example, browsing the days worth of inventory for a Price Category and
comparing it to the Country average might prompt the analyst to introduce a price cut, but it doesn’t provide an indication of how big a markdown is necessary, or if marking down is even the most profitable solution. For example, there may be cases where, despite having considerable remaining inventory for a certain Price Category, it is more profitable to maintain a price and end up with more unsold inventory because the possible increase in sales that would be obtained with a markdown would not compensate for the less profit made by selling at a lower price. Similarly, it is difficult to evaluate or weight the profit repercussions of selecting one price over another, and even more challenging to make future profit projections for the remaining Clearance Periods.
3 . 2 . 1 P r i c i n g D e c i s i o n C a s e S t u d y
As an illustrative example of the thought process that an analyst might follow when making pricing decisions for a Clearance Group, we can picture the case of a Country Manager who is working on the Price Suggestion list for her country of responsibility. She has just printed a copy of the
Clearance Group Sales Report detailed in Figure 9, and needs to come up with her Price Suggestion list within the next thirty minutes, at which time she will be meeting with two members of the Pricing Team who will review and validate her suggestions. Furthermore, we can pretend that the illustrated report was issued on day number twenty-five of the Clearance Season and that the average values for the entire country being considered are the following:
Starting from the data shown in Figure 9, the Country Manager would most probably focus her attention on Price Categories of 19.95 and 14.95, as most of the inventory (1218 and 1006 units respectively) is concentrated on these categories. When looking at the sales figures from the first three columns, the analyst would first properly frame the observed sales trend based on the fact that the first column corresponds to the date 17/01/09, Saturday, when sales are generally amongst the largest within the week. Given this context, and based on her business experience, the Country Manager could then assess the general trend in sales for each of the Price Categories and make projections into the future if the current prices were to be kept unchanged. Returning to the inventory levels, she could then examine the number of days worth of inventory based on the previous day’s sales and would realize that the first two Price Categories have 102 and 126 days worth of inventory, values that are considerably higher than the Clearance Group’s average value of 77. Furthermore, looking at the Country average values from Figure 10, she would corroborate that the average days worth of inventory for all of the Clearance Groups is only 43 days. Similarly, looking at the right-most column in the report, she would observe that the success rates for the first two Price Categories are only 31 and 32 percent, whereas the Clearance Group and Country
averages are considerably higher at 41 and 52 each.
Based on this analysis, the Country Manager would most likely decide that the prices for the Price Clusters currently priced at 19.95 and 14.95 should be further lowered, while the remaining Clusters could stay at their current prices. Now, however, the Country Manager faces the non-trivial task of deciding how aggressive a discount is necessary to get the sales of these Price Clusters “back on track”. Will lowering their prices to 12.95 and 9.95 be enough? And if so, will the resulting increase in unit sales be large enough to make up for the lower revenues from selling at a lower price? And if not, should she even discount these Price Clusters at all?
This is an example of the uncertainties that Country Managers and members of the Pricing Team must deal with when making important pricing decisions that directly impact Zara’s bottom line revenues. Furthermore, the Clearance Group from Figure 9 and Figure 10 was specifically chosen for its unusually high days worth of inventory and low success rate in order to illustrate a case where further price discounts would normally be issued, but this is not representative of the majority of Zara’s Clearance Groups, where the decision to lower prices or maintaining them is not this trivial.
The Country Manager in this sample case would ultimately rely on her experience of the business to make her final decision. But given different the different backgrounds and experience levels of different Country Managers, there really is no saying over whether one pricing suggestion is optimal over another one, or whether two different Country Managers would reach a consensus over which price list will result in bigger earned profits. In order to contrast the legacy pricing methodology with the methodology presented in the current thesis, this case will be revisited in Section 6.6.4, once the methodology has been thoroughly presented and explained.
3.3 Proposed Solution
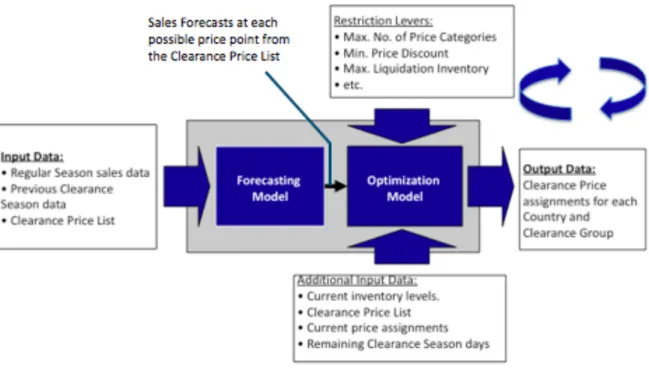
The solution proposed in the current project is a Linear Optimization Model that makes optimal pricing decisions in order to maximize profits during the Clearance Season. For every Country and Clearance Group, the Optimization Model works with a forecast for sales corresponding to each possible price from the Clearance Price List and selects and assigns the optimal prices that will guarantee the maximum profits possible. The model assigns a price to each individual Price Cluster so for example, a possible model output for a Clearance Group is to assign a price of 19.95 EUR to the 24.90 EUR Price Cluster, i.e., all of the References that were priced at 24.90 EUR will be marked down to 19.95 EUR. In this way, the model is run periodically throughout the Clearance Season every time prices need to be revised, and each time the model analyzes the most recent data available and issues a new list of assigned prices in which some of the Price Clusters may be further marked down while other’s current prices may be maintained. And because different price markdowns are possible at different time points during the Clearance Season, when making price assignment decisions, the Optimization Model will also make internal projections for sales during the remaining weeks, testing different price progression scenarios and choosing the optimal one for the current Clearance Period. Furthermore, the model when assigning the optimal prices also considers the fact that any unsold inventory at the end of the Clearance Period can be sold for a salvage value. As shown in Figure 11, the proposed project will include both the just described Optimization Model as well as a Forecasting Model that computes the actual sales forecasts that serve as an input for the Optimization Model.
Figure 11: Proposed Solution
Fitting a Linear Regression multiplicative functional form that relates the conditions of several relevant Reference variables such as purchase size, time from introduction to stores, and inventory position to the observed sales during the current Regular Season creates the basis for the Forecasting Model. Furthermore, estimating and measuring the consumer’s price elasticity of demand, the Forecasting Model is capable of producing sales forecasts for References when they are priced at any of the prices from the Clearance Price List.
In addition to the sales forecasts from the Forecasting Model, the Optimization Model takes inputs such as the current inventory levels, the time remaining in the Clearance Season, and the prices currently assigned to the different Price Clusters in order to optimize its price selection.
Furthermore, the user of the model has the option to adjust or select a series of Restriction Levers in order to influence the output price assignment list. For example, the user might want to restrict the maximum number of different Price Categories created in order to consolidate several Price Clusters into a single Price Category so that, at a store level, more References are priced equally and can therefore be displayed together thus saving space. Similarly, the Optimization Model captures
Zara’s pricing business practices such as having a decreasing price progression or observing minimum price discounts from one Clearance Period to the other as constraints.
As shown in Figure 11, when the models’ data has been populated through automated databases, the Price Team or Country Managers can run the model to obtain price list assignments for any specific Clearance Group and Country. Furthermore, following an iterative process, they can continue to adjust the Restriction Levers if necessary and evaluate the repercussions that placing restrictions on the output price list has on the expected profits.
The most salient advantage of the proposed solution is the fact that it optimizes the overall profits made during the Clearance Season as opposed to the liquidation of remaining inventory. Working with an automated Forecasting Model, the Optimization Model is capable of making pricing decisions that take into consideration the sales history and characteristics of every single Reference within a Clearance Cluster and that are specifically tailored for each Country and Clearance Group, therefore providing a detailed level of analysis that would otherwise not be possible. By considering and iterating through different possible price progression scenarios, the Forecasting Model can look beyond the current Clearance Period that it is run in, and makes pricing decisions that are globally optimal for the complete Clearance Season.
Finally, following the proposed solution provides the added benefits of having a single,
homogeneous decision process, through which all of Zara’s pricing decisions are made. Additional positive collateral effects result in relieving the bottleneck effect that arises from the Pricing Team having to meet with all of the Country Managers, since the proposed solution provides a near-to-final pricing list and only minor revisions over it are required. The pricing communication logistics will also be enhanced as the submission of selected prices to the warehouses, and ultimately to the store-point cash registers, may be automated because the solution is closely embedded within Zara’s IT systems.
4 Forecasting Model
4.1 Introduction
The Forecasting Model needs to provide a forecast for every possible price on the Clearance Price List for each Price Cluster within each individual Clearance Group and Country. In other words, its purpose is to estimate the expected unit sales when References that were priced at the same price during the Regular Season are priced at any of the possible discount prices.
In order to create the model, an adequate metric for observed sales volumes is designed, qualitative and quantitative variables that influence these sales are determined, and a functional form for the model is chosen. The model is then fitted through a minimum-squared difference linear regression. A methodology for measuring price elasticity of demand is implemented and incorporated in the model and the desired sales forecasts are then possible.
4.2 Data Mining
The first step in developing the forecasting model was to determine the available data, and most importantly, the data that would normally be available when the model is first run at the beginning of the Clearance Sales and subsequently, each time a pricing list needs to be generated. Most of this information was known from the previous experience of the MIT1 project or from Caro and
Gallien’s initial visits to Zara.15 In addition, the scope of the forecasting model and grouping of data
was based both on the Clearance Groups used in the legacy pricing methodology (2.3) and on achieving the right balance between detail and data reliability.
4 . 2 . 1 T i m e P e r i o d s
Zara logs point-of-sale records on a daily basis and results from a day’s sales are generally available and consolidated at their main headquarters during the morning of the next day. This allows us the flexibility to have a very fine level of detail that we can also summarize on a higher level when convenient.
Such is the case of the Regular Season sales data that is available when the model is first run before the first week of Clearance Sales. Because of the seasonality in sales that occurs from one day of the week to the other, and between weeks within the year, the most sensible grouping of the data is to group it by calendar weeks. This means that for the Regular Season, all the available data (i.e., sales, inventories, shipments, etc.) is summarized by week when it is extracted from the repository
database and made available to the model. In this way, the volume of the data that needs to be handled is reduced significantly without sacrificing the value of its information.
Similarly, for the Clearance Season, the most sensible grouping of data registers corresponds to grouping by Clearance Periods, which are defined as the periods between the times when successive pricing decisions are made. The idea behind this reasoning is to summarize the data under time units at which the References did not suffer any price changes. In order to avoid overlapping periods between different Price Clusters in a Clearance Group, the Clearance Periods are terminated or split whenever any of the Clusters within any of the Groups suffers a price change. In other words, a Clearance Period ends and another one begins every time that the pricing team at Zara meets to define prices and sends its pricing decisions out to the stores; this corresponds to the moment when the currently discussed model is run to generate a pricing suggestion list. In addition to the current Regular Season data, information from previous years’ Regular and Clearance Seasons is also available and provides useful insight on the behavior of Clearance Sales and its relation to the Regular Season sales when the current Clearance Sales have yet to begin. Once the Clearance Sales start, new data is gathered on a daily basis and we no longer have to rely solely on previous years’ data to evaluate the effect of selling References at a discount, as we now have relevant data from the actual References being sold.
4 . 2 . 2 D a t a T r e a t m e n t
Zara introduces approximately 11,000 new References (Model/Quality) every year and maintains individual daily point-of-sale records at a Store, Color, and Size level of detail. Given this, one may be tempted to design a model that forecasts sales for each Store, Reference, Size, and Color, however, business intuition and data reliability dictate otherwise.
From a revenue perspective, it makes no difference whether a Reference was sold in one Store or another, or in one particular Color or Size as they all are priced equally, i.e. the profits generated in all the Stores in that Country are unaffected, so this increased level of detail in forecasting does not add value. If we go to the other extreme, we might want to generate a sales forecast for all
References within a Clearance Group that are sold at the same price, however, different References exhibit very different sale behaviors that we can only accurately capture when we forecast each Reference separately.
One additional point to support this approach is that we found out that inventory and sales data in Zara is most accurate when observed at an aggregate Reference level. This is due to error in the manual entry of data at stores and to Zara’s consolidation of invoice differences that is done at a Reference level.
For these reasons, sales forecasts are made at a Reference level. However, as previously discussed in Chapter 2.3, during Clearance Sales, References are grouped by Clearance Group (e.g. Blazers Woman) and Price Cluster (e.g. References with a Regular Season price of 129 EUR), and a single price is assigned to each grouping, so that the pricing decision is made at this aggregated level. Consequently, the data treatment can be more accurately described as: sales are first forecasted at a Reference level and are then aggregated by Price Cluster and fed into the Optimization Model that makes the pricing decision at this aggregated level.
4 . 2 . 3 I n s t a n c e s a n d M o d e l S c o p e
Because each Season, Section, Country and Clearance Group exhibits different sales behavior, a separate instance of the model is fitted for each of these combinations (e.g. summer, women’s sales in Germany for the Blazers Basic group). In other words, a different model is run and a price list generated for every Clearance Group in each of the Sections in each Country so if, for example, the model was to be implemented for all of the more than seventy countries where Zara operates, and for each of its more than twenty Clearance Groups, then more than 1,400 instances of the model would be invoked every time that pricing decisions were made. This configuration also allows for the flexibility of including different model variables for different groups and countries, should it be required.
4.3 Measuring Sales
Zara’s business is characterized by well-defined seasonal trends and sales of a particular Reference will vary depending on the Store at which it is sold, and the Colors and Sizes that it is offered in. Therefore, before selecting the variables that are explanatory of sales and fitting a linear regression model, it is first necessary to design an unbiased metric for sales that will remove the nonlinear effects of seasonality and product assortment so that the true relationship between the explanatory variables and sales can be determined.
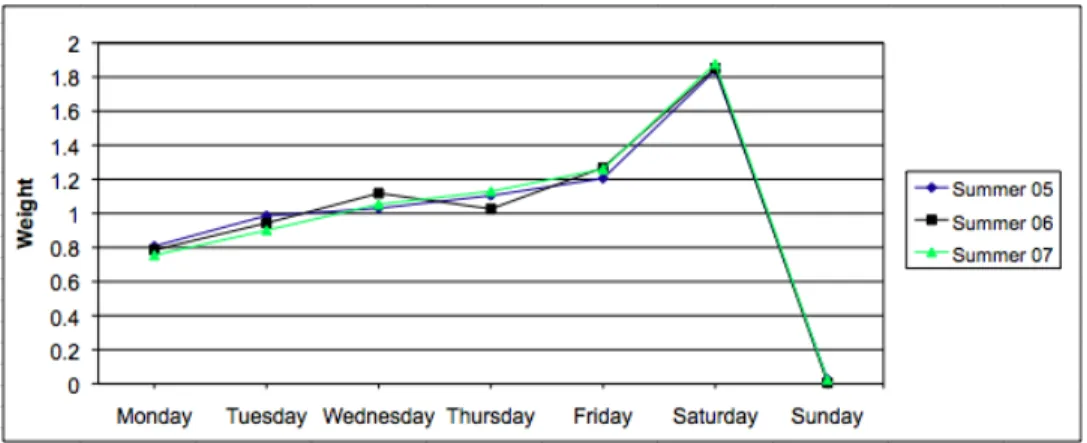
4 . 3 . 1 S e a s o n a l i t y
There are two types of seasonality inherent in Zara’s sales trends: intra-week and inter-week seasonality. Intra-week seasonality refers to the seasonality observed from one day of the week to the other, e.g. sales on a Friday tend to be greater than sales on a Monday. We need to normalize the observed sales for this seasonality because otherwise, in fitting a regression model, we would look at instances in which one same Reference, under equal conditions, exhibits different sales which can be explained by none other factor than the day of the week the sales took place. In order to determine this intra-week seasonality, we look at the aggregate sales levels throughout the Regular Season and assign a weight to each day of the week and normalize it so that the sum of all weights is equal to seven16. Intra-week seasonality weights for a sample Country and Clearance Group for
three consecutive Summer Campaigns are shown in Figure 12, and it can be seen how the intra-week seasonality trends are very consistent from one year to the other:
Figure 12: Sample Intra-Week Seasonality Weights for the Summer Campaign
Similarly, inter-week seasonality measures the different sales patterns from one week of the Regular Season to the other, and accounts for regular sales trends within the year and other special events such as national holidays, which can affect the observed sales. Figure 13 shows the weighting of the inter-week seasonality for a sample Country and Clearance Group:
Figure 13: Sample Inter-Week Seasonality Weights for the Summer Campaign
In this example, sales for the Summer Campaign begin to ramp up during the last weeks of the previous year and come to a halt at around week number twenty-six, when the Clearance Season begins.17 Inter-week seasonality weights are calculated as the fraction over the total Regular Season
sales that each week’s sales represent, and normalized so that the sum of the weights is equal to the number of weeks considered.
Different Countries and different Clearance Groups exhibit different seasonality trends, e.g. Thursdays are important sales days in The Netherlands but not quite as important in Spain, so this exercise is repeated for each Country and Clearance Group. Finally, as discussed in section 4.2.2, because the Regular Season data is grouped by calendar week, only the inter-week seasonality weighting needs to be applied to this data. On the other hand, because Clearance Season data is grouped by Clearance Periods, the individual intra-week weightings are applied to each specific day-of-the-week within each Clearance Period.