Publisher’s version / Version de l'éditeur:
Arctic and Alpine Research, 10, 4, pp. 769-774, 1978-11
READ THESE TERMS AND CONDITIONS CAREFULLY BEFORE USING THIS WEBSITE. https://nrc-publications.canada.ca/eng/copyright
Vous avez des questions? Nous pouvons vous aider. Pour communiquer directement avec un auteur, consultez la première page de la revue dans laquelle son article a été publié afin de trouver ses coordonnées. Si vous n’arrivez pas à les repérer, communiquez avec nous à PublicationsArchive-ArchivesPublications@nrc-cnrc.gc.ca.
Questions? Contact the NRC Publications Archive team at
PublicationsArchive-ArchivesPublications@nrc-cnrc.gc.ca. If you wish to email the authors directly, please see the first page of the publication for their contact information.
NRC Publications Archive
Archives des publications du CNRC
This publication could be one of several versions: author’s original, accepted manuscript or the publisher’s version. / La version de cette publication peut être l’une des suivantes : la version prépublication de l’auteur, la version acceptée du manuscrit ou la version de l’éditeur.
Access and use of this website and the material on it are subject to the Terms and Conditions set forth at
A seismic and pressure transducer system for monitoring velocities
and impact pressures of snow avalanches
Salway, A. A.
https://publications-cnrc.canada.ca/fra/droits
L’accès à ce site Web et l’utilisation de son contenu sont assujettis aux conditions présentées dans le site LISEZ CES CONDITIONS ATTENTIVEMENT AVANT D’UTILISER CE SITE WEB.
NRC Publications Record / Notice d'Archives des publications de CNRC:
https://nrc-publications.canada.ca/eng/view/object/?id=5f398ed8-d530-4333-8eba-b4ffad4a2ee3 https://publications-cnrc.canada.ca/fra/voir/objet/?id=5f398ed8-d530-4333-8eba-b4ffad4a2ee3National Research Council of Canada Conseil national de recherches du Canada
A SEISMIC AND TRANSDUCER SYSTEM
VELOCITIES AND IMPACT PRESSURES
by A. A. SalwayReprinted
from
Arctic and Alpine Research Vol. 10, No. 4, November 19-78 pp. 769-774
DBR Paper No. 793
Division of Building Research
Price 10 cents OTTAWA
FOR MONITORING
OF
SNOW AVALANCHES
SOMMAIRE
r T
Une avalanche a ktk surveillee au moyen naux Cmis par ces detecteurs peuvent semir cle sismographes placks le long d u couloir de a mettre I'kquipement d'enregistrement en l'avalanche et les forces d'impact ont etk marche. Les correlations existant entre les mesurees a l'aide de transducteurs a pres- signaux d u sismographe et d u transducteur sion. Des rksultats preliminaires indiquent permettent de determiner approximative- que les sismographes peuvent constituer ment les vitesses de l'avalanche a kvaluer. une methode fiable et peu cofiteuse pour Le prksent article analyse ces signaux et detecter les risques d'avalanche. Les sig- traite des caractkristiques de l'avalanche.
Arctic and Alpine Research, Vol. 10, No. 4, 1978, pp. 769-774 Copyrighted 1978. All rights reserved.
A SEISMIC AND PRESSURE TRANSDUCER SYSTEM FOR
MONITORING VELOCITIES A N D IMPACT
PRESSURES OF SNOW AVALANCHES
British Columbia Regional Station
Division of Building Research, National Research Council of Canada, 3904 West 4th Avenue, Vancouver, B . C . , V6R 1P5
ABSTRACT
An avalanche was monitored with seismic recording equipment. Correlations between geophones placed in its track and impact the seismic and pressure signals enable ap- forces were measured using pressure trans- proximate velocities within an avalanche to ducers. Preliminary results indicate that geo- be estimated. The pressure signals are ana- phones may provide an inexpensive and reli- lyzed and the characteristics of the avalanche able method of detecting avalanche events. discussed.
Signals from these sensors can be used to start
INTRODUCTION Ives et al. (1973) and Harrison (1976) inves-
tigated the possibility of monitoring ava- lanche occurrences using seismic equipment but encountered problems differentiating avalanche signals from background noise. Seismic and infrasonic detectors were some distance from the avalanche track and the frequency response of the instrumentation was rather low. St. Lawrence and Williams (1976) successfully recorded several ava- lanches using a 28-Hz vertically mounted re- flection geophone in the starting zone of an avalanche path. In this current study, geo- phones were placed in the track (middle sec- tion) of an avalanche path along with pres- sure sensing equipment, so that seismic sig- nals and impact pressures of a moving ava- lanche could be recorded.
Accurate studies of avalanche impact pres- sures are important in the design of structures exposed to avalanches such as electric trans- mission line towers, bridges and snow sheds.
Schaerer (1973) has analyzed eight avalanches during 2 yr of observations. In these and sub- sequent studies many events were not re- corded. Impact pressure microswitches have been employed to trigger (start) the recording instrumentation. These triggers rely on actual avalanche impacts to create an open circuit; they are vulnerable to damage and prone to jamming. A more reliable triggering system is therefore needed. If seismic signals associated with avalanches can be recognized and distin- guished from background noise, geophones can be used to trigger the instrumentation.
Avalanche velocities must also be measured along with impact pressures in order to deter- mine the relationship between these factors. Schaerer (1973) obtained rough estimates of avalanche velocities by measuring the times required for avalanche fronts to travel from the start trigger to the pressure stand (Fig- ure 1). Because the actual front may miss the start trigger and hit the pressure cells, or vice
versa, these estimates of frontal velocities can ferent speeds. Ideally, velocity and pressure be in error. Furthermore, the core or surface distributions should be monitored for the flow of the avalanche may be travelling faster duration of the avalanche, if the relationship or slower than the front. Within the core between these quantities is to be properly there may be surging during which various understood.
phases of the avalanche are travelling at dif-
INSTRUMENTATION Four Geospace GSC-ZOD 14-Hz vertical
geophones were buried about 150 mm deep (for maximum ground coupling) in the bed of an avalanche gully, Tupper 1, at Rogers Pass, prior to the start of the 1976/77 ava- lanche season. These geophones were con- nected via 350 m of buried armored cable to four operational amplifiers and a Hewlett Packard 3968A FM eight-channel tape re- corder situated in a highway snow shed. The other four channels of the tape recorder were connected via signal conditioners and bridge amplifiers to two Statham UC3 load cells and two Kulite TC 2000 cells, rigidly mounted on a stand in the track. These pressure cells are similar to those described by Schaerer (1973). They are small, presenting a loading surface of 645 mm2 (1 in2) to the avalanche flow; the
outer cases are cylindrical and streamlined to minimize flow disturbance. The configura- tion of seismic and pressure sensors in the ava- lanche track is shown in Figure 1.
A start trigger, T I , consisting of a pressure plate and housing similar to one of the pres- sure cells, is fixed to a stand high in the ava- lanche gully, above the pressure stand. This trigger contains a microswitch, normally closed, that opens on receiving an impact of sufficient magnitude. If the start trigger cir- cuit is opened, a "timer trigger control" generates a start function at the tape recorder and recording begins. Recording ceases after a preset delay time (up to 99 s) has elapsed. An open stop trigger, T2, stops a timer that was activated by the opening of the start trigger circuit. The timer indicates the inter-
1 , 2 , 3 A N D 4 ARE S E I S M I C G E O P H O N E S FIGURE 1. Seismic and A , B , C A N D D ARE PRESSURE C E L L S
TI I S T H E START T R I G G E R pressure sensors in gully of Tupper 1 avalanche T 2 I S T H E S T O P T R I G G E R site.
val that elapsed between triggers. Small ava- carried out in the field laboratory by loading lanches tend to deposit more snow at the start each one with standard weights and recording trigger stand than at the pressure stand. signal levels on the tape recorder for each Hence, to ensure that snow did not cover TI, channel. Calibration of the geophones was it was situated higher above the surface than unnecessary because relative amplitudes only
T2. were required for this study.
Static calibration of the pressure cells was
SOME PRELIMINARY RESULTS A dry avalanche of medium size and of
mixed type (partly airborne powder and partly flowing) occurred on Tupper 1 at ap- proximately 2000 h on 10 February 1977. Chunks of snow, between 100 and 150 mm in diameter, were found in the deposit. This was a natural avalanche resulting from a steady buildup of new snow, approximately 45 cm measured at Rogers Pass observatory over 2-
1/2 days, combined with steady winds, 35 to
60 km h-I during the 4 h preceding the ava- lanche; temperatures were close to freezing. The timer trigger control was successfully activated and the avalanche was recorded. The stop trigger circuit was apparently not opened until sometime after the avalanche front had passed since the time interval be- tween triggers was excessively long. An accu- rate estimate of the velocity of the front could not therefore be obtained from the timer.
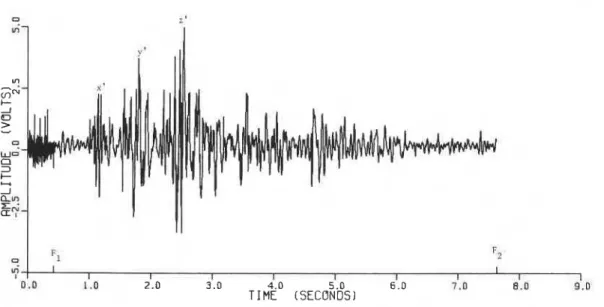
SEISMIC SIGNALS AND VELOCITY ESTIMATION Geophone 2 provided the only reliable seis-
mic signal for this avalanche (Figure 2). A power spectrum produced by Fourier trans- forming the geophone 2 trace over the time interval F1F2 indicated that most of the seis- mic energy associated with the avalanche, after filtering by snowpack and ground, lay within a frequency bandwidth of about 2 to
30 Hz.
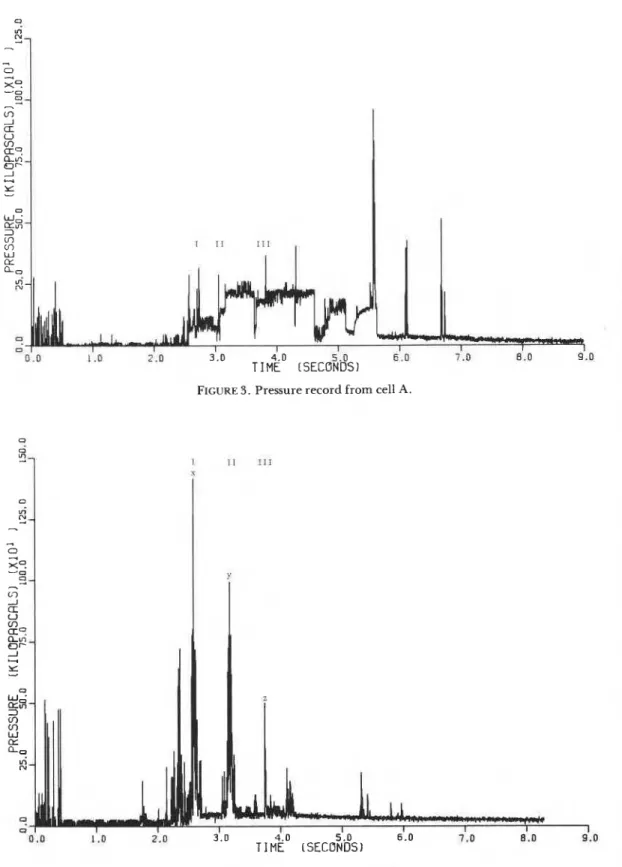
The general characteristics of the seismic signal suggest that the avalanche passed over geophone 2 in a succession of waves or surges. This is borne out when the pressure traces for cells A and C are examined (Figures 3 and 4). Peaks, x, y, z on the pressure trace for cell C appear to correlate well withx', y', z' on the seismic trace. Because geophone 2 was
30.5 m upslope from the pressure stand (Fig-
FIGURE 3 . Pressure record from cell A .
F ~ G U R E 4. Pressure record from cell C .
ure l ) , these correlations can be used to ob- rate estimates of avalanche downslope veloci- tain estimates of downslope velocity. Values ties may be achieved by cross-correlating the of 2 1 . 6 , 2 2 . 1 , and 2 4 . 2 m s-', respectively, seismic traces. The velocities obtained in this were obtained for the first three phases, I, I1 study, by correlating a seismic trace with a and I11 of the avalanche. For future investiga- pressure record, appear to be reliable esti- tions it is expected that more than one seismic mates as three phases within the recorded record will be obtained, in which case accu- avalanche were well defined.
IMPACT PRESSURES Theoretical studies made by Voellmy
(1955), Mellor (1968), and Shen and Roper (1970) suggest that avalanche impact pres-
sures on a rigid obstacle can be described by
where
p
is the pressure, v the velocity, and k is a coefficient. The coefficient, k , is thought to be a function of snow densities before and after impact. Deformation of the avalanche snow may be partly elastic or plastic depend- ing on its density, free water content, and temperature. The avalanche may behave as a fluid or a collection of solid particles or blocks.Load cells A and C gave the only reliable pressure recordings for the 10 February 1977 avalanche event. The pressure records, Fig- ures 3 and 4, consist essentially of a series of high pressure peaks superimposed on a rela- tively uniform base pressure. Substituting, into equation 1 , the estimated velocities and impact pressures obtained from these record- ings for phases I, 11, and I11 of the avalanche, values for k were calculated. Average k was
600 kg m-3 for peak pressures on cell A and 2000 kg m-3 for cell C. Schaerer (1973) found
that mean peak pressures could be approxi- mated by
for eight avalanche events at Rogers Pass,
where P d is the density of the deposited snow
and c is a constant equal to 0 . 5 . For the ava- lanche under investigation in this study, the mean density of the deposit was measured and found to be 330 kg m-3. The coefficient c was therefore approximately 2 . 0 for cell A but about 6 . 0 for cell C. Reexamination of origi- nal data used by Schaerer (1973) suggests that c could be close to unity for peak pressures. He thought that peak pressures were caused by individual impacts of snowballs of density approximately equal to that of the final ava- lanche deposit. Kotlyakov et al. (1976) report
results indicating that c could be as high as
2 . 0 . Some "overshooting" of the pressure
plate due to underdamping may have caused higher than actual pressures to be recorded by cell C.
Average k was 320 kg m-3 for base pressures on cell A and 90 kg m-3 for cell C. Using 330 kg m-3 for the density of the avalanche de- posit, c was therefore approximately unity for cell A and about 0 . 3 for cell C. Schaerer
(1973) found that c was 0.17 for base pres- sures. He thought that base pressures were caused by flowing snow. By comparing ava- lanche flow depths with depths of deposit, he proposed that for dry snow
where P, is the bulk density of the flowing
snow.
DISCUSSION
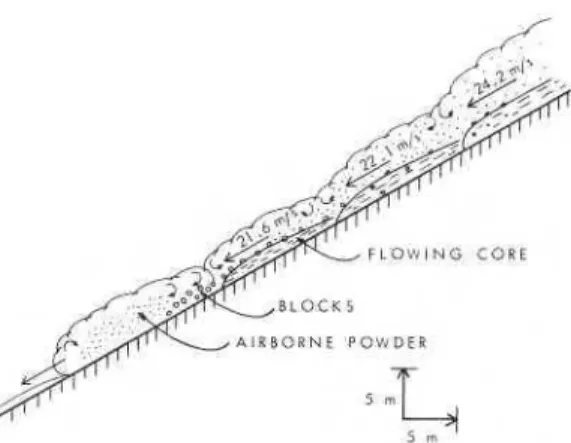
A dynamic model for the 10 February 1977 tive as only a limited amount of information avalanche on Tupper 1 can be constructed was available. Base pressures recorded by cell from the estimated velocities and pressures for A were probably produced by the dense flow- phases I, 11, and 111. This model is shown in ing core of the avalanche. The upper part of Figure 5 and is, of course, somewhat specula- this flow caused lower base pressures to be re-
corded o n cell C . Peak pressures o n cell A were probably d u e t o small chunks within t h e core, while the higher peak pressures o n cell C may have been t h e result of larger blocks tumbling i n turbulent vortices n e a r the u p p e r boundary of the m a i n flow. Debris drops o u t continuously as new snow is picked u p f r o m the track. T h i s energy exchange process is probably a major factor causing the variation of velocities within the avalanche.
CONCLUSIONS
Seismic geophones c a n b e employed t o de- tect avalanche occurrences a n d start record- ing instrumentation. Seismic signal threshold detection triggers were included i n t h e re-
cording system for the 1977/78 avalanche sea-
son a n d worked well. Avalanches produce characteristic signals t h a t c a n b e used t o de- termine velocities within the avalanche. These velocities a r e required for the analysis of avalanche pressure measurements.
ACKNOWLEDGMENTS
T h i s p a p e r is a contribution f r o m t h e Divi- sion of Building Research, National Research Council of C a n a d a , a n d is published with t h e approval of t h e Director of the Division.
REFERENCES CITED
Harrison, J. C., 1976: Seismic signals from ava- lanches. In Armstrong, R. L. and Ives, J. D. (eds.), Avalanche Release and Snow Character- istics, San Juan Mountains, Colorado. Inst. Arct. Alp. Res., Uniu. Colorado, Occas. Pap.,
19: 145-150. (INSTAAR-14-06-7155-4.) Ives, J. D., Harrison, J. C., and Armstrong, R. L.,
1973: Development of methodology for evalua- tion and prediction of avalanche hazard in the San Juan mountain area of southwestern Colo- rado. Inst. Arct. Alp. Res., Univ. Colorado. Interim report (INSTAAR-14-06-7155-2).
Kotlyakov, V. M., Rzhevskiy, B. N., and
Samoylov, V. A . , 1977: The dynamics of ava-
F L O V I N G CORE
A I R B O R N € POWDER
FIGURE 5. Dynamic model of 10 February 1977
avalanche on Tupper 1 between geophone 2 and pressure stand.
lanching in Khibins. In: Proceedings of Confer- ence on Applied Glaciology, Cambridge, 13-1 7
September 1976. J . Glaciol., 19(81): 431 -439.
Mellor, M., 1968: Avalanches. Cold Reg. Sci.
Eng., Part 111-A3d. U.S. Army, CRREL, Han- over, N.H. 215 pp.
Schaerer, P. A , , 1973: Observations of avalanche
impact pressures. In: Advances in North
American Avalanche Technology: 1972 Sym- posium. USDA For. Seru. Gen. Tech. Rep.,
RM-3. Rocky Mt. For. and Range Exp. Sta., Fort Collins, Colorado, 51 -54.
Shen, H. W. and Roper, A. T . , 1970: Dynamics of snow avalanches (with estimation for force on a bridge). Int. Assoc. Sci. Hydrol. Bull., 15(1): 7- 26.
St. Lawrence, W. and Williams, T. R., 1976: Seis- mic signals associated with avalanches. J . Glaciol., 17(77): 521 -526.
Voellmy, A , , 1955: ~ b e r die Zerstorungskraft von
Lawinen. Schweizer Bauzeitung, Jahrg., 73:
159-165, 212-217, 246-249, 280-285. (English translation: On the destructive force of ava- lanches. Alta Avalanche Study Center, Transl.
2, 1964. 63 pp. On file at Rocky Mt. For. and Range Exp. Sta., Fort Collins, Colorado.)
Ms submitted March 1978
This publication is being distributed by the Division of Building Research of the National Research Coun- cil of Canada. It should not be reproduced in whole or in part without permission of the original publisher. T h e Division would be glad to be of assistance in ob- taining such permission.
Publications of the Division may be obtained by mail- ing the appropriate remittance (a Bank, Express, or Post Office Money Order, or a cheque, made payable to the Receiver General of Canada, credit NRC) to the National Research Council of Canada, Ottawa. K1A 0R6. Stamps are not acceptable.
A list of all publications of the Division is available and may be obtained from tlie Publications Section, Division of Building Research, National