HAL Id: insu-02369986
https://hal-insu.archives-ouvertes.fr/insu-02369986
Submitted on 20 Nov 2019
HAL is a multi-disciplinary open access
archive for the deposit and dissemination of
sci-entific research documents, whether they are
pub-lished or not. The documents may come from
teaching and research institutions in France or
abroad, or from public or private research centers.
L’archive ouverte pluridisciplinaire HAL, est
destinée au dépôt et à la diffusion de documents
scientifiques de niveau recherche, publiés ou non,
émanant des établissements d’enseignement et de
recherche français ou étrangers, des laboratoires
publics ou privés.
Carlos Fernández-García, Benjamin Guillaume, Jean-Pierre Brun
To cite this version:
Carlos Fernández-García, Benjamin Guillaume, Jean-Pierre Brun. 3D slab breakoff in laboratory
experiments. Tectonophysics, Elsevier, 2019, 773, pp.228223. �10.1016/j.tecto.2019.228223�.
�insu-02369986�
Contents lists available atScienceDirect
Tectonophysics
journal homepage:www.elsevier.com/locate/tecto
3D slab breako
ff in laboratory experiments
Carlos Fernández-García
*
, Benjamin Guillaume, Jean-Pierre Brun
Univ Rennes, CNRS, Géosciences Rennes, UMR 6118, Rennes, France
A R T I C L E I N F O Keywords: Analogue modelling Continental subduction Slab breakoff Passive margin Topography A B S T R A C T
We study slab breakoff of subducting plates with variable orientations of passive margins (ocean-continent transition: OCT) using three-dimensional laboratory experiments. Our results show that the initial obliquity of the OCT with the trench determines the depth and timing of slab breakoff. The reference model involves a straight OCT parallel to the trench. Slab breakoff first starts in the central section of the subduction zone at a depth equivalent to∼250 km and then propagates rapidly towards the edges of the subduction zone where it develops at slightly higher depths (∼280 km). In the models where passive margin arrives first at the edges of the subduction zone, slab breakoff starts at that location and propagates laterally towards the center of the subduction zone. It results in higher slab breakoff depths at the edges of the subduction zone than at the center (maximum difference of 170 km). In models where the passive margin arrives first in the center of the sub-duction zone, slab-breakoff starts at that location and propagates towards the edges of the subsub-duction zone over a period that can be as large as 31 Ma and with a large range of depths (maximum difference of 170 km). The rate of lateral propagation of slab breakoff decreases with the increasing initial obliquity of the OCT with the trench. The model with the maximum obliquity shows a correlation between the surface topography and the slab breakoff at depth. The plate surface is uplifted after the oceanic and continental slab segments are mechanically decoupled, and in thefinal stage of the experiment, when the slab is educted, subsidence develops as the isostatic and dynamic support diminish.
1. Introduction
Slab pull is generally considered as the main driving force for plate motions (Forsyth and Uyeda, 1975;Royden, 1993), and is caused by the negative buoyancy of a subducting oceanic lithosphere. The progressive consumption of oceanic lithosphere at subduction zones can lead to the closure of oceans and to the arrival at the trench of continental litho-sphere (e.g.,Rosenbaum et al., 2002). The positive buoyancy force that results from the continental lithosphere subduction acts as a force op-posing to the oceanic lithosphere slab pull, leading to slab stretching, necking and ultimately to breakoff (Davies and von Blanckenburg, 1995;Ton and Wortel, 1997). In nature, the breakoff of the subducted lithosphere can be indirectly identified by looking at surface changes resulting from perturbations of slab pull and mantle dynamics at depth. In particular, it has been proposed that uplift, sudden changes in de-formational regime, changes in magmatic products or fast exhumation of High Pressure rocks may result from slab breakoff at depth. For ex-ample,Hippolyte et al. (1994)proposed slab breakoff as a mechanism
to explain the uplifted Apenninic belt and the subsequent changes in the stressfield from compression before the Middle Pleistocene to extension perpendicular to orogenic axis afterwards.Westaway (1993)indicated
that the high uplift rates observed in the south-western Italy (compared to the eastern coast) could be related to the breakoff beneath the Ca-labria region in the Middle Pleistocene.Davies and von Blanckenburg (1995)proposed for thefirst-time slab breakoff in the Alps to explain the evolution of the Tertiary magmatism, uplift, and exhumation of subducted continental rocks.Brun and Faccenna (2008)proposed for the Calabrian-Apennines and Aegean subduction zones that subduction of a buoyant continental lithosphere into the mantle can trigger slab rollback followed by slab breakoff, creating space for the exhumation of HP rocks. Therefore, slab breakoff has an imprint on the geological record and the surface topography that can be recognized and tracked in thefield.
An important effort has been made in the last years to better un-derstand the dynamics of slab breakoff. In particular, numerical mod-eling studies have shown that breakoff depths are significantly influ-enced by the age and the implemented rheology in the subducting plate. As a result, the slab breakoff in these models develops over a broad range of depths (80–510 km) and requires between ̴1 and 50 My for the slab breakoff after the arrival of continental lithosphere at the trench (Fig. 1andTable 1) (Gerya et al., 2004;Baumann et al., 2010;
van Hunen and Allen, 2011;Duretz et al., 2014;Schellart, 2017;Magni
https://doi.org/10.1016/j.tecto.2019.228223
Received 22 May 2019; Received in revised form 30 September 2019; Accepted 6 October 2019
⁎Corresponding author.
E-mail address:[email protected](C. Fernández-García).
Tectonophysics 773 (2019) 228223
Available online 01 November 2019
0040-1951/ © 2019 The Authors. Published by Elsevier B.V. This is an open access article under the CC BY license (http://creativecommons.org/licenses/BY/4.0/).
et al., 2017;Freeburn et al., 2017;Hertgen, 2018).
Various attempts have also been made to study slab breakoff de-velopment using analogue models (Fig. 1).Regard et al. (2008), for instance, investigated slab breakoff by using lithospheric models made of a two-layer system (PDMS silicone mixed with ironfillers and sand) and by imposing horizontal convergence with a piston. While these models show that slab break-off may impact the successive subduction polarities, they have some limitations. In particular, the slab can in-teract with the bottom of the experimental tank before the breakoff while this interface that corresponds to a 1600–1700 km depth dis-continuity has no equivalent on Earth. Boutelier and Cruden (2017)
also simulated slab breakoff using a thermomechanical setup consisting of afixed overriding plate and a subducting plate made of thixotropic dispersions of solid hydrocarbons and powders in oil that are sensitive to the temperature and to strain rates. They concluded that the slower the convergence rate is, the sooner the slab breaks off. However, these models also have some limitations, such as the use of a low-viscosity fluid (water) to model the sub-lithospheric mantle that results in an overestimated subduction velocity for the detached slab segment (∼10 m/yr in their Experiment 4). Recently, Broerse et al. (2019)
showed that a proper mix of PDMS, ironfiller, silicone oil, and plasti-cine could produce a material with a power-law rheology, capable of localizing deformation at stress levels typically recorded in the la-boratory. While encouraging, the results presented in their study are
only preliminary and would require further testing.
All these studies have provided essential insights into the dynamics of slab breakoff and its consequences at the surface, but they also lack essential ingredients to fully comprehend slab breakoff in natural sys-tems. In particular, most of the numerical models are 2-D and as such do not incorporate critical 3D effects (toroidal mantle flow, lateral propagation of slab breakoff). 3D experiments (analogue and numerical models) integrate such effects but generally do not consider the lateral variability of the subducting lithosphere that may exist in natural sys-tems. In particular, they all treat the ocean-continent transition (OCT) as a straight boundary, parallel to the trench, while a broader range of geometries and orientations for the OCT may exist in nature (e.g., Banda Arc).Spakman and Hall (2010)suggested that the present-day morphology of the Banda Arc is the consequence of the Banda oceanic slab affected by rollback since 15 Ma. According to their reconstruction, at that time, the transition from oceanic to continental lithosphere in the subducting plate was not parallel to the trench, and continental subduction started in the northern part of the Banda arc.
In this study, we present thefirst series of 3D analogue models with different OCT geometries. For this, we systematically change the angle between the OCT direction in the subducting plate and the trench di-rection. We analyze the effects of the OCT geometry on the timing and the depth of the subsequent slab breakoff. Further, we analyze the rate of slab breakoff lateral propagation and its topographic signature. Finally, we discuss the implications of our results for natural con-vergence zones.
2. Model set-up
2.1. Materials and scaling
Our subduction set-up consists of two layers made of visco-elastic PDMS silicone representing the subducting lithosphere and glucose syrup simulating the sub-lithospheric mantle (Table 2), as implemented in previous studies (e.g.,Funiciello et al., 2003;Bellahsen et al., 2005;
Martinod et al., 2005;Schellart, 2005;Guillaume et al., 2010;Husson et al., 2012). In our models, the thermal convection is neglected. The mantleflows only under stresses resulting from the slab sinking. The subducting plate is free to move, responding self-consistently to the subduction dynamics and sinks into the mantle under its own weight. The overriding plate is not simulated in our setup. We therefore assume that it would passively follow the motion of the trench, without mod-ifying the general behavior of the subduction system.
In our setup (Fig. 2), we assume no viscosity jump at the transition between the upper and the lower mantle. We simulate cases for which the subducting lithosphere penetrates directly into the lower mantle, as documented in several subduction zones (Goes et al., 2017). We stop the experiments before the slab reaches the bottom of the box, which here does not represent any natural discontinuity.
Our models reproduce the arrival of a continental lithosphere at the trench following the subduction of an oceanic lithosphere. To achieve this, a 20 cm wide (1500 km in nature) plate of PDMS silicone mixed with sand (continental lithosphere) is attached to the trailing edge of a silicone plate made of a mixture of PDMS and iron powder (oceanic lithosphere) (Fig. 2andTable 2). The average density contrast of the two attached plates with the underlying glucose syrup is 280 kg/m3and
Fig. 1. Compilation of slab breakoff depths and timing after the onset of the continental subduction from previous modeling studies (seeTable 1for refer-ences). Minimum and maximum values for the models presented in this study are represented by the dashed rectangle. The reference model (H-180) is in-dicated with a dotted frame.
Table 1
Slab breakoff depths and timings obtained in previous analogue and numerical models.
Slab breakoff depthsa(km)
Slab breakoff timeb
(Myr) References Key in Fig. 1 100-400 9-35 Gerya et al. (2004) 1 300 7 Regard et al. (2008) 2 405-510 2.5-6.7 Baumann et al. (2010) 3 280-400 9-21 Van Hunen and Allen
(2011) 4 120-145 7-23 Duretz et al. (2014) 5 80-240 2-50 Freeburn et al. (2017) 6 200-300 23-35 Magni et al. (2017) 7 95-140 1.5-2.5 Schellart (2017) 8 240-260 16-32 Broerse et al. (2019) 9 290-310 12.5.27 Hertgen (2018) 10
a Range of depths at which the full break-off occurs.
b Time to the full breakoff since the arrival at the trench of the continental
plate.
Table 2
Material properties and scaling of parameters in nature and in the laboratory.
Models α (°) L (cm) l-1 (cm) l-2 (cm) H (cm) S (cm) H-110 110 20 18 11 1 0.6 H-150 150 20 18 15.5 1 0.6 H-180 (reference) 180 20 18 18 1 0.6 H-210 210 20 15.5 18 1 0.6 H-250 250 20 11 18 1 0.6
−80 kg/m3, respectively. In order to maintain the overall slab pull
constant between models, the volume of the subducting oceanic litho-sphere is identical in all the experiments irrespective of the geometry of the OCT. The length of the oceanic lithosphere therefore varies laterally as a function of the OCT orientation.
The passive margin, i.e. the transition from the continental to oceanic lithospheres (OCT), is considered as a weak zone of inherited deformation. This zone is 0.6 cm wide (equivalent to 45 km in Nature), 0.5 cm thick and is simulated with a less viscous layer of pure PDMS silicone (about one order of magnitude lower than the oceanic and continental lithospheres). The OCT silicone is homogeneously seeded with glass beads of 5 mm diameter at a 1 cm spacing, to represent rheological heterogeneities that could result from previous extensional events and to help localizing the deformation. This mixture exhibits a non-Newtonian behavior that can eventually lead to the rupture of the OCT. The combined density of the pure PDMS and seeds correspond to a positive density contrast of 180 kg/m3. The glucose syrup used to
si-mulate the sub-lithospheric mantle has a Newtonian rheology. The slab to mantle viscosity ratio is∼1500, in the upper limits of values pro-posed in previous studies (Di Giuseppe et al., 2008; Funiciello et al., 2008; Wu et al., 2008; Ribe, 2010; Di Caprio et al., 2011). The
assembled system (i.e the oceanic lithosphere, OCT and the continental lithosphere) is placed in the center of a 70 × 50 x 25 cm transparent plexiglass tank,filled with glucose syrup, in order to avoid potential lateral boundary effects (Fig. 2). Materials have been selected to sim-plify the temperature-dependent Earth rheological profile and to re-spect the standard procedure for stress scaled down for length, buoy-ancy, viscosity, in a natural gravityfield (gmodel=gNature) as described
byWeijermars and Schmeling (1986)andDavy and Cobbold (1991). From the simple scaling equations:
(tnature/ tmodel) = ((Δϱgh)model/ (Δϱgh)nature)∙(ηnature/ηmodel)) (1)
(Unature/ Umodel) = (tmodel∙Lnature) / (tnature/Lmodel) (2)
where t is the time,Δϱ the density difference between the oceanic li-thosphere and the asthenosphere, g the standard acceleration due to gravity, h the length,η the viscosity of the asthenosphere, and U the velocity, wefind that 147 s and 1 cm in the experiment correspond to 1 Myr and 75 km in nature, respectively (Table 2).
2.2. Experimental procedure
Wefirst perform a set of 5 experiments in which the initial geometry of the OCT is systematically changed (Fig. 2andTable 3). In order to maintain the subduction symmetrical, the center of the subduction zone is taken as a symmetry axis (i.e. x = 0). Therefore, models are either concave towards the trench (models H-110 and H-150), straight (model H-180) or convex towards the trench (models H-210 and H-250). A sixth experiment, with a geometry similar to model H-250, has been repeated to specifically track the topographic evolution.
We manually initiate subduction by forcing the leading edge of the oceanic silicone plate downwards into the glucose syrup. Each experi-ment is monitored during its entire duration by a sequence of digital pictures taken from the front and top views at a constant time interval of 30 s. The position of both sides of the weak zone was tracked on the frontal view. The slab is considered to be fully detached along a section when the leading edge of the continental lithosphere started moving back to the surface. The depth of slab break-off at a section is therefore the maximum depth reached by the continental lithosphere at that point. As the slab is vertical at the time of the slab breakoff, the length measured on the frontal view corresponds to the depth. On the top
Fig. 2. a) Top view at subduction initiation and lateral view (at x = 0 cm) after the OCT subduction. Dotted lines indicate the coordinate taken as a reference to measure either the plate displacement or the trench displacement. b) Geometries for the subducting lithosphere tested in this study (seeTable 3).
Table 3
Geometrical parameters of the models (seeFig. 2B).
Slab breakoff depthsa(km)
Slab breakoff timeb
(Myr) References Key in Fig. 1 100-400 9-35 Gerya et al. (2004) 1 300 7 Regard et al. (2008) 2 405-510 2.5-6.7 Baumann et al. (2010) 3 280-400 9-21 Van Hunen and Allen
(2011) 4 120-145 7-23 Duretz et al. (2014) 5 80-240 2-50 Freeburn et al. (2017) 6 200-300 23-35 Magni et al. (2017) 7 95-140 1.5-2.5 Schellart (2017) 8 240-260 16-32 Broerse et al. (2019) 9 290-310 12.5.27 Hertgen (2018) 10
a Range of depths at which the full break-off occurs.
b Time to the full breakoff since the arrival at the trench of the continental
plate.
view, we track the displacement in the trench-perpendicular direction (y-axis) of both the trench and the plate trailing edge at surface. As the evolution of the experiments is symmetrical around x = 0 cm, the measurements (slab breakoff depth, timing and buoyancy forces) have been carried out along one side of the subduction zone. While the plate is initially 20 cm wide, its lateral deformation during subduction leads to a narrowing of the subduction zone, which limits the distance over which measurements can be done along trench.
We also track the topographic evolution of the model TH-250 with setup similar to the model H-250. To achieve this, we use a structure-from-motion technique that requires the surface to be tracked to have a texture. Therefore, we cover the model with a thin layer of light and coarse powders mixture (∼0.1 cm thick). This layer increases the sur-face tension at the model sursur-face, which in turn slows down the sub-duction velocity in the model. However, it does not affect the way the slab deforms, and the slab breakoff initiates and propagates.
3. Results
3.1. Slab breakoff depth and timing 3.1.1. Reference model (H-180)
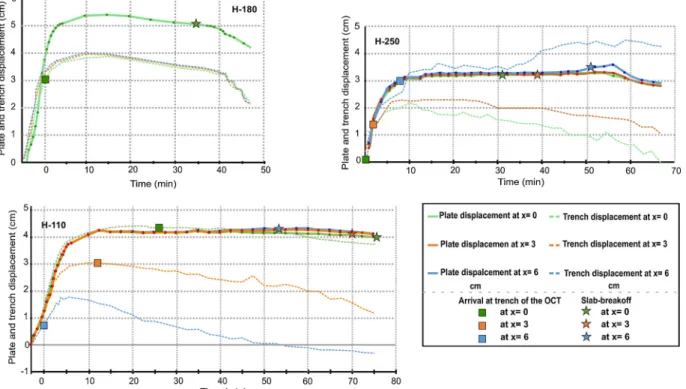
The reference model (H-180) consists of a straight OCT parallel to the trench direction (Fig. 2andTable 3), similar to what has been done in the previous studies. During the initial phase of oceanic subduction, slab pull leads to a trench retreat at velocities of ∼0.6 cm/min. The arrival of the OCT at the trench occurs 5 min after the start of the ex-periment (Fig. 3), and after a few seconds, it is followed by the con-tinental lithosphere (Figs. 3 and 4). Continental subduction results in a progressive decrease of both plate and trench velocities to values close to 0. The OCT is then progressively stretched owing to the combined effects of the negative buoyancy force of the oceanic slab segment and the positive buoyancy force of the continental slab segment. Once stretching is strong enough, the continental segment separates -i.e.
breakoff- from the oceanic segment (Fig. 4).
Slab breakoff occurs almost simultaneously in the central portion of the slab (between x = 0 and x = 5.5 cm,Fig. 2a) 34 min after the onset of continental subduction (Figs. 3 and 4), and then it laterally propa-gates towards the edges of the subduction zone. Once the oceanic li-thosphere is completely detached, after 36 min, it continues to sink at a rate of 0.85 cm/min (∼15.5 cm/yr in nature) while the continental subducted segment is educted towards the surface at an average rate of ∼0.03 cm/min (0.55 cm/yr in nature).
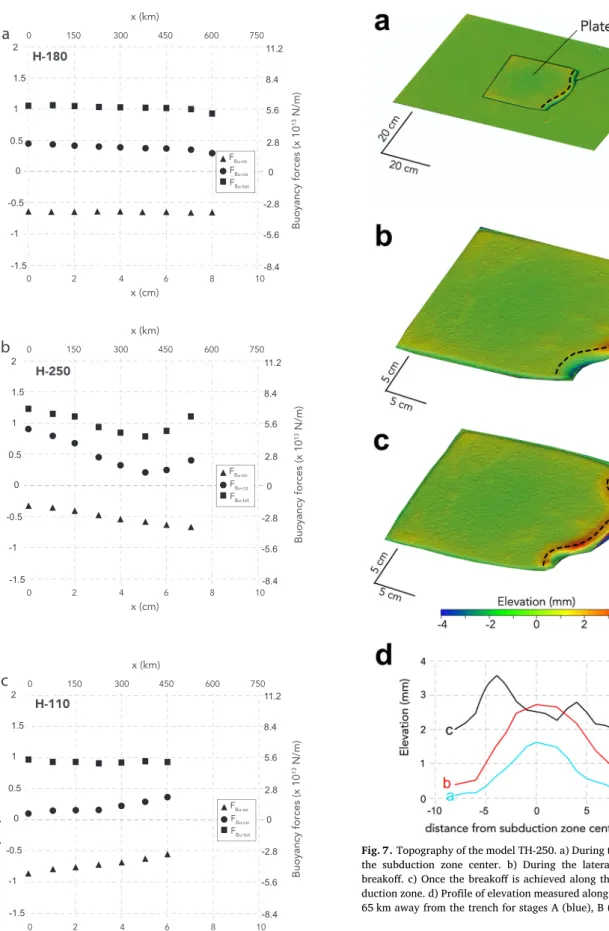
In the reference model (Fig. 5), the continental lithosphere reaches a maximum depth of 3.3 cm (∼250 km in nature) at the subduction zone center, 34 min (∼14 Ma in nature) after the OCT arrival at the trench. Slab breakoff propagates laterally over the first 5 cm (375 km in nature) at the same depth of 3.3 cm. For the last 3 cm -i.e. at the slab edges- slab breakoff occurs at greater depths, with a peak at 3.7 cm (∼280 km in nature). The lateral propagation of the breakoff is instantaneous for the first 5.5 cm, and its average velocity over the first 8 cm from the sub-duction zone center is∼ 4 cm/min (74 cm/yr in nature) (Fig. 5).
The main buoyancy forces involved in the system are that of the oceanic slab segment (FBu-oc) and the continental slab segment (FBu-co),
which are expressed per meter length of trench as:
FBu-oc=Δρocg hocLoc (3)
FBu-co=Δρcog hcoLco (4)
withΔρ the density difference between the considered slab segment and the surrounding mantle, h the thickness of the slab and L the length of the considered slab segment. Note that the calculation of FBu-coincludes
both the continental segment and the OCT. The total buoyancy force writes as:
FBu-tot= FBu-co-FBu-oc (5)
The buoyancy force related to the oceanic slab segment is computed from the measured length of the oceanic lithosphere at the time of slab breakoff for different sections along the subduction zone. The buoyancy
Fig. 3. Plate displacement (solid lines) and trench displacement (dotted lines) measured along three cross-sections perpendicular to the trench direction for models H-180, H-250 and H-110 (Fig. 2a). An increase in the plate displacement indicates that the plate is advancing towards the trench. An increase in the trench displacement indicates that the trench is advancing towards the subducting plate (rollback). The zero on the x-axis corresponds to the time of the arrival at the trench of thefirst piece of the continental lithosphere. Plate displacement for the model H-180 is identical along the three cross-sections.
force related to the continental slab segment is obtained by measuring the effective length of continental material driven into the mantle, which differs from the maximum depth of the continental leading edge (Fig. 5). FBu-ocis constant through the sections with a value of -0.66 N/
m (Fig. 6a). Continental buoyancy slightly decreases from the central section (0.43 N/m) to the edges (0.28 N/m), which gives a total force required to obtain the slab breakoff of 1.09 N/m in the center and 0.94 N/m at the edges (Fig. 6a).
3.1.2. Model H-250
The only difference between the model H-250 and the reference model H-180 is the OCT geometry, which instead of being straight (α=180°) is convex towards the trench (α=250°) (Fig. 2b andTable 3). It means that the initial angle between the trench and the OCT is 35° and that the continental subduction occursfirst at the subduction zone center.
In the central section, the arrival of the OCT at the trench occurs 30 s after the onset of the experiment and it is followed, after a few seconds, by the continental lithosphere (Fig. 3). The OCT is then pro-gressively subducted towards the edges of the subduction zone, and it arrives at the trench along the section located 6 cm away from the center of the subduction zone 7.5 min later (Figs. 3 and 4).
During the early stage of subduction, the oceanic lithosphere is consumed, and slab pull leads to an average slab roll back velocity of 0.37 cm/min (Fig. 5a). Because of the initial OCT geometry, the arrival of the continental lithosphere at the trench occursfirst at the center of the subduction zone, while oceanic lithosphere is still being subducted laterally (Fig. 4). The OCT is stretched owing to the combined effects of
buoyancy forces. Once stretching is large enough, the continental seg-ment detaches from the oceanic segseg-ment (Fig.4).
Slab breakoff first takes place along the central Section 31 min
(∼13 Ma in nature) after the onset of the continental lithosphere subduction (Fig. 3). It then propagates towards the sides of the sub-duction zone and occurs after 54 min (∼22 Ma in nature) at 8 cm from the center (Fig. 5a).
The slab breakoff depth is different than in the reference model (Fig. 5b). Slab breakoff occurs at a depth of 4.6 cm (345 km in nature) at the central section and shallows to a minimum depth of 2.4 cm (180 km in nature) at x = 5 cm. The rate of lateral propagation of the slab breakoff is almost constant (∼ 0.37 cm/min,Fig. 5a).
Buoyancy forces at the time of slab breakoff also differ from the reference model (Fig. 6a). The buoyancy force of the oceanic slab segment changes from -0.32 N/m to -0.70 N/m, from the center to the edge of the subduction zone, respectively (Fig. 6b). The buoyancy force of the continental segment instead decreases from∼0.9 N/m at the centre to ∼0.2 N/m at x = 5 cm (Fig. 6b), and then increases up to 0.4 N/m at the edge of the subduction zone. As a result, the total buoyancy force at slab breakoff are varying laterally in comparison to the reference model. From the center (x = 0) to x = 5 cm, FBu-tot
de-creases from 1.20 N/m to 0.78 N/m and inde-creases to 1.1 N/m at x = 7 cm.
3.1.3. Model H-110
In the model H-110 which is defined by α = 110° (Fig. 2b and
Table 3), the OCT is concave towards the trench, with an initial tren-chOCT angle of 35°. This implies that continental subductionfirst starts at the edges of the subduction zone (Fig. 4).
The OCT arrival at the trench occurs 3 min after the onset of the experiment (Fig. 3) and is followed by the subduction of the continental lithosphere at 4.5 min. Like in the model H-250, the OCT is then pro-gressively subducted, and the trench arrives at the center after 26 min. Slab breakoff occurs first at the slab edges (x = ∼ 7 cm) 54 min
Fig. 4. Frontal views of the reference model (H-180) and of the two end-member models (H-250 and H-110) at different stages of their evolution. The time indicated in each picture corresponds to the time after the arrival at the trench of the OCT. Thefirst row shows the arrival at the trench of the OCT and of the continental lithosphere. The second-row corresponds to the phase of the OCT stretching for the model H-180 and to the progressive arrival at the trench of the OCT in the other models. The third row shows the lateral propagation of the slab breakoff.
after the OCT arrival at the trench (Fig. 5a), and then propagates to-ward the center of the subduction zone, where it ultimately develops at 76 min (∼ 31 Ma in nature).
The concavity from the oceanic to the continental lithosphere de-termines the shape evolution of the subducting plate. The slab becomes narrower through time (Fig. 4). The slab breakoff depth is also highly
variable (Fig. 5b), from 4.4 cm (330 km in nature) at the subduction zone edge to a minimum of 2.1 cm (̴160 km in nature) at x = 3 cm. Slab breakoff laterally propagates at an almost constant velocity of ∼0.25 cm/min (∼5.5 cm/yr in nature) (Fig. 5a).
Buoyancy forces change laterally (Fig. 6c). At the time of slab breakoff, the negative buoyancy force of the oceanic slab segment in-creases from the edge to the center of the subduction zone from ∼-0.5 N/m to ∼-0.9 N/m, respectively. The buoyancy force of the continental segment increases from ∼0.1 N/m at x = 0 cm to ∼0.37 N/m at x = 6 cm. The total buoyancy force also varies along the trench with the highest value of ∼0.96 N/m at the center of the
subduction zone and the lowest (0.90 N/m) at x = 3 cm.
3.1.4. Models H-150 and H-210
Models H-150 and H-210 are intermediate models between the re-ference model and the two end-members described above (Fig. 2and
Table 3). They correspond to an initial angle of 15° between the OCT and the trench. They exhibit a range of slab breakoff depths that sig-nificantly differs from the reference model. For the model H-150, the slab breakoff occurs in between 2.4 cm at the subduction zone center and 3.3 cm at the subduction zone edge, while in the model H-210, it is between 2.7 cm at the subduction zone edge and 4.25 cm at the sub-duction zone center (Fig. 5b). Considering the time necessary for the slab breakoff to propagate along the entire subduction zone, these in-termediate models are closer to the two end-members. It takes 19 min (in between 23 and 42 min) for the model H-150 and 7 min (in between 42 and 49 min) for the model H-210. Buoyancy forces acting on the OCT are between∼1 N/m and ∼0.75 N/m for the model H-210 and
Fig. 5. a) Along-trench time for the slab to breakoff after the arrival of the continental lithosphere at the trench for the different models. Position x = 0 cm corresponds to the center of the subduction zone (Fig. 2A). b) Depths of the slab breakoff along the subduction zone are indicated by solid lines. Observed lengths of the subducted continental lithosphere (dotted lines) are plotted against the predicted lengths of the subducted continental lithosphere (dashed lines), as obtained considering the buoyancy force required for the slab to breakoff in the central section of the reference model (1.1 N/m). Shaded colors indicate the measurements uncertainty.
∼0.92 N/m and ∼ 0.76 N/m for the model H-150 (see Supplementary Material).
3.2. Surface topography
We tracked the vertical motions at the surface of the subducting plate resulting from the internal dynamics of our subduction system. In
Fig. 6. Buoyancy forces acting on the slab at the time of the slab breakoff for models a) H-180, b) H-250 and c) H-110. x-axis represents the distance along the trench from the subduction zone center (seeFigs. 2a,). Triangles and circles correspond to the buoyancy force related to the oceanic (FBu-oc) and continental
(FBu-co) slab segments, respectively. Squares correspond to the sum of both
forces (FBu-tot).
Fig. 7. Topography of the model TH-250. a) During the stretching of the OCT at the subduction zone center. b) During the lateral propagation of the slab breakoff. c) Once the breakoff is achieved along the entire length of the sub-duction zone. d) Profile of elevation measured along the dotted sections located 65 km away from the trench for stages A (blue), B (red) and C (black).
Fig. 7, we show the topographic evolution of the model TH-250, whose initial configuration is similar to the model H–250.Fig. 7a shows the topography associated to the initiation of the slab breakoff at the sub-duction zone center (equivalent to 19 min in the model H-250). A zone of higher elevation (1.6 mm above the mean elevation of the plate) develops above the detaching slab in the center of the subduction zone while the subduction that is still active on both sides is associated with lower elevations. As the slab breakoff laterally propagates (Fig. 7b), the area at the surface affected by higher elevations also laterally propa-gates. A bulge with a trench-perpendicular extension of 10 mm shows a maximum elevation of 2.7 mm above the mean plate elevation. Be-tween the two stages, the subduction zone center has uplifted by 1.1 mm. As the subduction is still active on the edges of the subduction zone, a deep trench is still present. Finally, the slab breakoff is fully achieved along the trench and the entire plate shows high elevations close to the trench (Fig. 7c). The zones of maximum elevation (∼3.5 mm) correspond to the areas where the plate boundary is the most arcuate. The subduction zone center is downlifted by∼0.2 mm during this stage.
4. Discussion
4.1. Slab breakoff dynamics
Our reference model (H-180) shows first-order similitudes with previous 2D and 3D models of oceanic lithosphere subduction followed by continental lithosphere subduction (e.g., van Hunen and Allen, 2011;Pusok and Kaus, 2015;Menant et al., 2016;Magni et al., 2017). In particular, the depth and the timing of the breakoff following con-tinental subduction in the model H-180 is within the range of pre-viously obtained values in analogue and numerical models (Fig. 1) and those estimated for subduction zones on Earth (e.g.,Mahéo et al., 2002;
Chen et al., 2015), which indicates that the setup and the scaling adopted here are appropriate atfirst order to simulate the slab breakoff in subduction systems. Changing the rheological properties and/or di-mensions of the OCT might impact the timing and the depth of the slab breakoff, but the precise quantification of their effect would require further studies.
We also observe that the slab breakoff initiates at the subduction zone center, in agreement with previous 3D models with a straight OCT (van Hunen and Allen, 2011; Duretz et al., 2014). In our reference model, the total buoyancy force necessary to develop the slab breakoff is∼1.1 N/m (equivalent to ∼6.2 × 10¹³N/m in nature). The breakoff
is delayed at the slab edges because the vertical stretching at this lo-cation results in the shortening of the slab in two horizontal directions (x and y). Therefore, the necking only develops when the tensile stresses responsible for the vertical stretching are high enough. It could be achieved either by subducting more continental lithosphere or by decreasing the surface over which the slab pull is applied.Fig. 6shows that the buoyancy force of the continental slab instead decreases to-ward the edge. Slab breakoff at the edges occurs after the breakoff at the center, which allows tensile stresses to increase at the edges by decreasing the surface over which the total buoyancy force is applied. Such increase in tensile stresses also results in an increased stretching of the continental lithosphere, which explains why the slab breakoff oc-curs at higher depths at the edges (∼280 km instead of ∼250 km) despite a lesser amount of subducted continental lithosphere. In addi-tion, the lateral propagation rate of the slab breakoff, which is on average equivalent to about∼75 cm/yr in model H-180, is in the same range to that found for young and weak subducting oceanic litho-spheres (van Hunen and Allen, 2011). The slab break-off occurs at depths shallower than ∼265 km in our model, while it develops at ∼280-400-km depths invan Hunen and Allen (2011). The difference in
the breakoff depth may come from both the density contrast between the continental lithosphere and the surrounding mantle and from the approximation chosen to describe the lithosphere rheology.
Our other models show, for thefirst time, the influence of the pa-leogeography of the subducted passive margin (i.e. OCT) on the slab breakoff dynamics. Changing the angle between the trench and the ocean and continent transition zone impacts the kinematics and the dynamics of the slab breakoff. In particular, the range of slab breakoff depths varies, from∼2.1 cm (∼160 km in nature) in model H-110 to ∼4.6 cm (∼345 km in nature) in model H-250 (Fig. 1). Model H-180 shows that the breakoff occurs in the center of the subduction zone when the continental segment reaches a depth of 3.3 cm (250 km in nature). In this model, the buoyancy force of the oceanic slab is con-stant along the subduction zone. In the other models, to keep the ne-gative buoyancy force of the entire oceanic slab constant, we accord-ingly changed the length of the oceanic segment along the trench (from 4 to 11 cm in the models H-110 and H-250, and from 6 to 9 cm in the models H-150 and H-210). Given the density difference between the oceanic and continental segments, the length of the subducted con-tinental lithosphere should be lower where the oceanic segment is longer as less continental material is needed to get sufficient total buoyancy forces to trigger breakoff. This is what is indeed observed (Fig. 5), but the variation in the length of the subducted continental lithosphere is not linear as could be expected from the initial imposed linear change in the geometry. The observed length of the subducted continental lithosphere departs from the theoretical value, computed by considering the total buoyancy force (1.1 N/m) reached at the centre of the reference model (H-180). In the model H-250 for instance, the length of the subducted continental lithosphere is lower than antici-pated for x > 2 cm. Predicted lengths of subducted continental litho-sphere only consider the local buoyancy forces. However, once breakoff starts at the subduction zone center and propagates laterally, the OCT length decreases. In turn, the tensile stress that applies to the remaining slab segment increases. As a consequence, less continental material is needed to reach the required level of stress to initiate the break off. The minimum length of the subducted continental lithosphere is 6 mm, a value reached at x = 5 cm.
Another consequence of this lateral variation is that the stretching of the continental lithosphere (difference between the slab breakoff depth and the length of subducted continental lithosphere) increases from the center of the subduction zone towards the edges with a maximum at x = 5 cm. Finally, when the breakoff approaches the slab edge, shortening parallel to the trench direction also develops, which may require, in this case, increasing the local buoyancy forces by sub-ducting additional continental material (Fig. 5). The slab breakoff depth also varies, but follows the trend of the length of the subducted con-tinental lithosphere. The difference between both curves shows that the stretching of the continental lithosphere increases towards the sub-duction zone edge following the propagation of the breakoff, similar to what is found in the reference model. Buoyancy forces therefore not only result in the deformation of the OCT, but also in the laterally variable deformation of the subducted continental material. The same applies to the model H-110, except that the slab breakoff occurs first at the subduction edge. In this model the stretching of the continental lithosphere is maximum at x = 5 cm (Fig. 5). In the models where the obliquity of the OCT is less pronounced, the length of the subducted continental material is lower than expected: 0.1-0.5 cm (7.5–37.5 km in nature) in the model H-150 and∼0.12-2 cm (9–150 km in nature) in the model H-210.
The timing of the slab breakoff and the propagation rate also vary among the models (Fig. 5). With a straight OCT, the slab breakoff oc-curs almost instantaneously in thefirst 5.5 cm along the trench and is fully achieved for the remaining 2.5 cm after 2 min. It gives an average propagation rate of∼4 cm/min (∼74 cm/yr). Whereas, changing the obliquity of the OCT increases the time necessary for a complete breakoff of the slab. It requires 21 min (∼8.6 Ma in nature) and 26 min (∼10.6 Ma in nature) after the continental subduction started for models H-250 and H-110, respectively. The corresponding average lateral propagation rate is one order of magnitude lower than that of
the reference model, which evidences the importance of the location of the slab breakoff initiation on its kinematics. Trench parallel shortening of the OCT, close to the slab edges, delays the breakoff time and therefore the models in which the breakoff starts at the slab edges may require a longer time to initiate. For the slab width tested here (equivalent to 1500 km in nature), we observe time delays of up to 26 min (∼10.6 Ma in nature) between the initiation of the breakoff on one side of the subduction zone and the full breakoff along the entire subduction zone. Such lateral variations in the timing of the breakoff may leave an imprint in the geological record (time variations of the uplift pattern, the anomalous volcanism), and could be used to get in-sights into the subducted passive margin geometry.
4.2. Topographic evolution
The topography of the subducting plate is also affected by the slab breakoff dynamics. We modeled the topographic evolution of the model TH-250, which has an initial configuration similar to the model H-250. The absolute scaled values obtained here are too high owing to the simplification of the chosen lithospheric rheology as well as the absence of surface processes. However, the temporal and spatial variations of the topographic pattern can give us insights into the processes occur-ring at depths (Fig. 7). Initially, the OCT arrives at the trench in the central section, while the oceanic material is still subducted elsewhere, and starts stretching under the tensile stresses (Fig. 7a). During this time, at a distance equivalent to 65 km from the trench, the plate to-pography is ∼1.5 mm higher than the mean elevation of the plate (Fig. 7d). We interpret the anomalous high elevation at the subduction zone center as a consequence of the isostatic adjustment that results from the loss of mechanical continuity between the oceanic and the continental slab segments. The slab breakoff then laterally propagates, increasing the tensile stresses on the edges (Fig. 7b). At the surface, it correlates with anomalously high topography (up to 2.8 mm) and cor-responds to an uplift of 1–1.3 mm with respect to the previous stage (Fig. 7c). This uplift could result from the combination of i) an isostatic uplift in areas that lost the mechanical continuity and ii) a dynamic uplift resulting from both a mantle upwelling through the now-opened slab window in the center of the subduction zone (Guillaume et al., 2010) and a continental slab eduction. In Fig. 7c, the continental li-thosphere is fully detached from the oceanic lili-thosphere along a width of∼10 cm in the trench-parallel direction.Fig. 7c also shows that areas that were affected by the slab breakoff on the subduction zone sides exhibit a net uplift of 1–2 mm. Interestingly, two zones of high topo-graphy are visible at x= -4 cm and x = 4 cm with values of∼3.5 mm and∼2.7 mm, respectively. The mechanisms responsible for these to-pographic highs could be similar to the ones at play in the central section of the subduction zone during the previous stage. The analysis of the model H-250 shows that the amount of the subducted continental lithosphere decreases toward the edges of the subduction zone and
therefore, the isostatic contribution after the slab breakoff in this region is less important than in the center of the subduction zone. The sub-sidence observed in the central section in thefinal stage could be a result of the cessation of the mantle upwelling along with the isostatic readjustment related to the eduction of the continental segment in this domain. A precise quantification of the respective contributions of the two processes would require a precise analysis of the mantleflow and slab geometry in three dimensions, which is not achievable in our models.
4.3. Importance of passive margins orientation to understand and predict slab breakoff in nature
Our models are simplified representations of the subduction sytem. In particular, we do not simulate the upper/lower mantle boundary with a viscosity jump, which prevents any slabflattening and support from the lower mantle. As a consequence, if subduction of the con-tinental lithosphere occurs late in the subduction history, the lateral variation in the negative slab pull that we introduce in our models with a non-straight OCT may be less important. This may temper the ob-served variations in slab breakoff depth. However, the stress that ap-plies on the still attached OCT may still increase once the breakoff has started, which should produce lateral variations in the slab breakoff timing and depth. Another limitation of our setup is the lack of an overriding plate. It may impact the kinematics of the system by de-creasing the subduction and trench velocities (e.g., Yamato et al., 2009), which may increase the timing of slab breakoff initiation and
possibly reduce the lateral propagation rate. As a consequence, the propagation rates proposed here may be seen as an upper bound. The slab breakoff depth, instead, only depends on the properties of the subducting plate and should not vary when an upper plate is added to the system.
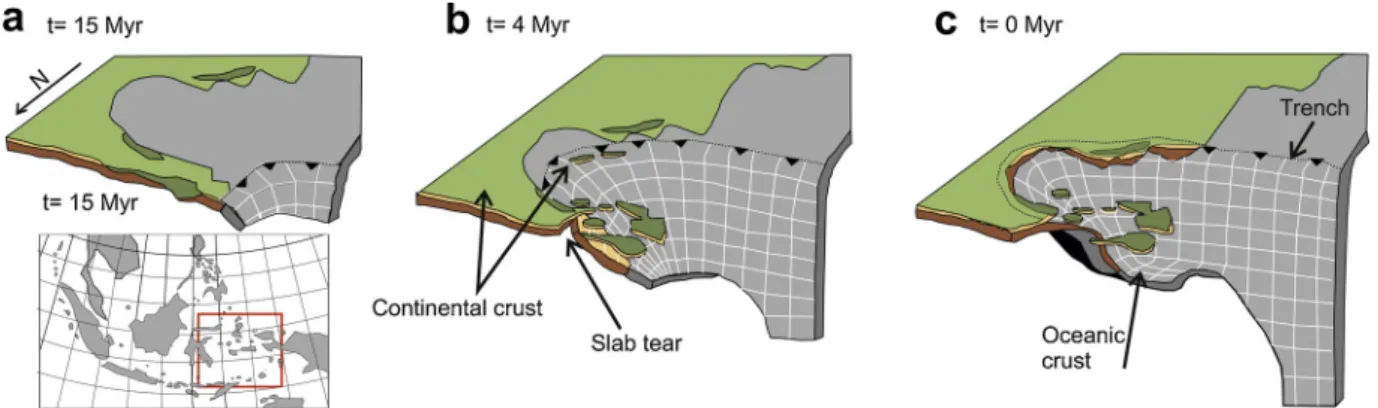
Despite all these limitations, our models showfirst order-differences in the dynamics of the slab breakoff that depend on the geometry of the transition between oceanic and continental lithospheres. Such non-straight cases may occur in nature, as derived from reconstructions for the Western Mediterranean (e.g., Vergés and Fernàndez, 2012), the Aegean (e.g.,Jolivet et al., 2013) and other regions, like the Banda Arc. The Banda Arc shape has been proposed to be the consequence of the compression between the Australian plate and the SE Asia (Carter et al., 1976;Bowin et al., 1980), or the result of the interaction between two subducted slabs (Cardwell and Isacks, 1978;Mc Caffrey, 1989). Recent studies (Spakman and Hall, 2010;Pownall et al., 2013) propose new interpretations inferred from seismic tomography images and field-work. In the model proposed bySpakman and Hall (2010), the slab-rollback is one of the primary mechanisms to explain the curvature of the slab in this region. It started 15 Myr ago (Fig. 8a) and progressively consumed oceanic material towards the embayment of the South Banda Sea. Along the northern margin, slab-rollback led to the delamination of
Fig. 8. Model of the evolution of the Banda Arc region over the last 15 Ma (modified fromSpakman and Hall, 2010). a) Slab rollback onset. b) Tearing along the continental margin. c) Slab-flattening in the upper mantle and tearing propagation along the subducted continental margin.
the continental crust from the lithosphere in between 15 and 7 Ma (Fig. 8b). In their model, this part of the subducted slab incorporated delaminated continental lithosphere, leading to tearing and rotation of the slab and ultimately bringing it to its present-day position. Despite a difference in the width of the subduction zone, our model H-110 (Fig. 4) shares some geometrical similarities with the reconstruction proposed bySpakman and Hall (2010), with an obliquity between the oceanic to continental lithosphere transition and the trench. Con-tinental material, at the edge of the subduction zone (equivalent to the northern margin of the Banda Arc region,Fig. 8a) arrived at the trench due to the slab-rollback. As a consequence, our model suggests that the arrival of continental material may also help initiating slab breakoff at this specific location. It also predicts that the slab breakoff should propagate towards the south, at shallower depths, as less continental material would need to be subducted. As shown in our models, the timing of propagation depends on the geometry and the length of the OCT. It may therefore require few million years before a complete breakoff of the slab beneath the Banda Arc is achieved.
5. Conclusions
We performed the first series of laboratory experiments in-vestigating the dynamics of three-dimensional slab breakoff and its consequences at the surface for the topography and the subducting plate kinematics.
- The initial configuration of the subducting plate, and the orientation of the oceanic to continental lithosphere transition (OCT) in parti-cular, controls the depth and the timing of slab breakoff. We showed that the slab breakoff occurs in a limited depth range when the OCT is parallel to the trench (250–280 km) whereas in models with a non-straight OCT, the slab breakoff depth significantly varies along the subduction zone by as much as∼170 km.
- The timing of the slab breakoff is also dependent on the initial geometry. In the model with an OCT parallel to the trench, the complete breakoff along the entire subduction zone is almost in-stantaneous at geological time scales (∼2 Ma to propagate for 1200 km), whereas it is delayed for the non-straight OCT models, as oceanic subduction is temporarily maintained laterally. It can take up to∼9 Ma and ∼12 Ma to obtain the breakoff at a same distance along the subduction, for models with an OCT convex towards the trench and concave towards the trench, respectively.
- The topographic evolution at the surface of the subducting plate reflects the evolution of the slab deformation at depths, and could be used to reconstruct the past history of the slab deformation in sub-duction systems. The esub-duction of continental lithosphere, isostatic adjustment, and mantle upwelling all contribute at different levels to shape the plate’s surface.
Declaration of Competing Interest
The authors declare that they have no known competingfinancial interests or personal relationships that could have appeared to influ-ence the work reported in this paper.
Acknowledgments
This work has been supported by the European Research Council and the Horizon2020 Marie Curie ETN #674899 SUBITOP. The authors would like to thank J.J. Kermarrec for his invaluable technical assis-tance in the laboratory and Francesca Funiciello and Fabio Corbi of the Laboratory of Experimental Tectonics (Universitá Roma Tre) for per-forming the rheological tests of the materials employed in this work through the EPOS Transnational Access. We also thank Joseph Martinod and an anonymous reviewer for their constructive comments, and Ajay Kumar for his careful text editing.
Appendix A. Supplementary data
Supplementary material related to this article can be found, in the online version, at doi:https://doi.org/10.1016/j.tecto.2019.228223.
References
Baumann, C., Gerya, T.V., Connolly, J.A., 2010. Numerical Modelling of Spontaneous Slab Breakoff Dynamics During Continental Collision 332. Geological Society, London, Special Publications, pp. 99–114.https://doi.org/10.1144/SP332.7.1. Bellahsen, N., Faccenna, C., Funiciello, F., 2005. Dynamics of subduction and plate
mo-tion in laboratory experiments: insights into the“plate tectonics” behavior of the Earth. J. Geophys. Res. Solid Earth 110 (B1).https://doi.org/10.1029/ 2004JB002999.
Boutelier, D., Cruden, A.R., 2017. Slab breakoff: insights from 3D thermo-mechanical analogue modelling experiments. Tectonophysics 694, 197–213.https://doi.org/10. 1016/j.tecto.2016.10.020.
Bowin, C., Purdy, G.M., Johnston, C., Shor, G., Lawver, L., Hartono, H.M.S., Jezek, P., 1980. Arc-continent collision in Banda Sea region. AAPG Bull. 64 (6), 868–915.
https://doi.org/10.1306/2f9193cd-16ce-11d7-8645000102c1865d.
Broerse, T., Norder, B., Govers, R., Sokoutis, D., Willingshofer, E., Picken, S.J., 2019. New analogue materials for nonlinear lithosphere rheology, with an application to slab break-off. Tectonophysics 756, 73–96.https://doi.org/10.1016/j.tecto.2018.12.007. Brun, J.P., Faccenna, C., 2008. Exhumation of high-pressure rocks driven by slab rollback. Earth Planet. Sci. Lett. 272 (1-2), 1–7.https://doi.org/10.1016/j.epsl.2008.02.038. Cardwell, R.K., Isacks, B.L., 1978. Geometry of the subducted lithosphere beneath the
Banda Sea in eastern Indonesia from seismicity and fault plane solutions. J. Geophys. Res. Solid Earth 83 (B6), 2825–2838.https://doi.org/10.1029/JB083iB06p02825. Carter, D.J., Audley-Charles, M.G., Barber, A.J., 1976. Stratigraphical analysis of island
arc—continental margin collision in eastern Indonesia. J. Geol. Soc. 132 (2), 179–198.https://doi.org/10.1144/gsjgs.132.2.0179.
Chen, L., Qin, K.Z., Li, G.M., Li, J.X., Xiao, B., Zhao, J.X., Fan, X., 2015. Zircon U–Pb ages, geochemistry, and Sr–Nd–Pb–Hf isotopes of the Nuri intrusive rocks in the Gangdese area, southern Tibet: constraints on timing, petrogenesis, and tectonic transforma-tion. Lithos 212, 379–396.https://doi.org/10.1016/j.lithos.2014.11.014. Davies, J.H., von Blanckenburg, F., 1995. Slab breakoff: a model of lithosphere
detach-ment and its test in the magmatism and deformation of collisional orogens. Earth Planet. Sci. Lett. 129 (1-4), 85–102.https://doi.org/10.1016/0012-821X(94) 00237-S.
Davy, P., Cobbold, P.R., 1991. Experiments on shortening of a 4-layer model of the continental lithosphere. Tectonophysics 188 (1-2), 1–25.https://doi.org/10.1016/ 0040-1951(91)90311-F.
Di Caprio, L., Gurnis, M., Müller, R.D., Tan, E., 2011. Mantle dynamics of continentwide Cenozoic subsidence and tilting of Australia. Lithosphere 3 (5), 311–316.https://doi. org/10.1130/L140.1.
Di Giuseppe, E., Van Hunen, J., Funiciello, F., Faccenna, C., Giardini, D., 2008. Slab stiffness control of trench motion: insights from numerical models. Geochem. Geophys. Geosystems 9 (2).https://doi.org/10.1029/2007GC001776.
Duretz, T., Gerya, T.V., Spakman, W., 2014. Slab detachment in laterally varying sub-duction zones: 3‐D numerical modeling. Geophys. Res. Lett. 41 (6), 1951–1956.
https://doi.org/10.1002/2014GL059472.
Forsyth, D., Uyeda, S., 1975. On the relative importance of the driving forces of plate motion. Geophys. J. Int. 43 (1), 163–200.https://doi.org/10.1111/j.1365-246X. 1975.tb00631.x.
Freeburn, R., Bouilhol, P., Maunder, B., Magni, V., Van Hunen, J., 2017. Numerical models of the magmatic processes induced by slab breakoff. Earth Planet. Sci. Lett. 478, 203–213.https://doi.org/10.1016/j.epsl.2017.09.008.
Funiciello, F., Faccenna, C., Giardini, D., Regenauer‐Lieb, K., 2003. Dynamics of re-treating slabs: 2. Insights from three‐dimensional laboratory experiments. J. Geophys. Res. Solid Earth 108 (B4).https://doi.org/10.1029/2001JB000896.
Funiciello, F., Faccenna, C., Heuret, A., Lallemand, S., Di Giuseppe, E., Becker, T.W., 2008. Trench migration, net rotation and slab–mantle coupling. Earth Planet. Sci. Lett. 271 (1-4), 233–240.https://doi.org/10.1016/j.epsl.2008.04.006.
Gerya, T.V., Yuen, D.A., Maresch, W.V., 2004. Thermomechanical modelling of slab de-tachment. Earth Planet. Sci. Lett. 226 (1-2), 101–116.https://doi.org/10.1016/j.epsl. 2004.07.022.
Goes, S., Agrusta, R., Van Hunen, J., Garel, F., 2017. Subduction-transition zone inter-action: a review. Geosphere 13 (3), 644–664.https://doi.org/10.1130/GES01476.1. Guillaume, B., Moroni, M., Funiciello, F., Martinod, J., Faccenna, C., 2010. Mantleflow
and dynamic topography associated with slab window opening: insights from la-boratory models. Tectonophysics 496 (1-4), 83–98.https://doi.org/10.1016/j.tecto. 2010.10.014.
Hertgen, S., 2018. Comportement mécanique des roches et dynamique des lithosphères dans les zones de convergence. PhD thesis 1 Université de Rennes 284 p.
Hippolyte, J.C., Angelier, J., Roure, F.B., 1994. A major geodynamic change revealed by Quaternary stress patterns in the Southern Apennines (Italy). Tectonophysics 230 (3-4), 199–210.https://doi.org/10.1016/0040-1951(94)90135-X.
Husson, L., Guillaume, B., Funiciello, F., Faccenna, C., Royden, L.H., 2012. Unraveling topography around subduction zones from laboratory models. Tectonophysics 526, 5–15.https://doi.org/10.1016/j.tecto.2011.09.001.
Jolivet, L., Faccenna, C., Huet, B., Labrousse, L., Le Pourhiet, L., Lacombe, O., et al., 2013. Aegean tectonics: strain localisation, slab tearing and trench retreat. Tectonophysics 597, 1–33.https://doi.org/10.1016/j.tecto.2012.06.011.
slab break-off. Earth Planet. Sci. Lett. 474, 59–67.https://doi.org/10.1016/j.epsl. 2017.06.017.
Mahéo, G., Guillot, S., Blichert-Toft, J., Rolland, Y., Pêcher, A., 2002. A slab breakoff model for the Neogene thermal evolution of South Karakorum and South Tibet. Earth Planet. Sci. Lett. 195 (1-2), 45–58.https://doi.org/10.1016/S0012-821X(01) 00578-7.
Martinod, J., Funiciello, F., Faccenna, C., Labanieh, S., Regard, V., 2005. Dynamical ef-fects of subducting ridges: insights from 3-D laboratory models. Geophys. J. Int. 163 (3), 1137–1150.https://doi.org/10.1111/j.1365-246X.2005.02797.x.
Mc Caffrey, Robert, 1989. Seismological constraints and speculations on Banda Arc tec-tonics. Netherlands J. Sea Res. 24 (2-3), 141–152. https://doi.org/10.1016/0077-7579(89)90145-2.
Menant, A., Sternai, P., Jolivet, L., Guillou-Frottier, L., Gerya, T., 2016. 3D numerical modeling of mantleflow, crustal dynamics and magma genesis associated with slab roll-back and tearing: the eastern Mediterranean case. Earth Planet. Sci. Lett. 442, 93–107.https://doi.org/10.1016/j.epsl.2016.03.002.
Pownall, J.M., Hall, R., Watkinson, I.M., 2013. Extreme extension across Seram and Ambon, eastern Indonesia: evidence for Banda slab rollback. Solid Earth 4 (2), 277–314.https://doi.org/10.5194/se-4-277-2013.
Pusok, A.E., Kaus, B.J., 2015. Development of topography in 3‐D continental‐collision models. Geochem. Geophys. Geosystems 16 (5), 1378–1400.https://doi.org/10. 1002/2015GC005732.
Regard, V., Faccenna, C., Bellier, O., Martinod, J., 2008. Laboratory experiments of slab break‐off and slab dip reversal: insight into the Alpine Oligocene reorganization. Terra Nova 20 (4), 267–273.https://doi.org/10.1111/j.1365-3121.2008.00815.x.
models. Tectonophysics, 496(1-4), 83-98.
Ribe, N.M., 2010. Bending mechanics and mode selection in free subduction: a thin-sheet analysis. Geophys. J. Int. 180 (2), 559–576.https://doi.org/10.1111/j.1365-246X. 2009.04460.x.
Rosenbaum, G., Lister, G.S., Duboz, C., 2002. Relative motions of Africa, Iberia and Europe during Alpine orogeny. Tectonophysics 359 (1-2), 117–129.https://doi.org/ 10.1016/S0040-1951(02)00442-0.
Royden, L.H., 1993. The tectonic expression slab pull at continental convergent
boundaries. Tectonics 12 (2), 303–325.https://doi.org/10.1029/92TC02248. Schellart, W.P., 2005. Influence of the subducting plate velocity on the geometry of the
slab and migration of the subduction hinge. Earth Planet. Sci. Lett. 231 (3-4), 197–219.https://doi.org/10.1016/j.epsl.2004.12.019.
Schellart, W.P., 2017. A geodynamic model of subduction evolution and slab detachment to explain Australian plate acceleration and deceleration during the latest Cretaceous–early Cenozoic. Lithosphere 9 (6), 976–986.https://doi.org/10.1130/ L675.1.
Spakman, W., Hall, R., 2010. Surface deformation and slab–mantle interaction during Banda arc subduction rollback. Nat. Geosci. 3 (8), 562.https://doi.org/10.1038/ ngeo917.
Ton, S.W.A., Wortel, M.J.R., 1997. Slab detachment in continental collision zones: an analysis of controlling parameters. Geophys. Res. Lett. 24 (16), 2095–2098.https:// doi.org/10.1029/97GL01939.
van Hunen, J., Allen, M.B., 2011. Continental collision and slab break-off: a comparison of 3-D numerical models with observations. Earth Planet. Sci. Lett. 302 (1-2), 27–37.
https://doi.org/10.1016/j.epsl.2010.11.035.
Vergés, J., Fernàndez, M., 2012. Tethys–Atlantic interaction along the Iberia–Africa plate boundary: the Betic–Rif orogenic system. Tectonophysics 579, 144–172.https://doi. org/10.1016/j.tecto.2012.08.032.
Weijermars, R., Schmeling, H., 1986. Scaling of Newtonian and non-Newtonianfluid dynamics without inertia for quantitative modelling of rockflow due to gravity (including the concept of rheological similarity). Phys. Earth Planet. Inter. 43 (4), 316–330.https://doi.org/10.1016/0031-9201(86)90021-X.
Westaway, R., 1993. Quaternary uplift of southern Italy. J. Geophys. Res. Solid Earth 98 (B12), 21741–21772.https://doi.org/10.1029/93JB01566.
Wu, B., Conrad, C.P., Heuret, A., Lithgow-Bertelloni, C., Lallemand, S., 2008. Reconciling strong slab pull and weak plate bending: the plate motion constraint on the strength of mantle slabs. Earth Planet. Sci. Lett. 272 (1-2), 412–421.https://doi.org/10.1016/ j.epsl.2008.05.009.
Yamato, P., Husson, L., Braun, J., Loiselet, C., Thieulot, C., 2009. Influence of surrounding plates on 3D subduction dynamics. Geophys. Res. Lett. 36 (7).https://doi.org/10. 1029/2008GL036942.