HAL Id: hal-00303109
https://hal.archives-ouvertes.fr/hal-00303109
Submitted on 26 Sep 2007HAL is a multi-disciplinary open access
archive for the deposit and dissemination of sci-entific research documents, whether they are pub-lished or not. The documents may come from teaching and research institutions in France or abroad, or from public or private research centers.
L’archive ouverte pluridisciplinaire HAL, est destinée au dépôt et à la diffusion de documents scientifiques de niveau recherche, publiés ou non, émanant des établissements d’enseignement et de recherche français ou étrangers, des laboratoires publics ou privés.
Validation of ACE-FTS satellite data in the upper
troposphere/lower stratosphere (UTLS) using
non-coincident measurements
M. I. Hegglin, P. F. Bernath, C. D. Boone, W. H. Daffer, P. Hoor, G. L.
Manney, C. Schiller, K. Strong, K. A. Walker
To cite this version:
M. I. Hegglin, P. F. Bernath, C. D. Boone, W. H. Daffer, P. Hoor, et al.. Validation of ACE-FTS satellite data in the upper troposphere/lower stratosphere (UTLS) using non-coincident measurements. Atmospheric Chemistry and Physics Discussions, European Geosciences Union, 2007, 7 (5), pp.13861-13882. �hal-00303109�
ACPD
7, 13861–13882, 2007 ACE-FTS satellite validation in the UTLS M. I. Hegglin et al. Title Page Abstract Introduction Conclusions References Tables Figures ◭ ◮ ◭ ◮ Back CloseFull Screen / Esc
Printer-friendly Version Interactive Discussion
EGU Atmos. Chem. Phys. Discuss., 7, 13861–13882, 2007
www.atmos-chem-phys-discuss.net/7/13861/2007/ © Author(s) 2007. This work is licensed
under a Creative Commons License.
Atmospheric Chemistry and Physics Discussions
Validation of ACE-FTS satellite data in the
upper troposphere/lower stratosphere
(UTLS) using non-coincident
measurements
M. I. Hegglin1, P. F. Bernath2,3, C. D. Boone3, W. H. Daffer4, P. Hoor5, G. L. Manney6,7, C. Schiller8, K. Strong1, and K. A. Walker1,3
1
Department of Physics, University of Toronto, Toronto, Canada
2
Department of Chemistry, University of York, York, UK
3
Department of Chemistry, University of Waterloo, Waterloo, Canada
4
Columbus Technologies Inc., Pasadena, California, USA
5
Max Planck Institute for Chemistry, Air Chemistry, Mainz, Germany
6
Jet Propulsion Laboratory, California Institute of Technology, Pasadena, California, USA
7
New Mexico Institute of Mining and Technology, Socorro, New Mexico, USA
8
Institute for Chemistry and Dynamics of the Geosphere, Stratosphere, Research Centre J ¨ulich GmbH, J ¨ulich, Germany
Received: 27 August 2007 – Accepted: 19 September 2007 – Published: 26 September 2007 Correspondence to: M. I. Hegglin ([email protected])
ACPD
7, 13861–13882, 2007 ACE-FTS satellite validation in the UTLS M. I. Hegglin et al. Title Page Abstract Introduction Conclusions References Tables Figures ◭ ◮ ◭ ◮ Back CloseFull Screen / Esc
Printer-friendly Version Interactive Discussion
EGU
Abstract
CO, O3, and H2O data in the upper troposphere/lower stratosphere (UTLS) measured
by the Atmospheric Chemistry Experiment Fourier Transform Spectrometer (ACE-FTS) on Canada’s SCISAT-1 satellite are validated using aircraft measurements. In the UTLS, validation of chemical trace gas measurements is a challenging task due to
5
small-scale variability in the tracer fields, strong gradients of the tracers across the tropopause, and scarcity of measurements suitable for validation purposes. Two al-ternative methods for the validation of the satellite data are introduced, which avoid the usual need for coincident measurements: tracer-tracer correlations, and vertical profiles relative to the tropopause height. Both largely reduce geophysical variability
10
and thereby provide an “instantaneous climatology”, allowing measurement compari-son with non-coincident data which yields information about the precision, and a sta-tistically meaningful error-assessment of the ACE-FTS satellite data. We found that the ACE-FTS CO and lower stratospheric O3 agree with the aircraft measurements within ±10% and ±5%, respectively. The ACE-FTS O3 in the UT exhibits a high bias
15
of up to 40%. H2O indicates a low bias with relative differences of around 20% in the
LS and 40% in the UT, respectively. When taking into account the smearing effect of the vertically limited spacing between measurements of the ACE-FTS instrument, the errors decrease by 5–15% around the tropopause. The ACE-FTS instrument hence offers unprecedented precision and vertical resolution in the UTLS, that will allow a
20
new global perspective on UTLS tracer distributions.
1 Introduction
The upper troposphere/lower stratosphere (UTLS) has recently attracted major re-search interest in atmospheric science due to its key role in chemistry-climate coupling. In order to characterize UTLS tracer distributions and to detect future changes, tracer
25
ACPD
7, 13861–13882, 2007 ACE-FTS satellite validation in the UTLS M. I. Hegglin et al. Title Page Abstract Introduction Conclusions References Tables Figures ◭ ◮ ◭ ◮ Back CloseFull Screen / Esc
Printer-friendly Version Interactive Discussion
EGU which this task can be accomplished, however, their capability to measure accurately
in the UTLS is limited, and the validation of the measurements difficult.
The restrictions are imposed by the dynamical and chemical structure of the UTLS. Dynamical variability in the tropopause region induced by Rossby wave activity is high, and length scales of the associated features in the tracer fields are small – less than
5
1 km in the vertical, and 100 km in the horizontal. Tracer mixing ratios also exhibit a strong gradient across the tropopause because it acts as a transport barrier (Pan et al., 2004; Hoor et al., 2004; Hegglin et al., 2006). Ultimately, the remote sensing technique used determines the achievable vertical and horizontal resolution of the measurements and hence the capability of the instrument to resolve the given geophysical small-scale
10
variability. The Atmospheric Chemistry Experiment Fourier Transform Spectrometer (ACE-FTS) on Canada’s SCISAT-1 satellite (Bernath et al., 2005) has provided accu-rate measurements of numerous chemical species throughout the stratosphere and into the UT since February 2004, with a vertical spacing between measurements of less than 1 km at the lowest retrieval altitudes. The measurements suggest a high
15
potential for studies related to the upper troposphere/lower stratosphere (UTLS). In the stratosphere and the mesosphere, the ACE-FTS satellite measurements are being validated by comparison to balloon-borne or independent satellite data which are approximately coincident in time and space. Coincidence criteria are defined in various ways, but typically the measurements have to be taken within several hours
20
and at locations no further apart than around 500 km. As pointed out by Walker et al. (2005), however, it can be difficult to find a sufficient number of coincident mea-surements for a statistically meaningful validation. Furthermore, this validation method does not account for the variability in tracer distributions produced by the geophys-ical variability found within the defined time and length scales. As illustrated in the
25
following example, the use of coincident measurements is especially an issue in the UTLS, where geophysical variability is large and a strong gradient in chemical tracers is found across the tropopause. Figure 1 provides a cross section of ECMWF potential vorticity at 6◦W on 10 November 2001 at 6:00 UTC. The 2 PVU (1 PVU=1 potential
ACPD
7, 13861–13882, 2007 ACE-FTS satellite validation in the UTLS M. I. Hegglin et al. Title Page Abstract Introduction Conclusions References Tables Figures ◭ ◮ ◭ ◮ Back CloseFull Screen / Esc
Printer-friendly Version Interactive Discussion
EGU vorticity unit=10−6m2s−1K kg−1) tropopause surface shows strong undulations and
even profiles fulfilling the coincidence criteria exhibit large differences in tropopause height. Figure 2 shows two vertical profiles of CO mixing ratios measured in-situ by an aircraft instrument during the same dynamical situation and taken within 8 hrs and a distance of 400 km. As can be seen, the error derived for the measurements in the
5
tropopause region is as large as 50%, though this is due to the geophysical variability and not a measurement error (the profiles are taken by the same instrument). Further complicating a statistically meaningful comparison is the sharp tracer gradient at the tropopause, which causes sampling errors not to be normally distributed. In this study, we introduce two alternative methods for the validation of the ACE-FTS CO, O3, and
10
H2O measurements in the UTLS: tracer-tracer correlations, and vertical profiles
rela-tive to the tropopause height. These strongly reduce geophysical variability and help in assessing the quality and vertical information content of the satellite data. The paper is structured as follows. Section 2 provides the description of the ACE-FTS satellite and SPURT aircraft measurements. In Sect. 3, the new validation methods are introduced,
15
which are used in Sect. 4 to validate the ACE-FTS measurements. A summary is given in Sect. 5.
2 Data description
2.1 ACE-FTS satellite data
The Atmospheric Chemistry Experiment Fourier Transform Spectrometer (ACE-FTS)
20
is the primary instrument on SCISAT-1, a Canadian-led satellite mission for remote sensing of the Earth’s atmosphere. ACE-FTS features high resolution (0.02 cm−1) and broad spectral coverage in the infrared (750 to 4400 cm−1). The instrument operates
almost exclusively in solar occultation mode (Bernath et al., 2005). The SCISAT-1 satellite was launched into low Earth circular orbit (650 km) with high inclination (74◦)
25
ACPD
7, 13861–13882, 2007 ACE-FTS satellite validation in the UTLS M. I. Hegglin et al. Title Page Abstract Introduction Conclusions References Tables Figures ◭ ◮ ◭ ◮ Back CloseFull Screen / Esc
Printer-friendly Version Interactive Discussion
EGU coverage of the globe, with an emphasis on mid-latitudes and the polar regions. Up
to 30 occultation events (sunrises or sunsets viewed by the orbiting satellite) occur per calendar day. Science operations for the ACE-FTS began in February 2004. Retrievals for the ACE-FTS employ a nonlinear least squares global-fit approach (Boone et al., 2005). In this study we validate ACE-FTS version 2.2 H2O, CO, as well as the “version
5
2.2 O3 update” results in the UTLS between February 2004 and January 2007.
ACE-FTS results are provided on two altitude grids, a 1-km grid common to all occultations and a “retrieval grid” that varies from occultation to occultation. The retrieval grid con-tains values at the measurement altitudes, unless there are multiple measurements within a layer on the 1-km grid, in which case it provides a single value at the center of
10
the 1-km grid layer. For this study, we use the measurements on the retrieval grid. The altitude spacing between measurements varies over the course of the year, governed primarily by the beta angle (the angle between the satellite orbit plane and the Earth-Sun vector) corresponding to the occultation. The ACE-FTS instrument collects measurements every 2 s. The rate of change of altitude decreases with increasing
15
beta angle, leading to higher vertical sampling for larger beta angles. At low altitudes, refraction effects and clouds also impact the measurement spacing. Figure 3 shows the probability density function of the vertical spacing between altitudes on the retrieval grid as a function of height for all measurements between 5 and 50 km. The altitude spacing in the UTLS varies from about 3 km to less than 1 km. Note, however, that
20
the vertical resolution of the ACE-FTS is limited by its field-of-view. The instrument has a 1.25 mrad input aperture, which subtends an altitude range of 3–4 km at the tangent point (the point of closest approach to the Earth for a solar ray measured by the instrument). We focus on the validation of the UTLS measurements between ±5 km of the tropopause, i.e. between approximately 5 and 15 km altitude or 500 and 100 hPa.
25
The validation of the stratospheric and mesospheric ACE-FTS version 2.2 data (with ozone updates) is published along with this paper in a special issue of Atmos. Chem. Phys. on validation of ACE (for CO: Clerbaux et al., 20071, for O3: Dupuy et al.,
1
mis-ACPD
7, 13861–13882, 2007 ACE-FTS satellite validation in the UTLS M. I. Hegglin et al. Title Page Abstract Introduction Conclusions References Tables Figures ◭ ◮ ◭ ◮ Back CloseFull Screen / Esc
Printer-friendly Version Interactive Discussion
EGU 20072, for H2O: Carleer et al., 2007
3
). Earlier comparisons of the version 1.0 ACE-FTS O3data with GOMOS satellite data (Fussen et al., 2005) yielded good agreement
between the two data sets with differences mostly lower than 10% between 15 and 45 km. Comparisons with POAM III and SAGE III data yielded similar results (Walker et al., 2005), with HALOE an agreement of ±5% between 15 and 35 km (McHugh et al.,
5
2005). In the same study the ACE-FTS H2O data indicated a high bias of around 20% at altitudes below 20 km. A first validation of the version 1.0 CO by Jin et al. (2005) using ODIN satellite data yielded excellent agreement, and a comprehensive analyses of these data was provided by Clerbaux et al. (2005). Version 2.2 level data were furthermore compared to the AURA-MLS satellite data: the MLS O3 showed a low
10
bias in the lower stratosphere of 10% to 20%, and the H2O good agreement except at
lowest levels around 100 hPa with differences increasing up to 30% (Froidevaux et al., 2006).
2.2 SPURT aircraft data
As reference data set, we use in-situ high-resolution and high-precision CO, O3, and
15
H2O measurements from the SPURT (German acronym for “trace gas transport in the tropopause region”) aircraft campaign carried out seasonally between November 2001 and July 2003 in the Northern Hemisphere over Europe and covering a latitude range between 30◦N and 80◦N. For each season, approximately 32 flight hours or 24 000
data points were obtained. An overview of the campaign can be found in Engel et
20
al. (2006). Detailed descriptions of the CO, O3, and H2O measurements can be found
sion: validation using ground-based, airborne and satellites observations, Atmos. Chem. Phys. Discuss., submitted, 2007.
2
Dupuy E., Walker, K. A., Kar, J., et al.: Validation of ozone measurements from the Atmo-spheric Chemistry Experiment (ACE), Atmos. Chem. Phys. Discuss., in preparation, 2007.
3
Carleer, M., Boone, C. D., Walker, K. A., et al.: ACE-FTS Water vapor validation, Atmos. Chem. Phys. Discuss., in preparation, 2007.
ACPD
7, 13861–13882, 2007 ACE-FTS satellite validation in the UTLS M. I. Hegglin et al. Title Page Abstract Introduction Conclusions References Tables Figures ◭ ◮ ◭ ◮ Back CloseFull Screen / Esc
Printer-friendly Version Interactive Discussion
EGU in Hoor et al. (2004), Hegglin et al. (2006), and Krebsbach et al. (2006), respectively.
Note that these data were obtained during earlier years than the ACE-FTS data, hence interannual variability in UTLS tracer distributions might add an uncertainty to the error assessment. However, the primary aim of this study is to introduce and show the potential of the new validation methods.
5
2.3 Derived meteorological products
For each measurement point of the two data sets we derived the thermal tropopause height according to the WMO-definition, i.e. the lowest level at which the lapse rate drops to 2 K km−1or less, and the average lapse rate between this level and all higher
levels within 2 km does not exceed 2 K km−1 (WMO, 1957), using the Goddard Earth
10
Observing System Model, Version 4 (GEOS-4) by interpolation of the model fields onto the exact measurement location in time and space. The GEOS-4 analyses are described by Bloom et al. (2005). A Physical Space Statistical Analysis Scheme is used. The GEOS-4 data used here are provided on 55 hybrid (σ/pressure) model levels from the surface to 0.01 hPa. The horizontal grid is 1.0◦ latitude by 1.25◦ longitude.
15
Six-hourly average fields are provided centered at 00:00, 06:00, 12:00 and 18:00 UTC. Besides the standard meteorological variables, GEOS-4 products include an extensive set of fields from the model and assimilation system, including PV calculated internally in the model. Further information on the derived meteorological products can be found in Manney et al. (20074).
20
We need to mention that for the method presented here it is crucial to derive the ther-mal tropopauses for each data set with the same model. This is because different mod-els vary in their vertical resolution and capability of reproducing the atmosphere’s tem-perature structure and tropopause heights, which represent additional error sources.
4
Manney, G. L., Daffer, W. H., Zawodny, J. M., et al.: Solar occultation satellite data and de-rived meteorological products: sampling issues and comparisons with Aura MLS, J. Geophys. Res., available athttp://mls.jpl.nasa.gov, submitted, 2007.
ACPD
7, 13861–13882, 2007 ACE-FTS satellite validation in the UTLS M. I. Hegglin et al. Title Page Abstract Introduction Conclusions References Tables Figures ◭ ◮ ◭ ◮ Back CloseFull Screen / Esc
Printer-friendly Version Interactive Discussion
EGU
3 New validation methods
3.1 Tracer-tracer correlations
Sufficiently long-lived species exhibit compact correlations (Plumb and Ko, 1992), which reduce day-to-day variations and provide an “instant climatology”. Compact cor-relations are – depending on the respective lifetimes of the tracers used – not
neces-5
sarily linear, as is the case for the O3-CO and O3-H2O correlations; instead, they exhibit a strong curvature, which can be used to identify the chemical transition between the troposphere and the stratosphere (Pan et al., 2007 and references therein). Apart from recent troposphere-to-stratosphere transport events, which produce distinct and nearly linear mixing lines (Fischer et al., 2000), the compactness of these correlations is
rel-10
atively high and their shape distinct due to their strong dependency on the location of the tropopause, so that we can use them to gauge the precision of the ACE-FTS measurements.
3.2 Vertical profiles relative to the tropopause height
Another method for reducing the effects of geophysical variability in UTLS tracer
mea-15
surements, and for obtaining fields suitable for comparison of non-coincident measure-ments, is the use of tracer vertical profiles relative to the tropopause height (cf. Hoor et al., 2004; Pan et al., 2004; Hegglin et al., 2006). These profiles are more compact and show less scatter than data plotted in geometric altitude coordinates, furthermore they reveal a sharp gradient between tropospheric and stratospheric tracer mixing
ra-20
tios which can be used to test the vertical resolution and information content of the ACE-FTS data. Since this method further allows us inclusion of all measurements, not just the coincident ones, one can get much better statistics.
In order to apply this method to the ACE-FTS and SPURT data, we first calculate the distance from the thermal tropopause of each measurement point. We then calculate
25
ACPD
7, 13861–13882, 2007 ACE-FTS satellite validation in the UTLS M. I. Hegglin et al. Title Page Abstract Introduction Conclusions References Tables Figures ◭ ◮ ◭ ◮ Back CloseFull Screen / Esc
Printer-friendly Version Interactive Discussion
EGU 1 km altitude bin between −6 km and 6 km relative to the tropopause height. We also
derive the relative differences (rds) between the SPURT (meanspurt) and the ACE-FTS
mean tracer profiles (meanace) using
rd s = 100 − (meanspurt/meanace) × 100, (1)
and their uncertainties (u) calculated according to the general rules of error
propaga-5
tion:
u=(σspurt/meanspurt− σace/meanace) ∗ 100. (2)
4 Results and discussion
4.1 SPURT versus ACE-FTS tracer-tracer correlations
Figure 4 shows the CO-O3and H2O-O3correlations for the ACE-FTS and the SPURT
10
measurements for the latitude range between 30◦ and 90◦N and for different seasons.
The agreement between the correlations of the two data sets is remarkable, despite the fact that the measurements were carried out in different years. In general, the SPURT data lie well within the range of the ACE-FTS data, and the limited spread (or scatter) of the ACE-FTS indicates a very good precision of the instrument. Some features
15
such as the “high-heel” shape found in the spring H2O-O3correlation, or the relatively
broad transition between the troposphere and the stratosphere in the summer CO-O3 correlation, are evident in both data sets.
4.2 SPURT versus ACE-FTS vertical profiles
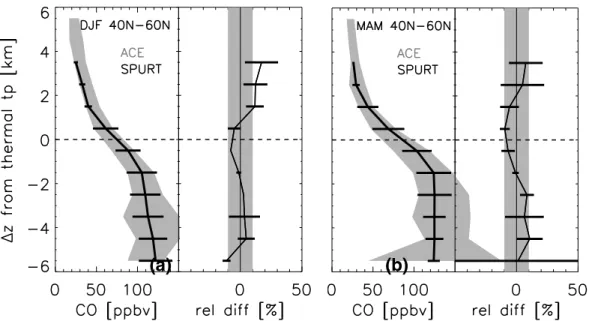
The validation of the ACE-FTS CO, O3, and H2O data using vertical profiles relative to
20
the tropopause height is presented in Figs. 5 to 7. In order to minimize the uncertainties caused by a potential latitudinal dependency of the mean tracer profiles, we now only use data between 40◦N and 60◦N. The comparison between satellite and aircraft data
ACPD
7, 13861–13882, 2007 ACE-FTS satellite validation in the UTLS M. I. Hegglin et al. Title Page Abstract Introduction Conclusions References Tables Figures ◭ ◮ ◭ ◮ Back CloseFull Screen / Esc
Printer-friendly Version Interactive Discussion
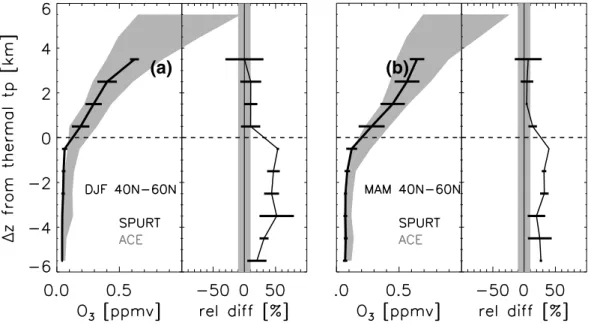
EGU yields the best result for CO. Relative differences are smaller than ±10%, and the
uncertainties of the relative differences further indicate that the two data sets are not significantly different. This result is comparable to the 16% relative difference derived from a validation using MOZAIC aircraft data in the UTLS by Clerbaux et al. (2007). The same can be said for O3in the LS with ±5% (cf. Dupuy et al., 2007), however, in the UT,
5
the relative differences increase to around 40%, and indicate a persistent high bias of the ACE-FTS O3. This might be due to a general sensitivity problem of satellites when it comes to detect and accurately measure low mixing ratios below atmospheric layers with very high mixing ratios. H2O shows the largest relative differences of about 20% in
the LS, and 40% in the UT, with the uncertainties of the relative differences suggesting
10
a stystematic low bias of the ACE-FTS measurements, at least for the middle to upper troposphere. However, H2O is the most variable tracer in the troposphere among the
species presented here, and indeed comparison of the ACE-FTS data with H2O data
from the ER-2 aircraft during the POLARIS campaign indicate rather a high bias in the UT (not shown). This inconsistency should be further investigated by comparing the
15
ACE-FTS to other datasets in addition to the ones of SPURT and ER-2. Recall that the vertical resolution of the ACE-FTS is limited by its field-of-view. Due to this effect, it is difficult to resolve structure at better resolution than 3 km. As shown in Fig. 3, there is often a significant altitude oversampling in the vicinity of the tropopause, which may reduce the impact of the field-of-view. However, at the level of 1 km, there is additionally
20
an inherent smoothing in the retrieval process, since forward model calculations employ data on a 1-km grid. To account (very roughly) for the limitations in the ACE-FTS vertical resolution, we smooth the SPURT profiles with a triangular function. For O3, for example, we would apply the following smoothing
O3[i]=0.25 × O3[i−1] + 0.5 × O3[i] + 0.25 × O3[i + 1] (3)
25
where i is the altitude level of a given mean O3 value. By smoothing the SPURT
ACPD
7, 13861–13882, 2007 ACE-FTS satellite validation in the UTLS M. I. Hegglin et al. Title Page Abstract Introduction Conclusions References Tables Figures ◭ ◮ ◭ ◮ Back CloseFull Screen / Esc
Printer-friendly Version Interactive Discussion
EGU ACE-FTS vertical resolution have a significant effect on the results.
Figure 8 shows the relative difference between the smoothed SPURT and the ACE-FTS mean O3profiles. The comparison with Fig. 6 indicates, that the smoothing effect
accounts only for about 5–15% of the total measurement error, with largest impact just above and below the tropopause.
5
5 Conclusions
In this study we present the validation of ACE-FTS CO, O3, and H2O measurements on Canada’s SCISAT-1 satellite in the upper troposphere/lower stratosphere (UTLS) using SPURT aircraft measurements. It contributes to the validation efforts of the ACE-FTS data published in this issue. Other studies (except the one focusing on CO), however,
10
mainly focus on validation in the stratosphere and the mesosphere. In the UTLS, val-idation of chemical trace gas measurements is a challenging task due to small-scale variability in the tracer fields, strong gradients of the tracers across the tropopause, and scarcity of measurements suitable for validation purposes. We here suggest two alternative/complementary methods for the validation of satellite measurements in the
15
UTLS: tracer-tracer correlations, and vertical profiles relative to the tropopause height. These methods are known to reduce geophysical variability, and thereby provide an “instantaneous climatology”, which avoids the need for coincident measurements. The climatological comparison allows to include all available measurements, not just the coincident ones, and by this yield better statistics, and more reliable information about
20
the instrument precision.
We found that the ACE-FTS CO and lower stratospheric O3 agree with the aircraft
measurements within ±10% and ±5%, respectively. The ACE-FTS O3 in the UT
ex-hibits a high bias of up to 40%. H2O indicates a low bias with relative differences of
around 20% in the LS and 40% in the UT, respectively. When taking into account the
25
smearing effect of the limited spacing between the measurements of the ACE-FTS in-strument, the errors decrease by 5–15% around the tropopause. This limitation in the
ACPD
7, 13861–13882, 2007 ACE-FTS satellite validation in the UTLS M. I. Hegglin et al. Title Page Abstract Introduction Conclusions References Tables Figures ◭ ◮ ◭ ◮ Back CloseFull Screen / Esc
Printer-friendly Version Interactive Discussion
EGU vertical resolution must be taken into account when interpreting the ACE-FTS UTLS
measurements. Note, that tropopause heights derived for the different data sets used in validation studies should be derived using the same model, since differences in model characteristics may present an additional error source. The significance of the results presented here should be tested with further aircraft and satellite data.
Never-5
theless, the analysis indicates that the ACE-FTS offers unprecedented precision and vertical resolution in the UTLS, allowing a new global perspective on UTLS trace gas distributions. Our study shows that aircraft observations provide valuable data sets for satellite validation. By applying the methods presented here, more value can be extracted from historical data sets. It furthermore allows the comparison of satellites
10
whose observation periods don’t overlap, an issue frequently pointed out in the litera-ture.
Acknowledgements. The Atmospheric Chemistry Experiment (ACE), also known as SCISAT, is a Canadian-led mission mainly supported by the Canadian Space Agency and the Natural Sciences and Engineering Research Council of Canada. Work at the Jet Propulsion Laboratory,
15
California Institute of Technology was done under contract with the National Aeronautics and Space Administration. M. Hegglin has been supported by the Canadian Foundation for Climate and Atmospheric Sciences and the Canadian Space Agency through the C-SPARC program. Special thanks to T. Shepherd for helpful comments on an earlier version of the manuscript.
References
20
Bernath,. F., McElroy, C. T., Abrams, M. C., et al.: Atmospheric Chemistry Experiment (ACE): Mission overview, Geophys. Res. Lett., 32, L15S01, doi:10.1029/2005GL022386, 2005. Bloom, S. C., da Silva, A. M., Dee, D. P., et al.: The Goddard Earth Observing Data Assimilation
System, GEOS DAS Version 4.0.3: Documentation and Validation, NASA, 104606 V26, 2005.
25
Clerbaux, C., Coheur, P.-F., Hurtmans, D., Barret, B., Carleer, M., Colin, R., Seme-niuk, K., McConnell, J. C., Boone, C., and Bernath, P.: Carbon monoxide distribution
ACPD
7, 13861–13882, 2007 ACE-FTS satellite validation in the UTLS M. I. Hegglin et al. Title Page Abstract Introduction Conclusions References Tables Figures ◭ ◮ ◭ ◮ Back CloseFull Screen / Esc
Printer-friendly Version Interactive Discussion
EGU
from the ACE-FTS solar occultation measurements, Geophys. Res. Lett., 32, L16S01, doi:10.1029/2005GL022394, 2005.
Engel, A., B ¨onisch, H., Brunner, D., et al.: Highly resolved observations of trace gases in the lowermost stratosphere and upper troposphere from the Spurt project: an overview, Atmos. Chem. Phys., 6, 283–301, 2006,http://www.atmos-chem-phys.net/6/283/2006/.
5
Fischer, H., Wienhold, F. G., Hoor, P., Bujok, O., Schiller, C., Siegmund, P., Ambaum, M., Scheeren, H. A., and Lelieveld, J.: Tracer correlations in the northern high latitude lowermost stratosphere: Influence of cross-tropopause mass exchange, Geophys. Res. Lett., 27(1), 97–100, 10.1029/1999GL010879, 2000.
Froidevaux, L., Livesey, N. J., Read, W. G., et al.: Early validation analyses of atmospheric
10
profiles from EOS MLS on the Aura satellite, IEEE Transaction on Geoscience and Remote Sensing, 44 (5), 2006.
Fussen, D., Vanhellemont, F., Dodion, J., Bingen, C., Walker, K. A., Boone, C. D., McLeod, S. D. and Bernath, P. F.: Initial intercomparison of ozone and nitrogen dioxide number density profiles retrieved by the ACE-FTS and GOMOS occultation experiments, Geophys. Res.
15
Lett., 32, L16S02, doi:10.1029/2005GL022468, 2005.
Hegglin, M. I., Brunner, D., Peter, T., et al.: Measurements of NO, NOy, N2O, and O3 dur-ing SPURT: implications for transport and chemistry in the lowermost stratosphere, Atmos. Chem. Phys., 6, 1 331–1 350, 2006.
Hoor, P., Gurk, C., Brunner, D., Hegglin, M. I., Wernli, H., and Fischer, H.: Seasonality and
20
extent of extratropcial TST derived from in-situ CO measurements during SPURT, Atmos. Chem. Phys., 4, 1427–1442, 2004,http://www.atmos-chem-phys.net/4/1427/2004/.
Jin, J. J., Semeniuk, K., Jonsson, A. I., et al.: Co-located ACE-FTS and Odin/SMR stratospheric-mesospheric CO 2004 measurements and comparison with a GCM, Geophys. Res. Lett., 32, L15S03, doi:10.1029/2005GL022433, 2005.
25
Krebsbach, M., Brunner, D., G ¨unther, G., Hegglin, M., Maser, R., Mottaghy, D., Riese, M., Spelten, N., Wernli, H., and Schiller, C.: Seasonal cycles and variability of O3and H2O in the UT/LMS during SPURT, Atmos. Chem. Phys., 6, 109–125, 2006,
http://www.atmos-chem-phys.net/6/109/2006/.
McHugh, M., Magill, B., Walker, K. A., Boone, C. D., Bernath, P. F., and Russell III, J. M.:
Com-30
parison of atmospheric retrievals from ACE and HALOE, Geophys. Res. Lett., 32, L15S10, doi:10.1029/2005GL022403, 2005.
ACPD
7, 13861–13882, 2007 ACE-FTS satellite validation in the UTLS M. I. Hegglin et al. Title Page Abstract Introduction Conclusions References Tables Figures ◭ ◮ ◭ ◮ Back CloseFull Screen / Esc
Printer-friendly Version Interactive Discussion
EGU
sharpness of the extratropical tropopause: A trace gas perspective, J. Geophys. Res., 109, D23103, doi:10.1029/2004JD004982, 2004.
Pan, L. L., Wei, J. C., Kinnison, D. E., Garcia, R. R., Wuebbles, D. J., and Brasseur, G. P. : A set of diagnostics for evaluating chemistry-climate models in the extratropical tropopause region, J. Geophys. Res., 112, D09316, doi:10.1029/2006JD007792, 2007.
5
WMO: Meteorology – A three-dimensional science, WMO Bulletin, 6, 134–138, 1957.
Walker, K. A., Randall, C. E., Trepte, C. R., Boone, C. D., and Bernath, P. F.: Initial validation comparisons for the Atmospheric Chemistry Experiment (ACE-FTS), Geophys. Res. Lett., 32, L16S04, doi:10.1029/2005GL022388, 2005.
ACPD
7, 13861–13882, 2007 ACE-FTS satellite validation in the UTLS M. I. Hegglin et al. Title Page Abstract Introduction Conclusions References Tables Figures ◭ ◮ ◭ ◮ Back CloseFull Screen / Esc
Printer-friendly Version Interactive Discussion
EGU Fig. 1. Vertical cross section of ECMWF potential vorticity (colour coded) from equator to
North Pole at 6◦W on 10 November 2001 at 06:00 UTC. White thick line shows the dynamical tropopause (2 PVU), white dashed line the 380 K isentrope. Green lines indicate the location of two independent profiles fulfilling the coincidence criteria.
ACPD
7, 13861–13882, 2007 ACE-FTS satellite validation in the UTLS M. I. Hegglin et al. Title Page Abstract Introduction Conclusions References Tables Figures ◭ ◮ ◭ ◮ Back CloseFull Screen / Esc
Printer-friendly Version Interactive Discussion
EGU Fig. 2. Left panel: Vertical profiles of CO mixing ratios taken during ascent (black) and descent
(red) of the SPURT aircraft on 10 November 2001. Right panel: Relative difference of the measured profiles. Gray shading indicates an error range of ±10%.
ACPD
7, 13861–13882, 2007 ACE-FTS satellite validation in the UTLS M. I. Hegglin et al. Title Page Abstract Introduction Conclusions References Tables Figures ◭ ◮ ◭ ◮ Back CloseFull Screen / Esc
Printer-friendly Version Interactive Discussion
EGU Fig. 3. Probability density function of the vertical spacing between the ACE-FTS measurements
(dz) as a function of retrieval altitude. The vertical spacing in the tropopause region (between approximately 8 and 14 km) exhibits values much lower than 1 km.
ACPD
7, 13861–13882, 2007 ACE-FTS satellite validation in the UTLS M. I. Hegglin et al. Title Page Abstract Introduction Conclusions References Tables Figures ◭ ◮ ◭ ◮ Back CloseFull Screen / Esc
Printer-friendly Version Interactive Discussion
EGU Fig. 4. CO-O3 (upper panels) and H2O-O3 correlation (lower panels) for ACE-FTS satellite
(black) and SPURT aircraft (red) data between 30◦and 90◦N. From left to right: winter, spring,
summer, and autumn measurements. Note that the two data sets are obtained during different years.
ACPD
7, 13861–13882, 2007 ACE-FTS satellite validation in the UTLS M. I. Hegglin et al. Title Page Abstract Introduction Conclusions References Tables Figures ◭ ◮ ◭ ◮ Back CloseFull Screen / Esc
Printer-friendly Version Interactive Discussion
EGU
(a) (b)
Fig. 5. Left panels: Vertical profiles of mean CO mixing ratios with standard deviations as a
function of altitude relative to the thermal tropopause for SPURT (black) and ACE-FTS (gray), and for (a) DJF and (b) MAM. Right panels: Relative differences between the SPURT and ACE-FTS mean profiles (black line). The gray bar indicates ±10% relative difference. Horizontal bars show the uncertainties of the relative differences.
ACPD
7, 13861–13882, 2007 ACE-FTS satellite validation in the UTLS M. I. Hegglin et al. Title Page Abstract Introduction Conclusions References Tables Figures ◭ ◮ ◭ ◮ Back CloseFull Screen / Esc
Printer-friendly Version Interactive Discussion
EGU
(a) (b)
ACPD
7, 13861–13882, 2007 ACE-FTS satellite validation in the UTLS M. I. Hegglin et al. Title Page Abstract Introduction Conclusions References Tables Figures ◭ ◮ ◭ ◮ Back CloseFull Screen / Esc
Printer-friendly Version Interactive Discussion
EGU
(a) (b)
ACPD
7, 13861–13882, 2007 ACE-FTS satellite validation in the UTLS M. I. Hegglin et al. Title Page Abstract Introduction Conclusions References Tables Figures ◭ ◮ ◭ ◮ Back CloseFull Screen / Esc
Printer-friendly Version Interactive Discussion
EGU
(a) (b)
Fig. 8. Same as Fig. 6 but the SPURT vertical O3profile is smoothed out in order to account for the limited vertical resolution of the ACE-FTS instrument.