HAL Id: hal-00329243
https://hal.archives-ouvertes.fr/hal-00329243
Submitted on 1 Jan 2002
HAL is a multi-disciplinary open access
archive for the deposit and dissemination of
sci-entific research documents, whether they are
pub-lished or not. The documents may come from
teaching and research institutions in France or
abroad, or from public or private research centers.
L’archive ouverte pluridisciplinaire HAL, est
destinée au dépôt et à la diffusion de documents
scientifiques de niveau recherche, publiés ou non,
émanant des établissements d’enseignement et de
recherche français ou étrangers, des laboratoires
publics ou privés.
Strong sunward propagating flow bursts in the night
sector during quiet solar wind conditions: SuperDARN
and satellite observations
C. Senior, J.-C. Cerisier, F. Rich, M. Lester, G. K. Parks
To cite this version:
C. Senior, J.-C. Cerisier, F. Rich, M. Lester, G. K. Parks. Strong sunward propagating flow bursts in
the night sector during quiet solar wind conditions: SuperDARN and satellite observations. Annales
Geophysicae, European Geosciences Union, 2002, 20 (6), pp.771-779. �hal-00329243�
Geophysicae
Strong sunward propagating flow bursts in the night sector during
quiet solar wind conditions: SuperDARN and satellite observations
C. Senior1, J.-C. Cerisier1, F. Rich2, M. Lester3, and G. K. Parks4
1Centre d’Etude des Environnements Terrestre et Plan´etaires (CETP), 4 Avenue de Neptune, 94107 Saint-Maur Cedex, France 2AFRL, Hanscom Air Force Base, MA 01731, USA
3Radio and Space Plasma Physics, Department of Physics and Astronomy, University of Leicester, Leicester LE1 7RH, UK 4Space Sciences Laboratory, University of California Berkeley, Berkeley, CA 94720–7450, USA
Received: 16 June 2001 – Revised: 18 February 2002 – Accepted: 19 February 2002
Abstract. High-time resolution data from the two Iceland
SuperDARN HF radars show very strong nightside convec-tion activity during a prolonged period of low geomagnetic activity and northward interplanetary magnetic field (IMF). Flows bursts with velocities ranging from 0.8 to 1.7 km/s are observed to propagate in the sunward direction with phase velocities up to 1.5 km/s. These bursts occur over several hours of MLT in the 20:00–01:00 MLT sector, in the evening-side sunward convection. Data from a simultaneous DMSP pass and POLAR UVI images show a very contracted po-lar cap and extended regions of auroral particle precipitation from the magnetospheric boundaries. A DMSP pass over the Iceland-West field-of-view while one of these sporadic bursts of enhanced flow is observed, indicates that the flow bursts appear within the plasma sheet and at its outward edge, which excludes Kelvin-Helmholtz instabilities at the mag-netopause boundary as the generation mechanism. In the nightside region, the precipitation is more spot-like and the convection organizes itself as clockwise U-shaped structures. We interpret these flow bursts as the convective transport fol-lowing plasma injection events from the tail into the night-side ionosphere. We show that during this period, where the IMF clock angle is around 70◦, the dayside magnetosphere is not completely closed.
Key words. Ionosphere (Auroral ionosphere;
Ionosphere-magnetosphere interactions; Particle precipitation)
1 Introduction
During prolonged periods of northward interplanetary mag-netic field (IMF) and low geomagmag-netic activity, observations indicating an active nightside auroral zone have been re-ported in the past. In the Northern Hemisphere and for neg-ative By, the convection tends to be westward at the lower
latitudes and eastward at higher latitudes. The reverse is true
Correspondence to: J.-C. Cerisier
for positive By. Using incoherent scatter radar and DMSP
satellite data, De la Beaujardi`ere et al. (1994) have reported strong southward flow bursts in the night sector associated with velocity dispersed ion precipitation that are believed to be the manifestation of reconnection in the tail. More re-cently, strong flow bursts with velocities larger than 2000 m/s have also been observed by a SuperDARN HF radar (Walker et al., 1998). We report here SuperDARN observations of large flow bursts in the evening and night ionosphere during a prolonged period of northward IMF on 17 December 1998, between 20:00 and 24:00 UT, when the radars were operat-ing in a high spatial and temporal resolution mode, together with coincident satellite observations of auroral emissions by the POLAR UVI instrument and particle precipitation by the DMSP satellite.
2 Observations
2.1 Solar wind and geomagnetic conditions
During the period under study, the WIND satellite was lo-cated in the dawnside upstream solar wind at (21, −49, 9)
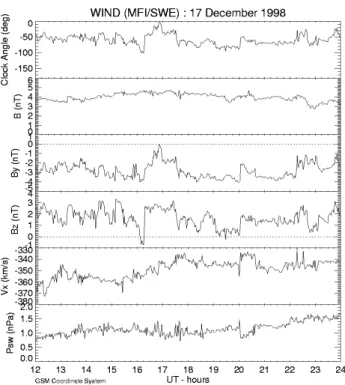
REGSM. Figure 1 shows the IMF and solar wind plasma
pa-rameters on 17 December 1998, for an extended time period from 12:00 to 24:00 UT before and during the radar observa-tions. The Bz IMF component is primarily positive and By
is negative, with the two components being of similar mag-nitude throughout the interval. The total magnetic field B varies between 3.0 and 4.5 nT. The IMF clock angle is of the order of −70◦or smaller during the 20:00–24:00 UT period of interest (0◦ being purely northward IMF, and −90◦ be-ing dusk-to-dawn IMF). In a slightly different situation, with a strong IMF (typically B = 25 nT), Freeman et al. (1993) have shown that a clock angle of 70◦represents the transi-tion at which dayside reconnectransi-tion starts. We will show later that in our case, where the clock angle is also of the order of
−70◦, but where total IMF is much smaller, dayside recon-nection is also occurring during the 20:00–24:00 UT period.
772 C. Senior et al.: Strong sunward propagating flow bursts
1
Figure 1
Fig. 1. WIND IMF and solar wind data in GSM coordinates.
The solar wind speed is about 350 km/s, and the dynamic pressure is very low, between 1.0 and 1.5 nPa. During the whole day, the am index is ≤ 4, and, in addition, no sub-storm activity is observed, as indicated by the flat AU/AL indices (not shown). These conditions imply that the magne-tosphere was in a very quiet state, as defined by Kerns and Gussenhoven (1990), for at least 8 h before 20:00 UT when the SuperDARN observations reported in this paper started, and remained so until the end of the day.
DMSP particle data taken in the period 20:00–24:00 UT exhibit a very small polar cap with no sign of polar cap arc in the Northern Hemisphere, while large boundary populations are consistent with a horse-collar aurora. POLAR UVI im-ages are consistent with DMSP particle data and show a very contracted oval which coincides with the energetic precipita-tion from the plasma sheet. Both data sets show a morning auroral zone that is more developed than the evening one, starting at about 01:00 MLT. These features are similar to those observed previously by the Viking satellite (Elphin-stone et al., 1990) for Bz >0 and By<0.
2.2 Evening sector observations
The SuperDARN (Dual Auroral Radar Network) HF radars (Greenwald et al., 1995) measure the line-of-sight plasma ve-locities in the E- and F-regions. On 17 December 1998, be-tween 20:00 and 24:00 UT, the two radars in Iceland and the Finland radar were operated in a special mode providing a high-time resolution on three of the sixteen possible beam directions, together with a nearly complete line-of-sight ve-locity map every 3 min. Figure 2 shows the fields-of-view (FOV) of the three radars in geographic coordinates, together
2
Figure 2
Fig. 2. Geometry of the fields-of-view of the SuperDARN radars.
The directions of the high-time resolution beams are also indicated.
with the directions of the high resolution beams. The FOV of the Iceland radars at Stokkseyri and Thykkvibaer are di-rected, respectively, towards the west and east and the high-time resolution beams were chosen so as to observe the lon-gitudinal component of the flow. The FOV of the Finland radar at Hankasalmi overlaps the FOV of the Iceland-East radar, but is directed towards geomagnetic north.
Figure 3 shows the radial velocities measured along the 3 high-time resolution beams of the two Iceland radars, as a function of range and time. Blue (green to red) velocities are toward (away from) the radar. The velocities are directed primarily away from the Iceland-West radar, and toward the Iceland-East radar, indicating a general westward flow along the selected beams. Short-duration flow bursts, char-acterized by an increased westward velocity, are observed by both radars. In the Iceland-West data, the flow bursts are observed mainly after 22:10 UT (∼20:00 MLT), up to 02:40 UT on 18 December (∼01:00 MLT). Notice that bursts are also present before that time period, between 21:00 to 21:50 UT, but with smaller velocity increases. In the Iceland-East data, strong bursts are observed throughout the whole period starting at 20:15 UT (∼21:00 MLT), up to 23:45 UT (∼01:00 MLT). Altogether, the MLT sector where the flow bursts are observed, therefore, spans a large region extending from 20:00 to 01:00 MLT.
The finite slope of the radial velocity structures in the range-time diagrams of Fig. 3 suggests a propagation of the bursts across the field-of-view of the radars. This phase mo-tion is away from the Iceland-West radar (positive slope) and toward the Iceland-East radar (negative slope), indicating a westward motion. The modulus of the radial phase veloc-ity is deduced from the slope and varies between 0.8 and 1.7 km/s throughout the time period.
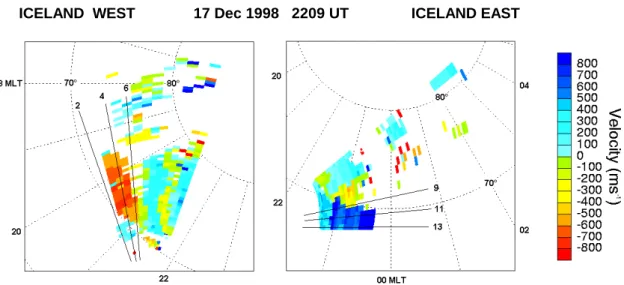
Figure 4 shows radial velocity maps from the two Iceland radars at 22:09 UT (indicated by a vertical line on Fig. 3).
C. Senior et al.: Strong sunward propagating flow bursts 773
Figure 3
DMSP
POLAR-UVI
Fig. 3. Range-time plots of the radial velocities along the three high-time resolution beams from the two radars in Iceland. Positive
(negative) velocities indicate a flow towards (away from) the radar. The vertical line at 22:09 UT indicates the time of the full maps of the radial velocities shown on Fig. 4. The vertical line at 22:30 UT indicates the time of the DMSP pass shown on Fig. 5 and of the POLAR UVI data shown on Fig. 6.
4
Figure 4
ICELAND WEST 17 Dec 1998 2209 UT ICELAND EAST
Fig. 4. Radial velocity maps from the two radar in Iceland at 22:09 UT (Iceland-West is on the left, and Iceland-East is on the right). The
solid lines indicate the directions of the high-time resolution beams along which the data are plotted on Fig. 3. Both maps are consistent with an evening convection cell with sunward flow at low-latitude and anti-sunward flow at high-latitude. The flow bursts are observed in the sunward convection.
These maps are plotted in magnetic latitude and MLT co-ordinates, using the AACGM coordinate system (Baker and Wing, 1989). The direction of the three high-time resolution beams from the two radars is indicated on the maps. The
flow bursts are located within the red (dark blue) velocities at Iceland-West (Iceland-East), i.e. in the westward/sunward flow. The flow bursts appear clearly in Fig. 4 with a north-south extension which is of the order of 3◦. At higher
lati-774 C. Senior et al.: Strong sunward propagating flow bursts
5
Figure 5
Fig. 5. The DMSP-F12 data: (top)
Hor-izontal component of the ion velocity; (middle) Electron spectrogram; (bot-tom) Ion spectrogram. Vertical lines separate the different plasma popula-tions: CPS between A and B, BPS be-tween B and C, and magnetospheric boundary layers at latitudes above C.
tudes, the low radial velocities are consistent with a predom-inantly anti-sunward convection over the polar cap.
Looking at the details of the data from Iceland-West on Fig. 3, a flow burst is observed initially on beam 6 at 22:09 UT. The same flow burst is observed slightly later and at a larger range on beam 4, and then on beam 2. It can thus be deduced that in addition to its radial motion, the structure of the flow burst also drifts across the radar beams in the di-rection of decreasing beam number. Considering the slightly northward orientation of beams 6–4–2 shown on Fig. 4, this allows for the determination of the full phase velocity of the flow burst, which turns out to be about 1.5 km/s in the strictly westward direction.
Around 22:30 UT, the DMSP-F12 satellite passes above the Iceland-West radar field-of-view in the 21:00 MLT sector. The satellite data from the ion driftmeter and particle exper-iment (electrons and ions) are shown on Fig. 5. The particle fluxes are typical of those observed during extremely quiet conditions with Bz > 0 (Newell et al., 1997). The vertical
lines delineate the precipitation from the CPS between 69.7 and 70.0◦ MLat (referred as A and B on the figure), from the BPS between 70.0 and 71.6◦MLat (referred as B and C
on the figure) and from the magnetospheric boundary layers beyond C, up to 76◦ MLat. The horizontal component of the ion drift is perpendicular to the satellite track, positive in the anticlockwise direction, i.e. westward for the satellite moving in the northward direction. The westward ion drift peaks within the CPS and at its outer boundary, with values of about 1300 m/s.
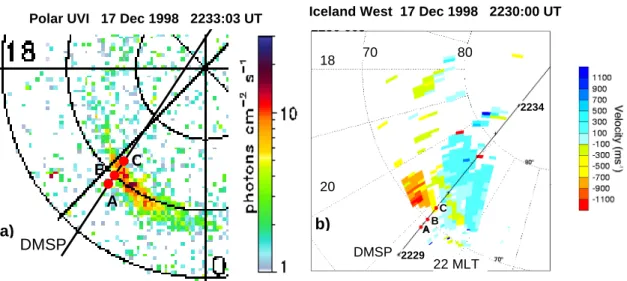
Figure 6 shows satellite and radar data during the flow burst event centered on 22:30 UT (see Fig. 3). The auro-ral image of Fig. 6a is taken by the UVI (UltraViolet Im-ager) instrument on board the POLAR satellite at 22:33 UT, a few minutes after the DMSP pass. The UVI camera at this time was viewing predominantly the nightside and most of the dayside was out of the field-of-view of the instrument. The latitudinal position of the aurora, just north of 70◦MLat at 21:00 MLT, coincides with the position of the auroral pre-cipitation zone BC given by DMSP. In addition, the POLAR UVI data suggest the bursty nature of the aurora with an in-tensification of the emission at 22:33 UT that is not observed on the previous and following images obtained 6 min apart.
Figure 6b shows the radial velocities measured by the Iceland-West radar simultaneously with the DMSP pass and
C. Senior et al.: Strong sunward propagating flow bursts 775
Figure 6
DMSP
A
B
C
a)
22 MLT 20 18 70 80 DMSPb)
Polar UVI 17 Dec 1998 2233:03 UT Iceland West 17 Dec 1998 2230:00 UT
2229
2234
A C B
Fig. 6. Aurora and convection at the time of the DMSP pass. (a) POLAR UVI image. (b) Radial velocity maps from the Iceland-West radar.
The red dots show the location of the particle boundaries A, B, C indicated on Fig. 5.
the POLAR auroral image. The satellite track is plotted on the figure with cross marks at minute intervals. A flow burst with westward velocities exceeding 1200 m/s is observed just north of 70◦within the sunward convection. The locations of the particle boundaries defined in Fig. 5 are shown with black dots. All the energetic precipitation from the plasma sheet between A and C lies within the sunward convection, south of the convection reversal, whereas the precipitation from the magnetospheric boundary layers lies within the anti-sunward polar cap convection. The location of the flow burst and the plasma velocity within it, as determined from both data sets (radars and DMSP), are very similar. Therefore, it is clear that the flow bursts observed by the radar throughout a very large local time sector are located within the central plasma sheet, close to its northern border.
2.3 Midnight sector observations
Figure 7 shows POLAR satellite and radar data illustrating the flow burst observed around 23:45 UT. The POLAR im-age (Fig. 7a) shows a bright precipitation spot centered at 01:00 MLT and 70◦MLat with a maximum intensity which is approximately aligned in the north-south direction (the reader is cautioned that UVI images are obtained on a plat-form that wobbles; thus, artificial streaks can be introduced in the images). The radial velocity map from the Iceland-East radar (Fig. 7c) shows strong westward velocities, up to 2000 m/s, at the southern edge of the precipitation spot. North of the precipitation spot, the negative radial velocities are consistent with an eastward plasma flow which rotates to southward on the eastern edge of the Iceland-East radar field-of-view. This southward flow on the eastern edge of the precipitation spot is confirmed by the simultaneous Fin-land velocity map (Fig. 7d) which shows positive (towards the radar) velocities. Therefore, a clockwise U-shaped con-vection organizes around the bright spot seen by POLAR.
This scenario is consistent with the hypothesis of Morelli et al. (1995), who suggested that in the nighttime ionosphere, regions of rapid flow can encircle regions of low flow where the conductivity is larger, due to precipitation. It is worth noting that for both radars, backscatter echoes disappear in the region centered at 01:00 MLT, 71◦MLat, where the pre-cipitation is most intense. If D-region absorption were the cause of the loss of scatter, the region without echo should be in the D-region part of the path, i.e. closer to the radar than the precipitation region. The alternative explanation is that the electric field at the center of the vortex is smaller, thus, reducing the generation of irregularities, as suggested by Milan et al. (1999).
Very interestingly, the time plot of the Finland radar data (Fig. 7b) shows a southward motion of the echo region with a velocity approximately equal to the plasma velocity, which suggests that the auroral feature also drifts southward.
3 Summary and discussion
3.1 Convection and structure of the flow bursts
The flow bursts are observed in the evening and nightside auroral convection region. In the evening sector, the precip-itation appears as east-west elongated structures (see Fig. 6) and the flow bursts are essentially westward. From Figs. 3 and 4, it is also clear that the flow bursts are limited to the re-gion of sunward convection and are not observed north of the convection reversal (see, for example, beam 6 of the Iceland-West radar at 22:30 UT, and beam 9 of the Iceland-East radar between 21:30 and 22:10 UT on Fig. 3). The DMSP drift-meter data indicate that the flow bursts are most intense in the CPS (the region between A and B on Fig. 5), where electron precipitation above 1 keV is very low. This is consistent with the hypothesis of a low conductivity in that region. Thus, the
776 C. Senior et al.: Strong sunward propagating flow bursts
7
Figure 7
ICELAND – EAST 2342 UT
FINLAND 2342 UT
FINLAND 17 DEC 1998
00 01 02 MLT
23 00 01 02 MLT
80
°
70°
80°
70°
a)
c)
d)
b)
Fig. 7. The clockwise vortical flow around an auroral bright spot. (a) POLAR UVI auroral image. (b) The range-time plot of the radial
velocity from beams 5 and 7 of the Finland radar. (c) The radial velocity map from the Iceland-East radar. (d) The radial velocity map from the Finland radar.
closure of the large scale magnetospheric Birkeland currents (flowing upward in region 1 at latitudes between B and C) through north-south ionospheric Pedersen currents implies a strong electric field and consequently, a fast convection in the CPS region.
The range-time plots of Fig. 3 show that, in the evening sector, the bursts appear in groups which have a duration of 10 to 15 min. Inside each group, individual bursts are shorter, with a duration of 5 min, which corresponds to their transit time across the field-of-view of the radars. Their spatial ex-tent can be deduced, either from the range-time plots of Fig. 3 or from the maps of Fig. 4. The longitudinal dimension is small (two range gates), of the order of 100 km, while their latitudinal extent covers several degrees in latitude.
Figure 8 shows the global convection patterns deduced from the full set of Northern Hemisphere SuperDARN radars (Ruohoniemi and Baker, 1998; Shepherd and Ruohoniemi, 2000), at four selected times. In all cases, the afternoon cell is over-developed compared to the morning cell, in agreement with the statistical study of Taguchi and Hoffman (1996), and as expected for negative IMF By. Figures 8a and c show the
convection at 22:10 and 23:10 UT in the presence of flow bursts. The potential drop across the polar cap is estimated to be of the order of 40 kV during the events. Outside of the events, the convection pattern (Fig. 8b) remains qualitatively the same, but with a lower potential drop, which decreases to about 25 kV. At 23:45 UT, in the nightside region where the precipitation is spot-like (Fig. 7), the convection organizes as
C. Senior et al.: Strong sunward propagating flow bursts 777
Figure 8
a
b
d
c
Fig. 8. Fitted velocity vectors and electrostatic potential contours from the line of sight measurements of Northern Hemisphere SuperDARN
radars at four selected times during and outside the flow burst events described in Figs. 6 and 7. The direction of the IMF and the cross polar cap potential are indicated on the lower right-hand side of the maps.
a clockwise U-shaped structure around the precipitation spot situated at 00:10 MLT and 71◦MLat, with both southward and westward velocities on the eastern and southern sides of the precipitation, respectively. The impact on the global con-vection pattern (Fig. 8d) is the intrusion of the afternoon cell towards the morning in the midnight sector.
3.2 Origin of the flow bursts
The question now is: why is the convection bursty? Un-like the flow burst event studied by Walker et al. (1998)
and Walker (2000), the Fourier analysis of time series of radial velocity measurements does not show any preferred frequency, which excludes the hypothesis of field-line reso-nances. Two other possibilities are briefly discussed below.
a) For the IMF conditions prevailing during the period un-der study, viscous drag drives part of the convection, even if weak reconnection occurs on the dayside. The development of a Kelvin-Helmholtz instability in the low-latitude boundary layer could then lead to a turbu-lent flow. However, one would expect the turbuturbu-lent flow
778 C. Senior et al.: Strong sunward propagating flow bursts to affect mainly the latitudes poleward of the
convec-tion flow reversal. Furthermore, the turbulent structure would propagate in the anti-sunward direction. Thus, the observations are not consistent with the predictions of the Kelvin-Helmholtz instability.
b) De la Beaujardi`ere et al. (1994) have observed, in the midnight sector and during very quiet conditions, south-ward flow bursts drifting westsouth-ward, associated with southward moving auroral arcs. These observations are very similar to the ones presented here in the night sec-tor (see Fig. 7). De la Beaujardi`ere et al. (1994) have associated these events with plasma injections from the tail resulting from enhanced reconnection, essentially on the basis of their analogy with daytime flux transfer events and their association with velocity dispersed ion structures (VDIS). On the other hand, nightside, north-south elongated auroral structures moving north-southward have long been observed (Sergeev et al., 1990). Hen-derson et al. (1998), Lyons et al. (1999), and Sergeev et al. (1999, 2000) have recently associated the equa-torward motion of auroral structures with the earthward injection of high velocity plasma from the distant to the near-Earth plasma sheet, the bursty bulk flow events (BBFs). Indeed, we suggest that our flow bursts are the ionospheric manifestation of BBFs. The typical dura-tion of BBFs is 10 min, with one-minute sub-structures (Angelopoulos et al., 1992, 1994), which are not very different, although slightly shorter, from the time scales of the ionospheric flow bursts discussed above. In addi-tion, Nishida et al. (1997) have shown that ion injection events also occur during magnetically quiet periods. All these results agree with the present observations (see Fig. 3).
Finally, we have mapped the high-latitude limit of the flow bursts shown in Fig. 4 onto the tail, using the Tsyganenko (1995) model. The radial distance varies between 15 and 17 RE, which is slightly smaller than the 19 RE limit where
the occurrence rate of earthward BBFs starts to decrease (An-gelopoulos et al., 1994). Therefore, it is likely that the flow bursts and the southward moving auroral structures are the ionospheric manifestation of the same magnetospheric pro-cess.
In the framework of this interpretation, our observations show that the detailed characteristics of the ionospheric sig-natures depend upon the MLT. The southward flows are ob-served only in the midnight sector and disappear at earlier MLTs, where the flows become strictly westward.
The additional potential associated with the flow bursts can be estimated in two different ways:
(1) the latitudinal width of the bursts is about 3◦with an in-crease in the convection velocity from 500 to 1500 m/s. Assuming a magnetic field of 50 000 nT, one obtains a potential increase of about 15 kV;
(2) the series of maps of Fig. 8 show that the polar cap potential increases from 25 kV in the absence of flow
bursts, up to about 40 kV when flow bursts are observed. The good agreement between the two above evaluations gives confidence in the value of 15 kV associated with the flow bursts.
Nightside sporadic reconnection associated with the flow bursts destroys open flux in the polar cap. In the absence of dayside reconnection, the polar cap should then shrink. How-ever, let us show that the shrinking, consistent with a closed dayside magnetosphere, is too large and not consistent with the observations.
Figure 3 shows that the bursts occur during about 33% of the time, which leads to a mean potential drop of 5 kV for the part associated with the flow bursts. These 5 kV are to be added to the basic convection potential existing in the ab-sence of flow bursts, which is about 25 kV (see Fig. 8b), thus, leading to a mean value of 30 kV. During the period from 20:30 to 23:00 UT, and assuming a circular polar cap with an initial radius of 15◦(which is consistent with POLAR obser-vations), these 30 kV imply a uniform 4.5◦northward shift of the polar cap boundary. Even if a part of this potential drop (typically 10 kV) is attributed to the viscous interaction between the solar wind and the magnetosphere, the polar cap boundary retreat would be only 3.3◦.
Although the aurora seen by the POLAR UVI instrument was faint and the images did not cover the dayside polar cap, these images, nevertheless, show that the aurora in the mid-night sector has moved northward by about 2◦ during the same time period between 20:30 and 23:00 UT. Therefore, the POLAR UVI data do not support the northward motion of the open-closed field line boundary estimated on the basis of a closed dayside magnetosphere.
Consequently, the nightside reconnection associated with the flow bursts is at least partly balanced by dayside recon-nection. And indeed, Freeman et al. (1993) have shown that an IMF clock angle of −70◦, prevailing during our experi-ment represents the transition at which dayside reconnection starts.
4 Conclusions
In conclusion, we have shown that strong bursty convective flows are observed in the evening and nighttime auroral iono-sphere during magnetically quiet, positive Bzperiods. These
flows are observed in regions of low ionospheric conductiv-ity, in close proximity to, but just south of, auroral precipi-tation. We suggest that these flow bursts are associated with reconnection in the tail, occurring during persistent dayside reconnection.
Acknowledgements. The Cutlass Thykkvibaer and Hankasalmi
radars are supported by the Particle Physics and Astronomy Re-search Council (PPARC) in the UK. The Iceland West SuperDARN radar is supported by Institut National des Sciences de l’Univers (INSU) in France. We thank both referees for useful comments and suggestions.
The Editor in chief thanks V. Sergeev and M. Pinnock for their help in evaluating this paper.
References
Angelopoulos, V., Baumjohann, W., Kennel, C. F., Coroniti, F. V., Kivelson, M. G., Pellat, R., Walker, R. J., L¨uhr, H., and Paschmann, G.: Bursty bulk flows in the inner central plasma sheet, J. Geophys. Res., 97, 4027–4039, 1992.
Angelopoulos, V., Kennel, C. F., Coroniti, F. V., Pellat, R., Kivel-son, M. G., Walker, R. J., Russel, C. T., Baumjohann, W., Feld-man, W. C., and Gosling, J. T.: Statistical characteristics of bursty bulk flows events, J. Geophys. Res., 99, 21 257–21 280, 1994.
Baker, K. B. and Wing, S.: A new magnetic coordinate system for conjugate studies at high latitude, J. Geophys. Res., 94, 9139– 9143, 1989.
De la Beaujardi`ere, O., Lyons, L. R., Ruohoniemi, J. M., Friis-Christensen, E., Danielsen, C., Rich, F. J., and Newell, P. T.: Quiet-time intensifications along the poleward auroral boundary near midnight, J. Geophys. Res., 99, 287–298, 1994.
Elphinstone R. D., Jankowska, K., Murphree, J. S., and Cog-ger, L. L.: The configuration of the auroral distribution for in-terplanetary magnetic field Bznorthward. 1. IMF Bxand By
de-pendencies as observed by the Viking satellite, J. Geophys. Res., 95, 5791–5804, 1990.
Freeman, M. P., Farrugia, C. J., Burlaga, L. F., Hairston, M. R., Greenspan, M. E., Ruohoniemi, J. M., and Lepping, R. P.: The interaction of a magnetic cloud with the Earth: Ionospheric con-vection in the northern and southern hemispheres for a wide range of quasi-steady interplanetary magnetic field conditions, J. Geophys. Res., 98, 7633–7655, 1993.
Greenwald, R. A., Baker, K. B., Dudeney, J. R., Pinnock, M., Jones, T. B., Thomas, E. C., Villain, J.-P., Cerisier, J.-C., Se-nior, C., Hanuise, C., Hunsucker, R. D., Sofko, G., Koehler, J., Nielsen, E., Pellinen, R., Walker, A. D. M., Sato, N., and Yam-agishi, H.: DARN/SuperDARN: A global view of high-latitude convection, Space Sci. Rev., 71, 761–796, 1995.
Henderson, M. G., Reeves, G. D., and Murphree, J. S.: Are north-south aligned auroral structures an ionospheric manifestation of bursty bulk flows?, Geophys. Res. Lett., 25, 3737–3740, 1998. Kerns, K. J. and Gussenhoven, M. S.: Solar wind conditions for a
quiet magnetosphere, J. Geophys. Res., 95, 20 867–20 875, 1990. Lyons, L. R., Nagai, T., Blanchard, G. T., Samson, J. C., Ya-mamoto, T., Mukai, T., Nishida, A., and Kokobun, S.: As-sociation between Geotail plasma flows and auroral poleward boundary intensifications observed by CANOPUS photometers, J. Geophys. Res., 104, 4485–4500, 1999.
Milan, S. E., Davies, J. A., and Lester, M.: Coherent HF radar backscatter characteristics associated with auroral forms identi-fied by incoherent radar techniques: a comparison of CUTLASS
and EISCAT observations, J. Geophys. Res., 104, 22 591–22 604, 1999.
Morelli, J. P., Bunting, R. J., Cowley, S. W. H., Farrugia, C. J., Free-man, M. P., Friis-Christensen, E., Jones, G. O. L., Lester, M., Levis, R. V., L¨uhr, H., Orr, D., Pinnock, M., Reeves, G. D., Williams, P. J. S., and Yeoman, T. K.: Radar observations of auroral zone flows during a multiple-onset substorm, Ann. Geo-physicae, 13, 1144–1163, 1995.
Newell, P. T., Xu, D., Meng, C.-I., and Kivelson, M. G.: Dynamical polar cap: A unifying approach, J. Geophys. Res., 102, 127–139, 1997.
Nishida, A., Mukai, T., Yamamoto, T., Saito, Y., Kokobun, S., and Lepping, R. P.: Traversal of the nightside magnetosphere at 10 to 15 REduring northward IMF, Geophys. Res. Lett., 24, 939–942,
1997.
Ruohoniemi, J. M. and Baker, K. B.: Large-scale imaging of the high-latitude convection with Super Dual Auroral Radar Net-work HF radar observations, J. Geophys. Res., 103, 20 797– 20 812, 1998.
Sergeev, V. A., Aulamo, O., Pellinen, R. J., Vallinkoski, M. K., Bosinger, T., Cattell, C. A., Elphic, R. C., and Williams, D. J.: Non-substorm transient injections in the ionosphere and magne-tosphere, Planet. Space Sci., 38, 231–239, 1990.
Sergeev, V. A., Liou, K., Meng, C.-I., Newell, P. T., Brittnacher, M., Parks, G., and Reeves, G. D.: Development of auroral stream-ers in association with localized impulsive injections to the inner magnetotail, Geophys. Res. Lett., 26, 417–420, 1999.
Sergeev, V. A., Sauvaud, J.-A., Popescu, D., Kovrazhkin, R. A., Liou, K., Newell, P. T., Brittnacher, M., Parks, G., Nakamura, R., Mukai, T., and Reeves, G. D.: Multiple spacecraft observa-tion of a narrow transient plasma jet in the Earth’s plasma sheet, Geophys. Res. Lett., 27, 851–854, 2000.
Shepherd, S. G. and Ruohoniemi, J. M.: Electrostatic potential pat-terns in the high-latitude ionosphere constrained by SuperDARN measurements, J. Geophys. Res., 105, 23 005–23 014, 2000. Taguchi, S. and Hoffman, R. A.: Ionospheric plasma convection in
the midnight sector for northward interplanetary magnetic field, J. Geomag. Geoelectr., 48, 925–933, 1996.
Tsyganenko, N. A.: Modelling the Earth’s magnetospheric mag-netic field confined with a realistic magnetopause, J. Geophys. Res., 100, 5599–5612, 1995.
Walker, A. D.: Radar and magnetometer observations of pulsations at a quiet time, SuperDARN Conference Proceedings, Beech-worth, Australia, 2000.
Walker, A. D. M., Pinnock, M., Baker, K. B., Dudeney, J. R., and Rash, J. P. S.: Strong flow bursts in the nightside ionosphere dur-ing extremely quiet solar wind conditions, Geophys. Res. Lett., 25, 881–884, 1998.