HAL Id: hal-00084789
https://hal.archives-ouvertes.fr/hal-00084789
Submitted on 6 Aug 2020
HAL is a multi-disciplinary open access
archive for the deposit and dissemination of sci-entific research documents, whether they are pub-lished or not. The documents may come from teaching and research institutions in France or abroad, or from public or private research centers.
L’archive ouverte pluridisciplinaire HAL, est destinée au dépôt et à la diffusion de documents scientifiques de niveau recherche, publiés ou non, émanant des établissements d’enseignement et de recherche français ou étrangers, des laboratoires publics ou privés.
Ozone pollution from future ship traffic in the Arctic
northern passages
Claire Granier, Ulrike Niemeier, J.H. Jungclaus, Louisa Emmons, Peter Hess,
Jean-François Lamarque, Stacy Walters, Guy P. Brasseur
To cite this version:
Claire Granier, Ulrike Niemeier, J.H. Jungclaus, Louisa Emmons, Peter Hess, et al.. Ozone pollution from future ship traffic in the Arctic northern passages. Geophysical Research Letters, American Geophysical Union, 2006, 33, pp.L13807. �10.1029/2006GL026180�. �hal-00084789�
Ozone pollution from future ship traffic in the Arctic northern
passages
Claire Granier,1,2,3Ulrike Niemeier,4 Johann H. Jungclaus,4 Louisa Emmons,5 Peter Hess,5Jean-Franc¸ois Lamarque,5Stacy Walters,5 and Guy P. Brasseur4,6
Received 6 March 2006; revised 27 April 2006; accepted 30 May 2006; published 8 July 2006.
[1] With sea ice expected to recede in the Arctic during the
21st century as a result of projected climate warming, global shipping patterns will change considerably in the decades ahead. The opening of viable shipping routes through the Northern passages will generate new environmental problems including the degradation of air quality in the Arctic. The release of considerable amounts of carbon monoxide, nitric oxide and other chemical substances by the ship’s combustion engines will enhance the level of atmospheric photooxidants and other secondary pollutants in this region. Here we show that, during the summer months, surface ozone concentrations in the Arctic could be enhanced by a factor of 2 – 3 in the decades ahead as a consequence of ship operations through the northern passages. Projected ozone concentrations of 40 – 60 ppbv from July to September are comparable to summertime values currently observed in many industrialized regions in the Northern Hemisphere.Citation: Granier, C., U. Niemeier, J. H. Jungclaus, L. Emmons, P. G. Hess, J.-F. Lamarque, S. Walters, and G. P. Brasseur (2006), Ozone pollution from future ship traffic in the Arctic northern passages, Geophys. Res. Lett., 33, L13807, doi:10.1029/2006GL026180.
1. Introduction
[2] For a long time, the Arctic area has been a pristine
area. Since the 1950s, however, reddish haze bands have been observed in this region, mostly in late winter [Mitchell, 1956]. In the 1970s, it was recognized that this Arctic haze was the result of air pollution produced by human activities at mid-latitudes [Rahn and Mccaffrey, 1979].
[3] The chemical composition of the Arctic atmosphere is
expected to change further in the future as a result of human activities in the industrialized and urbanized regions of the Northern hemisphere. However, in the case of surface ozone, models suggest that, in the Arctic region, the concentration increase expected from these distant pertur-bations should be modest in the coming decades (less than 3 ppbv for the 1990 – 2030 period according to Dentener et
al. [2005]; less than 5 ppbv for the 2000 – 2030 period according to Stevenson et al. [2006]; and less than 8 ppbv for the 2000 – 2100 period according to Brasseur et al. [2006]).
[4] Emissions of chemical compounds from ships have
become a growing issue over the past few years. Surface emissions resulting from international shipping operations are substantial [Eyring et al., 2005a and references therein], and their effects on the atmospheric composition at the global scale could be significant [Lawrence and Crutzen, 1999]. For example, large amounts of nitrogen oxides have recently been detected by satellite along shipping routes [Beirle et al., 2004], demonstrating the potential impact of shipping activities on the distribution of atmospheric species.
[5] Here, we quantify the impact of the near-future
opening of new shipping routes in the Arctic. As a result of human-driven climate warming, a gradual melting of the Arctic ice cap is predicted to occur in the decades ahead. This will likely result in the opening of the Northeast Passage along the northern coastline of Siberia, as well as of the Northwest Passage in the Canadian Archipelago and along the northern Alaskan coastline. Satellite observations have shown a persistent reduction in summertime Arctic sea ice over the last 4 years [Lindsay and Zhang, 2005; Stroeve et al., 2005], which may be the onset of a long-term decline. Although summertime Arctic shipping may require special equipment, assistance, and probably protection against ice-bergs, the opening of the northern passages could become a viable economic alternative to southern routes. For exam-ple, the distance traveled from Europe to eastern Asia along the new polar routes could be more than 7000 km shorter than along the southern routes via the Panama or the Suez Canals.
2. Models and Ships Surface Emissions
[6] The future evolution of the global climate and
spe-cifically of the Arctic ice sheet in response to changing atmospheric greenhouse gas and aerosol concentrations was calculated using the ECHAM5/MPI-OM coupled atmo-sphere-ocean general circulation model. The model does not require any flux adjustments to maintain a stable climate and has been tested for several applications under present-day conditions [Jungclaus et al., 2005; Marsland et al., 2003] (A detailed description of this model is provided in the auxiliary material1). The simulations were carried out for the period 1860 – 2100 in the framework of the fourth
1Auxiliary material is available in the HTML. 1Service d’Ae´ronomie/IPSL, Universite´ Pierre et Marie Curie, Paris,
France.
2
Also at NOAA ESRL/CIRES Chemical Sciences Division, Boulder, Colorado, USA.
3
Formerly at Max Planck Institute for Meteorology, Hamburg, Germany.
4
Max Planck Institute for Meteorology, Hamburg, Germany.
5National Center for Atmospheric Research, Boulder, Colorado, USA. 6
Now at National Center for Atmospheric Research, Boulder, Colorado, USA.
Copyright 2006 by the American Geophysical Union. 0094-8276/06/2006GL026180
Assessment Report of the Intergovernmental Panel on Climate Change (IPCC) planned for the year 2007. The model was initialized from the end of a pre-industrial control experiment and then forced with observed green-house gas and aerosol concentrations for the period 1860 – 2000. Thereafter greenhouse gas and aerosol concentrations followed the so-called SRES A1B scenario [Intergovern-mental Panel on Climate Change, 2000], and providing a moderate climate response. The model suggests that a significant reduction in the fraction of ice cover is to be expected in the decades ahead in the northern passages from May to October, which would open shipping routes in the Arctic during the summer months (Figure 1). The model results are in agreement with the results presented in the Arctic Climate Impact Assessment [Hassol, 2004].
[7] In almost all cases, ship propulsion is achieved
through diesel engines. The emissions associated with these engines, primarily as carbon monoxide (CO) and nitrogen oxides (NOx= NO + NO2 assumed to be emitted as NO)
have not yet been efficiently regulated even though the International Maritime Organization (IMO, available at http://www.imo.org) through the International Convention for the Prevention of Marine Pollution from Ships (MARPOL) calls for a 30% reduction in the NOxemissions
from operating vessels [Eyring et al., 2005b]. Over the past
decades, the emissions of ships have increased dramatically [Lawrence and Crutzen, 1999; Eyring et al., 2005a]. Future changes, however, are difficult to predict because they depend on future economic growth, engine technology, and environmental regulations.
[8] Eyring et al. [2005b] provide different scenarios for
future emissions by ships at the global scale. In their DS4 scenario, which considers a business-as-usual case, they derive for the global NOx emission by ships an increase
from 6.5 TgN/yr in year 2000 to 11.8 TgN/yr in 2050. [9] In the present study, which reflects a situation around
2050, we have considered two cases: we assumed that, among this 5.3 Tg N/yr increase in emissions from ships, 25% or 12.5% (i.e., 1.3 TgN/yr or 0.65 Tg N/yr) would be resulting from Arctic ships. The emissions from the ships have been distributed uniformly along the ship tracks in the Arctic passages shown in Figure 1b. Adopting the same proportion in the case of carbon monoxide, the CO emission added along the Arctic routes is 0.14 Tg and 0.07 CO/yr. The MOZART-4 (Model for Ozone and Related chemical Tracers, available from http://gctm.acd.ucar.edu/mozart) global chemistry-transport model (Emmons et al., in prep-aration, 2006, and details in the auxiliary material) is used for the simulations of the distribution of tropospheric chemical species, such as CO, NOxand ozone. The
emis-Figure 1. Summer (June to October) mean sea ice coverage (in %) derived by the ocean atmosphere climate model for the periods (a) 2001 – 2005, and (b) 2050 – 2060. The model representations of the Northeast (green) and Northwest (red) passages are also indicated. (c) Temporal evolution of the percentage of sea ice cover in the Northwest Passage in September (black), July (green), November (purple), May (dark blue), January (light blue), and March (red).
L13807 GRANIER ET AL.: OZONE POLLUTION FROM FUTURE SHIP TRAFFIC L13807
sions resulting for ships in the Arctic are applied during the June to October period in the new corridors, with all other emissions remaining unchanged.
[10] MOZART has been driven with offline meteorology
provided by the European Center for Medium-Range Weather Forecasts (ECMWF, available at http:// www.ecmwf.int/products/forecasts). A reference run was performed using meteorological fields from 3-hour archives from ECMWF for the year 1997. Surface emissions for this reference run were taken from the POET database (Granier et al., electronic data, 2005, available at http://www.aero. jussieu.fr/projet/ACCENT/POET.php). The model derives background trace gas distributions that are generally in good agreement with observations made in the Arctic region [Emmons et al., 2003].
[11] In order to isolate the contribution of Arctic ships on
the chemical composition of the region, the simulations performed for the perturbed conditions used the same meteorological fields as in the base case. They also used the same surface emissions except in the case of NOxand
CO, where the emissions were perturbed as discussed above. Previously reported model simulations [Brasseur et al., 2006] have shown that the adoption of meteorological fields simulated by the model for year 2050 does not lead to any significant changes in the calculated high-latitude chemical fields.
[12] The location of the surface emissions from arctic
ships, corresponding to an emission of 1.3 Tg N/yr and 0.14 Tg CO/yr, were determined by interpolating the results of the ECHAM5-MPI-OM model (Figure 1b) on the MOZART grid, that is, approximately 2.8 degrees in both latitude and longitude (T42 resolution). In order to assess the degree of linearity of the response of the photochemical system, a second case in which the arctic ships emissions are divided by a factor 2 (i.e., 0.65 Tg N/yr and 0.07 Tg CO/yr), is also considered.
3. Model Results
[13] Pollutants such as nitrogen oxides, carbon monoxide
and unburned hydrocarbons released by ships contribute to
the formation of ozone, a secondary pollutant that can have harmful effects on vegetation and human health. The formation of ozone, when sunlight conditions prevail, results from the photolysis of nitrogen oxides (NO2), which
is itself produced through the conversion of nitric oxide (NO) by peroxy radicals (such as HO2). These radicals are
generated by the oxidation of carbon monoxide (CO) and hydrocarbons primarily by the hydroxyl (OH) radical. In most regions of the troposphere, including the remote Arctic areas where background concentrations of pollutants are particularly low, the formation rate of ozone is limited by the amount of nitrogen oxides that are present in the atmosphere. Thus, in the Northern part of Canada and Siberia, where the background NOx abundance is very
low, the ozone mixing ratio is typically 20 – 30 ppbv from May to October (see, for example, observations performed at Barrow, Alaska (71N) reported in Figure 2), to be contrasted with observations of typically 20 – 60 ppbv in the industrialized regions of Europe and North America [Logan, 1999].
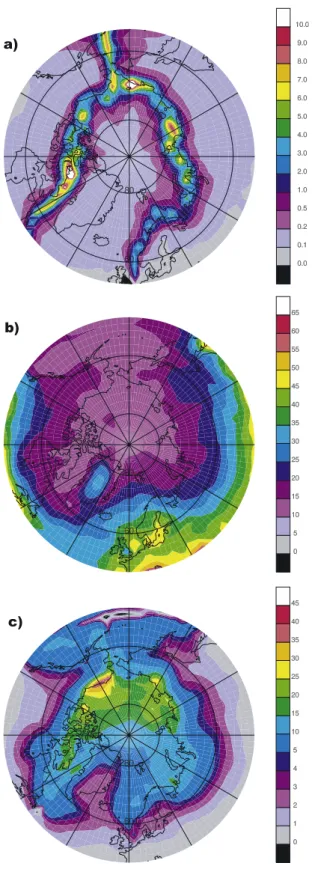
[14] As shown by Figure 3a, the change in the monthly
average mixing ratio of NOxresulting from ship emissions
in the summer Arctic follows rather closely the emissions patterns due to the short residence time of reactive nitrogen. An increase of up to 10 ppbv is calculated along the shipping routes.
[15] In the absence of ship emissions in the Arctic, the
presence of ozone at high latitudes results primarily from the long-range transport of this molecule. The monthly mean ozone mixing ratio is of the order of only 10 – 15 ppbv during summertime (Figure 3b), with values reaching 25 – 30 ppbv along the Scandinavian coast line and near Green-land. The dramatic ozone increase in the Arctic (Figure 3c) calculated in response to ship operation is explained by the fact that ship emissions provide the only local source of ozone precursors in this region. In addition, because the ozone production is a highly non-linear process, the number of ozone molecules produced per nitric oxide molecule emitted is higher when the background NOx level is low
[Liu et al., 1987]. In the Artic, the photochemical lifetime of ozone is rather long, and its deposition velocity on ice and water is small. Therefore, the calculated concentration increase in the summer months is distributed over the entire Arctic region. Along the northern coast of Alaska, for example, the monthly average change in the ozone concen-tration reaches 45 ppbv. Significant increases are also calculated in Scandinavia (up to 5 ppbv or 20%), and in Newfoundland (5 ppbv or 17%).
[16] Surface ozone observations in the Arctic at the
Barrow station (71.2°N; 156.4°W) have been performed over several years [Oltmans et al., 1998] (data available at http://www.cmdl.noaa.gov/ozwv). At this location, the ozone concentration increases substantially during summer-time in response to ship traffic (Figure 2). This station is located in the area, which, according to our calculations, will be strongly affected by Arctic shipping. The evolution of the background ozone concentration calculated with analyzed meteorology for year 1997 follows the observa-tions for the same year [Oltmans et al., 1998], even if the simulated values are slightly lower than the measurements. When Arctic shipping is taken into account, the daily-averaged concentrations are considerably higher in July Figure 2. Surface ozone observed at the station of Barrow
(71.2 N; 156.4 W) in Alaska (dots) from May to September 1997 [from Oltmans et al., 1998]. The background ozone mixing ratios calculated for current chemical emissions and for analyzed meteorological fields [Oltmans et al., 1998] during the same period, are shown by the full line. Ozone mixing ratios derived when Arctic ships emissions are taken into account, are shown by the dashed line.
and August, with peaks reaching more than 60 ppbv (Figure 2). The day-to-day variability is high, and is associated with the transport of pollution plumes.
4. Summary and Conclusions
[17] In conclusion, the opening of new shipping routes in
the Arctic could lead to an important increase in ozone levels in this remote region of the planet, if no specific measures are taken to limit the emissions by ship engines. Furthermore, it should be noted that combustion in ship engines produces not only a significant amount of ozone precursors, but also large quantities of carbon dioxide, as well as of particulate matter (black carbon) and sulfur dioxide, a gas that is eventually converted into sulfate aerosol particles. This could potentially have a significant impact on the local chemistry as chemical uptake on aerosols could affect NOx and HOx compounds. These
gases and aerosols could directly or indirectly affect radia-tive transfer by absorbing and scattering incoming solar radiation, by affecting cloud optical properties and by reducing surface albedo (since black carbon particles can be deposited on snow and ice). The related impact on regional climate forcing resulting from the opening of the northern routes to ship traffic could therefore be significant in the Arctic.
[18] Acknowledgments. The authors would like to thank the ECHAM-5, OM-1 and MOZART groups (listed in the auxiliary material) for providing their models for the study. We thank S. Solomon and Elina Marmer for useful comments on the manuscript. Part of this study has been funded by the French National Program for Atmospheric Chemistry. The National Center for Atmospheric Research is sponsored by the National Science Foundation and operated by the University Corporation for Atmospheric Research.
References
Beirle, S., U. Platt, R. von Glasow, M. Wenig, and T. Wagner (2004), Estimate of nitrogen oxide emissions from shipping by satellite remote sensing, Geophys. Res. Lett., 31, L18102, doi:10.1029/2004GL020312. Brasseur, G. P., M. Schultz, C. Granier, M. Saunois, T. Diehl, M. Botzet,
E. Roeckner, and S. Walters (2006), Impact of climate change on the future chemical composition of the global troposphere, J. Clim., in press. Dentener, F., D. Stevenson, J. Cofala, R. Mechler, M. Amann, P. Bergamaschi, F. Raes, and R. Derwent (2005), The impact of air pollutant and methane emission controls on tropospheric ozone and ra-diative forcing: CTM calculations for the period 1990 – 2030, Atmos. Chem. Phys., 5, 1731 – 1755.
Emmons, L. K., et al. (2003), Budget of tropospheric ozone during TOPSE from two chemical transport models, J. Geophys. Res., 108(D8), 8372, doi:10.1029/2002JD002665.
Eyring, V., H. W. Ko¨hler, J. van Aardenne, and A. Lauer (2005a), Emis-sions from international shipping: 1. The last 50 years, J. Geophys. Res., 110, D17305, doi:10.1029/2004JD005619.
Eyring, V., H. W. Ko¨hler, A. Lauer, and B. Lemper (2005b), Emissions from international shipping: 2. Impact of future technologies on scenarios until 2050, J. Geophys. Res., 110, D17306., doi:10.1029/2004JD005620. Hassol, S. J. (2004), Arctic Climate Impact Assement: Impacts of a warm-ing Arctic, Cambridge Univ. Press, New York. (Available at http:// www.acia.uaf.edu)
Intergovernmental Panel on Climate Change (2000), Special Report on Emissions Scenarios, edited by N. Nakicenovic and R. Swart, 570 pp., Cambridge Univ. Press, New York.
Jungclaus, J. H., M. Botzet, H. Haak, N. Keenlyside, J.-J. Luo, M. Latif, J. Marotzke, U. Mikolajewicz, and E. Roeckner (2005), Ocean circulation and tropical variability in the coupled model ECHAM5/MPI-OM, J. Clim., in press.
Lawrence, M. G., and P. J. Crutzen (1999), Influence of NOx emissions
from ships on tropospheric photochemistry and climate, Nature, 402, 167 – 170.
Figure 3. Surface NOx, ozone distribution and changes in
the Arctic in July. (a) Change in NOxresulting from Arctic
ships (ppbv); (b) surface ozone for current conditions (ppbv); (c) change in ozone resulting from Arctic ships (ppbv).
L13807 GRANIER ET AL.: OZONE POLLUTION FROM FUTURE SHIP TRAFFIC L13807
Lindsay, R. W., and J. Zhang (2005), The thinning of Arctic sea ice, 1988 – 2003: Have we passed a tipping point?, J. Clim., 18, 4879 – 4894, doi:10.1175/JCLI3587.1.
Liu, S. C., M. Trainer, F. C. Fehsenfeld, D. D. Parrish, E. J. Williams, D. W. Fahey, G. Hubler, and P. C. Murphy (1987), Ozone production in the rural troposphere and the implications for regional and global ozone distributions, J. Geophys. Res., 92, 4191 – 4207.
Logan, J. A. (1999), An analysis of ozonesonde data for the troposphere: Recommendations for testing 3-D models and development of a gridded climatology for tropospheric ozone, J. Geophys. Res., 104, 16,115 – 16,150.
Marsland, S. J., H. Haak, J. H. Jungclaus, M. Latif, and F. Ro¨ske (2003), The Max-Planck-Institute global ocean/sea ice model with orthogonal curvilinear coordinates, Ocean Modell. 5, pp. 91 – 127, Hooke Inst., Ox-ford Univ., OxOx-ford, England.
Mitchell, M. (1956), Visual range in the polar regions with particular re-ference to the Alaskan Arctic, J. Atmos. Terr. Phys., Spec. Suppl., 195 – 211.
Oltmans, S. J., et al. (1998), Trends of ozone in the troposphere, Geophys. Res. Lett., 25, 139 – 142.
Rahn, K. A., and R. J. McCaffrey (1979) Long-range transport of pollution aerosol to the Arctic: A problem without borders, papers presented at the WMO Symposium on the Long-Range Transport of Pollutants and its Relation to the General Circulation Including Stratospheric/Tropospheric Exchange Processes, Sofia, Bulgaria, 1 – 5 October .
Stevenson, D. S., et al. (2006), Multimodel ensemble simulations of present-day and near-future tropospheric ozone, J. Geophys. Res., 111, D08301, doi:10.1029/2005JD006338.
Stroeve, J. C., M. C. Serreze, F. Fetterer, T. Arbetter, W. Meier, J. Maslanik, and K. Knowles (2005), Tracking the Arctic’s shrinking ice cover: An-other extreme September minimum in 2004, Geophys. Res. Lett., 32, L04501, doi:10.1029/2004GL021810.
G. P. Brasseur, L. Emmons, P. Hess, J.-F. Lamarque, and S. Walters, National Center for Atmospheric Research, 1850 Table Mesa Drive, Boulder, CO 80305, USA.
C. Granier, Service d’Aeronomie/IPSL, Universite Pierre et Marie Curie, 4 Place Jussieu, F-75252 Paris, Cedex 05, France. ([email protected])
J. H. Jungclaus and U. Niemeier, Max Planck Institute for Meteorology, Bundesstraße 53, D-20146 Hamburg, Germany.