HAL Id: insu-03234573
https://hal-insu.archives-ouvertes.fr/insu-03234573
Submitted on 25 May 2021HAL is a multi-disciplinary open access archive for the deposit and dissemination of sci-entific research documents, whether they are pub-lished or not. The documents may come from teaching and research institutions in France or abroad, or from public or private research centers.
L’archive ouverte pluridisciplinaire HAL, est destinée au dépôt et à la diffusion de documents scientifiques de niveau recherche, publiés ou non, émanant des établissements d’enseignement et de recherche français ou étrangers, des laboratoires publics ou privés.
Flowpath controls on high-spatial-resolution
water-chemistry profiles in headwater streams
Rémi Dupas, Jean Causse, Anne Jaffrezic, Luc Aquilina, Patrick Durand
To cite this version:
Rémi Dupas, Jean Causse, Anne Jaffrezic, Luc Aquilina, Patrick Durand. Flowpath controls on high-spatial-resolution water-chemistry profiles in headwater streams. Hydrological Processes, Wiley, inPress, pp.e14247. �10.1002/hyp.14247�. �insu-03234573�
Dupas Rémi (Orcid ID: 0000-0002-5932-4056)
Flowpath controls on high-spatial-resolution water-chemistry profiles in
headwater streams
Rémi Dupas1, Jean Causse2, 3, Anne Jaffrezic1, Luc Aquilina4, Patrick Durand1
1INRAE - Institut Agro, UMR SAS, Rennes, France
2Société Transcender, Rennes, France
3EHESP - LERES, Rennes, France
4University of Rennes - CNRS, Géosciences Rennes, UMR 6118, Rennes, France
Corresponding author: Rémi Dupas ([email protected])
This article has been accepted for publication and undergone full peer review but has not been through the copyediting, typesetting, pagination and proofreading process which may lead to differences between this version and the Version of Record. Please cite this article as doi:
10.1002/hyp.14247
Abstract
Stream water chemistry is routinely measured over time at fixed and sparse sites, which provides a coarse image of spatial variability. Here, we measured nitrate, dissolved organic carbon (DOC) and several chemical proxies for water flowpaths, catchment residence time and biogeochemical transformations, every 50-100m along 13km of streams in six agricultural headwater catchments (1.1-3.5km²). The objective was to examine controls on longitudinal nitrate profiles at a high spatial resolution during four seasons: rewetting of the catchments in autumn, winter high-flow, spring recession and summer low-flow. Our results showed monotonic trends in longitudinal profiles for nitrate and DOC, which were opposite for the two solutes. Spatial trends in water chemistry profiles persisted across seasons, which suggests time-invariant controls on the spatial variations in concentrations. Four catchments exhibited decreasing nitrate and increasing DOC from upstream to downstream, while two catchments exhibited increasing nitrate and decreasing DOC. These smooth gradients did not reflect a longitudinal land-use gradient, but rather an increase in the proportion of groundwater inflows when moving downstream, as suggested by the chemical proxies and punctual discharge measurements. Water chemistry also changed abruptly at confluences, at a farm point source and at a localized groundwater inflow zone.
Keywords
1. Introduction
Stream chemistry reflects catchment properties such as the climate, topography, geology, soil, hydrology and land use, all of which vary across space (Lintern et al. 2018). These properties determine the presence of sources, the intensity of mobilization and delivery processes as well as biogeochemical transformations in- or near-stream (Haygarth et al. 2005). The nutrients nitrogen (N) and phosphorus (P) and dissolved organic carbon (DOC) have been particularly studied for their influence on aquatic food webs and, when in excess, their role in triggering anthropogenic eutrophication (Le Moal et al. 2019). Spatial approaches that consider many independent catchments and their attributes (Dupas et al. 2015a, Musolff et al. 2015, Frei et al. 2020) and temporal approaches that focus on long- to short-term concentration dynamics (Bieroza et al. 2018, Fovet et al. 2018, Guo et al. 2019) have been used to infer the main factors that control water chemistry. Among catchment attributes, dominant flowpaths and their temporal variability are major controls on spatial (Musolff et al. 2018) and temporal patterns (Barthold et al. 2011, Mellander et al. 2015, Hale and Godsey 2019) in water chemistry. Dominant flowpaths exert both direct and indirect influence on nutrient transfer at the catchment scale, since they influence the spatial distribution of intensive agriculture outside of waterlogged areas (indirect control) and control the convergence of fluxes in retention hotspots (direct control) (Thomas et al. 2016).
In recent years, the development of high-frequency monitoring techniques has improved the analysis of short-term variability in water chemistry, shedding light on the processes that control its dynamics during runoff events and diel variability (Kirchner et al. 2004, Rode et al. 2016, Burns et al. 2019). Spatial monitoring across river-networks has also been useful to reveal the spatial structure of chemistry in meso-scale catchments and its dominant controlling factors (Temnerud and Bishop 2005, Kamjunke et al. 2013, Zimmer et al. 2013). An interesting property of spatial water-chemistry patterns is their persistence over time despite temporal
variability in water chemistry, which suggests that few synoptic samplings are sufficient to determine areas with low and high concentrations (Abbott et al. 2018, Dupas et al. 2019, Shogren et al. 2019). Spatial water-chemistry patterns in river networks depend on local catchment attributes, mixing of fluxes from different tributaries and in-stream transformations (Fisher et al. 2004, Gooseff et al. 2008). Due to mixing processes, spatial variance in water chemistry decreases as catchment size increases, and variance thresholds indicate that the size of a landscape unit usually ranges from a few ha to several tens of km² (Temnerud and Bishop 2005, Zimmer et al. 2013, Abbott et al. 2018, Hale and Godsey 2019). Another consequence of mixing and transformation processes is that temporal variability in concentration also decreases when moving downstream river networks (Creed et al. 2015). High-spatial-resolution monitoring can reveal the fine structure of spatial water-chemistry patterns (Likens and Buso 2006). Geostatistical models such as semi-variograms are useful tools to determine the typical size of spatial patterns (i.e. small-scale patches vs large-scale trends) to infer the relative roles of in-stream processes vs landscape controls in shaping these patterns (Dent and Grimm 1999, Likens and Buso 2006, Peterson et al. 2006, McGuire et al. 2014, Floriancic et al. 2019, French et al. 2020).
Most of these studies, however, ignored the influence of the increasing contribution of groundwater inflows when moving downstream river networks (Konrad 2006, Tiwari et al. 2014). This increasing contribution may be particularly important to consider in low-order catchments, which are usually not “closed” systems (Liu et al. 2020). In this study, we performed high-resolution water-chemistry monitoring (defined here as > 10 points per km) in six first- or second-order streams to examine the relative influence of landscape and changing flowpaths on water-chemistry longitudinal profiles. The analysis focused mainly on nitrate because it was performed in an area where N-controlled marine eutrophication is the main environmental issue, but it adopted a multi-tracer approach that included multiple proxies for
water flowpaths, catchment residence time and biogeochemical transformations (Abbott et al. 2016). These proxies and punctual discharge measurement allowed us to describe the spatial structure of flowpaths along the stream profiles. The specific objectives were to 1) test the persistence of high-resolution water-chemistry profiles across seasons, 2) interpret the general shape of longitudinal profiles as a function of flowpaths and landscape controls in perennial streams and 3) investigate the controls of abrupt (or short-distance) changes in water chemistry along longitudinal profiles.
2. Materials and methods 2.1. Study sites
This study focused on six headwater catchments (1.1-3.5 km²) in the Brittany region, western France (Table 1). Three of them are located in the catchment area of the Lieue de Grève Bay (LdG1, LdG2, LdG3), and the other three are located in the catchment area of the Douarnenez Bay (Dz1, Dz2, Dz3), both of which are emblematic zones of nitrate-controlled coastal eutrophication (Smetacek and Zingone 2013). The climate, topography and geological properties of the studied headwaters are typical of the Brittany region: a temperate oceanic climate with a mean annual temperature of 12°C and annual rainfall of 800-1300 mm, relatively flat topography, geology dominated by igneous and metamorphic rocks (granite and schist) that results in a hydrology characterized by shallow aquifers, a high river density (1 km.km-2) and
hydromorphic soil that cover 10-20% of the land area (Frei et al. 2020). The six study headwaters were selected by local water-management syndicates according to different criteria: the Dz syndicate selected headwaters based on the high nitrate concentration at their outlets, while the LdG syndicate selected headwaters based on high expected spatial variability in nitrate concentration. Indeed, LdG1 and LdG2 are broadly classified as “granite”, but they actually consist of two distinct geological formations, with monzogranite, which favors the development of riparian wetlands, upstream and well-drained (naturally or because of tile
drainage) granodiorite downstream. The number of tributaries delivering into the main river stem ranged from one to four. In this study, we used the local definition of a riparian wetland: temporarily waterlogged soils that lead to visible hydromorphic features within the first 25 cm, with land use that can be grass and arable crop production or non-cultivated (Lemercier et al. 2012). Land use was derived from automatic classification of 20 m resolution Sentinel 2 satellite images taken during 2018 (Inglada et al. 2017). A 1:10,000 soil map obtained from local surveys and a 1:50,000 geologic map were obtained from Bureau de recherches
géologiques et minières (BRGM).
2.2. High-resolution water monitoring
We measured several water-chemistry parameters every 50-100m along the main river stem of each study catchment on four dates. Each catchment contained 19-53 monitoring points, yielding a total of 186 points during each of four monitoring campaigns. Field campaign 1 (20-26 Nov 2018) took place during autumn catchment rewetting, campaign 2 (7-23 Mar 2019) during winter high-flow, campaign 3 (17-26 Jun 2019) during spring recession and campaign 4 (18 Sep – 8 Oct 2019) during summer low-flow. This seasonal sampling aimed to cover different temperature and flow conditions, and we chose stable hydrological conditions not monitoring within three days after a major rainfall event (>5 mm.day-1). Since sampling 19-53
locations in a given catchment took 3-6 hours, 1-2 catchments could be sampled per day in a temporal window short enough to ignore the effects of diel variations in concentration. Each campaign was characterized by its weather conditions (mean temperature and daily rainfall for the three days before each monitoring date) using 8 km-resolution Météo France data, and discharge conditions from the nearest discharge monitoring station immediately downstream of our study sites: the Ris River (catchment area 36 km²) for the Dz catchments and the Yar River (catchment area 59km²) for the LdG catchments. We also measured water discharge at four locations within LdG1 and four locations within Dz1 in June 2019, using the salt-dilution
method in triplicate. The objective of these punctual discharge measurements was to confirm that the contribution of deeper groundwater flowpaths increased as we moving downstream.
We measured in-situ nitrate and DOC concentrations with a portable probe at all 186 sampling locations each of the four campaigns. Nitrate and DOC concentrations were determined from the 2nd derivative of measurements of a high-precision spectrometer developed by the French
startup Transcender (Causse et al. 2017, Causse and Thomas 2020). The determination of nitrate and DOC concentrations based on spectrometric data was previously calibrated with 49 freshwater samples from the Brittany region (Causse et al. 2017). We did not recalibrate this relationship with laboratory data for the present study but did re-evaluate it using another 225 and 207 samples for nitrate and DOC, respectively, analyzed with the portable spectrometer and in the laboratory.
We collected water samples for complementary analysis in the laboratory at 49 locations in headwaters LdG1 and Dz1 during all four campaigns. These complementary data (nitrate, DOC, dissolved inorganic carbon DIC, chloride Cl-, ammonium NH4+, nitrite NO2-, dissolved silica
DSi, sulfate SO42-, soluble reactive phosphorus SRP, total phosphorus TP and total nitrogen
TN) served as proxies for catchment residence time, flowpath and biogeochemical transformation (Abbott et al. 2016). All water samples were filtered in-situ immediately after sampling through cellulose acetate filters of 0.45 μm pore size for SRP and 0.20 μm pore size for the other solutes. All filters were rinsed with 20 ml deionized water in the laboratory prior to use, and with 10 ml stream water in the field. An unfiltered subsample was collected for the analysis of TP and TN. All samples were transported to the laboratory in a cooler and then refrigerated at 4°C until analysis within one week. SRP was determined colorimetrically by direct reaction with ammonium molybdate (Murphy and Riley 1962). The same method was used for TP but after digestion in acidic potassium persulfate. DOC and DIC were analyzed
with a total organic C analyzer (Shimadzu TOC-5050A; precision ±5%). Anions were measured by ion chromatography (DionexTMDX 100; precision ±2.5%).
Comparison of nitrate and DOC measurements from the laboratory and by the field spectrophotometer confirmed the good performance of the spectrophotometer (Figure S1). The root-mean-square error was 0.7 mg/l for nitrate and 1.5 mg/l for DOC, and the correlation coefficient was 0.99 for nitrate and 0.98 for DOC. The slightly lower performance for DOC than that for nitrate was expected because DOC encompasses a variety of organic molecules with different absorbance properties, unlike nitrate, which is a single ion.
2.3. Data analysis
The main objective was to describe and interpret longitudinal water-chemistry profiles along the main river stem of six headwaters during four contrasting seasons. First, we tested whether spatial trends in longitudinal profiles persisted across the four monitoring campaigns by calculating the stability index of Abbott et al (2018). The stability index equaled the mean of rank correlations between the six pairs of dates; a value close to 1 indicates that the shape of the water-chemistry profile is stable over time, despite possible shifts in concentration values. Second, we analyzed the general concentration gradient (increasing or decreasing from upstream to downstream) of nitrate and DOC in relation to land use, soil hydromorphy and geology. We also calculated correlations among water-chemistry parameters for each date in the two headwaters with complete monitoring (in situ and laboratory). Finally, we focused on two locations where nitrate concentration varied abruptly in the absence of a confluence to analyze the cause of these variations. Note that we present results in graphs rather than maps to respect European Union laws on data confidentiality.
3. Results
3.1. Hydro-meteorological conditions
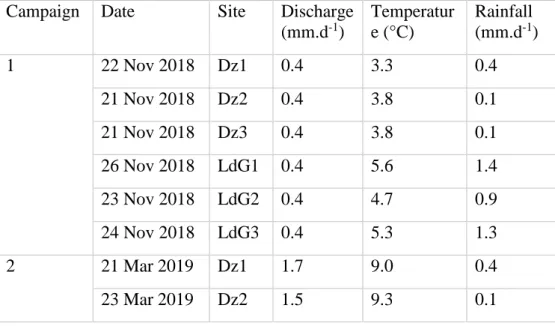
The four field campaigns were performed under stable hydrological conditions, i.e. with rainfall three days before sampling < 5 mm.day-1 except for campaign 4 in LdG1 and LdG2, which
received > 6 mm.day-1 (Table 2). Campaign 1 (Nov 2018) was the coldest (3.3-5.3°C), followed
by campaign 2 (Mar 2019, 8.5-9.3 °C) and campaigns 3 (June 2019) and 4 (Sept-Oct 2019), which had similar temperatures (13.4-20.1°C). Campaign 4 was the driest (0.2-0.4 mm.day-1
specific discharge), followed by campaign 1 (0.4 mm.day-1), campaign 3 (0.4-0.6 mm.day-1)
and campaign 2 (1.5-1.8 mm.day-1).
The five headwaters with a granite bedrock (Dz1, Dz2, LdG1, LdG2, LdG3) were permanently flowing throughout their stream length, while the headwater with a schist bedrock (Dz3) contracted in dried seasons. Spatial variability in water discharge within LdG1 and Dz1 showed an increase in specific discharge from upstream to downstream, with a visible stabilization in the most downstream section of Dz1 (Figure S2). We interpret these variations as an increasing contribution of deeper flowpaths when moving downstream, and we expected this spatial structuration of flowpath to influence longitudinal water-chemistry profiles.
3.2. Spatial stability of water chemistry profiles
The general shape of longitudinal water-chemistry profiles persisted across monitoring campaigns (e.g. nitrate, Fig. 1). From upstream to downstream, Dz1 exhibited a decreasing longitudinal gradient, while that of LdG1 was increasing. For these two headwaters, the nitrate stability index was 0.77 in Dz1 and 0.89 in LdG1. In addition, the rainy conditions during the fourth monitoring campaign in LdG1 did not seem to modify the profile shape observed during the other three campaigns.
All six headwaters exhibited longitudinal nitrate and DOC profiles that persisted across seasons (Figures S3 and S4). The stability index ranged from 0.57-0.99 for nitrate and 0.20-0.69 for DOC in all six headwaters (Table S1), and it ranged from 0.31- 0.91 for the other chemistry parameters in Dz1 and LdG1 (Table S2), meaning that the general shape of the water-chemistry profiles persisted across seasons. For this reason, and because several previous studies have discussed temporal variability across seasons in the study region (e.g. Guillemot et al., 2021), the following analyses focus on the mean concentration of the four dates.
3.3. A typology of longitudinal water-chemistry profiles
All three Dz catchments exhibited a decreasing concentration profile for nitrate and an increasing profile for DOC (Figure 2). Unlike for the other two Dz catchments, nitrate concentration profiles of Dz1 stabilized approximately 1700 m from the outlet (Figure 1). We observed a higher short-distance variability in Dz 3 than in the other two catchments, arguably because of the extremely shallow water level in the upstream section of this catchment, which may have influenced measurement (difficulty in fully submerging the probe without resuspending streambed sediments), and because of three tributaries that bring water with different concentrations to the main river stem. The opposite longitudinal profiles for nitrate and DOC concentrations resulted in significantly negative correlations between them in Dz1 and Dz2 (r=-0.70 and -0.93, p<0.05) and a non-significant correlation in Dz3 (Table S3). The correlation between nitrate concentration and percentage agricultural land use was negative in Dz1 and non-significant in Dz2 and Dz3. Similarly, the correlation between nitrate concentration and percentage wetland was negative in Dz1 and Dz 2 and non-significant in Dz3 (Table S3).
[Figure 2 near here]
The LdG catchments also exhibited opposite concentration profiles for nitrate and DOC concentrations (r=-0.69 to -0.90, p<0.05, Table S3) but in an opposite direction for LdG1 and
LdG2 compared to that of the Dz catchments (i.e., an increasing profile for nitrate and a decreasing profile for DOC). The LdG3 nitrate profile decreased in the first 500 m, like in the Dz catchments, and then slightly increased more downstream. Unlike in the Dz catchments, the correlation between nitrate concentration and percentage agricultural land use was positive in LdG2 and LdG3 but non-significant in LdG1 (Table S3). Like in two of the Dz catchments, the correlation between nitrate and percentage wetland was negative in the three LdG catchments. The correlation between percentage agriculture and percentage wetland was negative in only three of the catchments (LdG1, LdG2 and LdG3) and non-significant in the other three (Dz1, Dz2 and Dz3).
[Figure 3 near here]
In summary, both increasing and decreasing nitrate profiles exist. These nitrate profiles did not always follow those of land use, and they were opposite those of percentage wetland and DOC concentrations in five of the six catchments. The Dz3 catchment, where these general observations did not hold, is the only schist catchment, in which extremely low flows in the most upstream section may have influenced measurements. The opposite profile for nitrate and DOC concentrations held not only for spatial variability within a given catchment but also across catchments: Dz catchments generally had higher nitrate and lower DOC concentrations than the LdG catchments (Figure 4).
[Figure 4 near here]
In Dz1 and LdG1, which represent two archetypes of decreasing and increasing nitrate profiles, respectively, nearly all longitudinal profiles were opposite between both headwaters (Figure 5). Nitrate was negatively correlated with Cl-, DOC and DIC in both catchments, with SO42- and
DSi in Dz1 and TP and SRP in LdG1. Nitrate was positively correlated with TN, and nitrate constituted 100%±7% of TN in Dz and 69%±34% in LdG1. In addition, the longitudinal profile
of TN resembled that of nitrate in Dz1 (i.e. decreasing) but was nearly flat in LdG1 (Figures S4 and S5), which suggests the presence of organic N forms in the most upstream part of LdG1. We did not calculate correlations with NO2- or NH4+ because their concentrations lay below the
detection limit in 92% and 52% of the samples, respectively, in Dz1 and 67% and 33% of the samples, respectively, in LdG1.
[Figure 5 near here]
3.4. Abrupt variations in water chemistry along longitudinal profiles
At two specific locations, we observed abrupt variations in water chemistry in the absence of a tributary. In Dz1, approximately 1260 m from the outlet, a short-distance increase in nitrate
concentration (+3 mg.l-1) was accompanied by an increase in DOC, whereas DOC
concentration usually decreased when nitrate increased (Figure 1), and by an increase in NH4+
and SRP concentrations (Figure 6). A lack of change in DSi concentration indicated no change in the water flowpath (Figure S6). We interpret this abrupt variation as the result of a farm point source that delivered animal waste to the stream, although the delivery point could not be identified in the field (a farm with a manure storage tank was located near this measurement location).
In one tributary of LdG1, approximately 1000 m from the outlet, a short-distance increase in nitrate concentration (+20 mg.l-1) was accompanied by a decrease in DOC (-10 mg.l-1), which
is consistent with the general opposition between nitrate and DOC (Figure 4), and by a decrease in SRP and DSi concentrations. The NH4+ concentration remained near the detection limit. This
variation occurred at the transition between the upstream monzogranite lithology that favors development of riparian wetlands and the downstream granodiorite lithology that is well-drained (naturally or because of tile drainage). Discharge measured immediately upstream and downstream of the variation point (June 2019) increased from 1.1 l.s-1.km-2 to 2.9 l.s-1.km-2,
respectively. We interpret this variation as the result as a localized groundwater inflow point that brings nitrate-rich water and dilutes DOC, SRP and DSi.
[Figure 6 near here]
Other observed abrupt changes occurred at confluences with small tributaries (Figures 2 and 3).
4. Discussion
4.1. Consistencies and differences among water-chemistry concentration profiles
Stability indices greater than 0.5 for most constituents and catchments indicate that the general shape of water-chemistry concentration profiles persisted across seasons, and even following a rainfall event in LdG catchments. Previous studies have documented the stability of spatial water-chemistry patterns at the meso-scale (Abbott et al. 2018, Shogren et al. 2019) and at regional scales (Dupas et al. 2019). Our data show that this property of catchment systems also holds for spatial-resolution data, as also described by Likens & Buso (2006) with high-resolution data during two dates. The high stability of water-chemistry profiles suggests time-invariant controls on the spatial variability in concentrations. From an operational perspective, it means that few sampling dates are sufficient to identify areas with high or low concentrations, making possible the monitoring of a large number of spatially dense points at lower costs.
Longitudinal gradients in water-chemistry profiles were generally smooth and monotonic, with nitrate either decreasing in Dz1, Dz2, Dz3 and LdG 3 (albeit increasing slightly in the downstream part of LdG3) or increasing in LdG1 and LdG2. In all six catchments, the DOC concentration profiles were opposite to those of nitrate, as also observed in watercourses at different scales and in other aquatic ecosystems (Taylor and Townsend 2010). More complete analysis of eight other constituents, including reactive solutes and conservative elements (Cl-,
positive correlation with nitrate and DOC in two catchments selected as archetypes of a decreasing or increasing nitrate profile. These common relationships suggest common controls in both types of catchments (Abbott et al. 2016, Frei et al. 2020).
We observed a lack of positive relationship between N and P species in Dz1 and LdG1, except between N species and TP in Dz1 (Figure 5). This observation suggests that each nutrient originates from distinct sources and/or follows a different flowpath in the landscape, as also observed by Dupas et al. (2017). The higher P concentrations in the wet and DOC-rich upstream part of LdG1 confirm previous findings that riparian wetlands are potential P sources in baseflow conditions in agricultural landscapes (Dupas et al. 2015b, Gu et al. 2017). In Dz1, SRP variations were notably influenced by a farm point-source, suggesting that scattered point sources from leaky manure storage facilities or septic tanks can represent a hidden P source in agricultural landscapes (Withers et al. 2014).
4.2. Landscape and flowpath controls on water chemistry profiles
In four of the six catchments, profiles of nitrate concentration and agricultural land use did not show a significant positive correlation, although this relationship is commonly found in larger catchments in the study region (Casquin et al. 2020, Frei et al. 2020, Guillemot et al. 2021) and elsewhere (Nielsen et al. 2012). One possible reason for this lack of positive correlation is that land use alone is not sufficient to capture the spatial variability in N loading, since farming practices vary spatially (Durand et al. 2015). We observed, however, a negative correlation between nitrate and DOC concentration or percentage wetland soils in five of the six catchments. We also observed an increase in specific discharge with downstream distance in the two catchments it was measured. We therefore conclude that changing flowpaths along longitudinal profiles, with downstream sections receiving deeper groundwater than upstream sections, was a dominant control of nitrate and other constituents’ concentration profiles (Konrad 2006). Nonetheless, we cannot conclude that the spatial distribution of land use did
not play any role, since agricultural practices in wetland areas, such as the upstream part of LdG1 and LdG2, were likely to be less intensive than those in well-drained areas. The physical catchment properties that control water flowpaths in a catchment also influence the spatial distribution of land use; thus, flowpath is both a proximate and ultimate control of water-chemistry profiles (Thomas et al. 2016). We exclude in-stream transformation processes as a dominant control of longitudinal nitrate profiles because 1) both increasing and decreasing profiles exist and 2) the nitrate profile was significantly correlated with that of Cl-, a
conservative tracer in river networks. The latter interpretation differs from previous spatial sampling studies in mesoscale catchments where in-stream processes played a major role (Dent and Grimm 1999, McGuire et al. 2014) but is consistent with recent observation in the study region that in-stream processes produce more visible effects in high-order rivers than in headwaters (Casquin et al. 2020). Although most variations in water-chemistry profiles were smooth, abrupt changes also existed at confluences, a farm point-source and a localized groundwater inflow point (Konrad 2006, Hensley et al. 2020). We also observed erratic concentration variability in the most upstream section of two catchments (Dz3 and LdG1), arguably because their low water level and flow velocity make these locations more sensitive to local conditions, such as fractures in the bedrock or small pools in the stream, which are not represented in the regional maps used to characterize the landscape (Floriancic et al. 2019, Hensley et al. 2019).
High-resolution longitudinal profiles of water chemistry could represent an opportunity to analyze a catchment’s water flowpaths in details, enabling for example investigation of the respective roles of autotrophic denitrification (in deep flowpaths in the presence of pyrite) and heterotrophic denitrification (in shallow flowpaths in the presence of organic carbon) (Clément et al. 2003, Sabater et al. 2003, Pinay et al. 2015, Kolbe et al. 2019). In two of the catchments, proxies for water flowpaths, residence time and biogeochemical transformations can be
analyzed. DSi is an indicator of catchment residence time, with longer residence times corresponding to deeper groundwater flowpaths (Marcais et al. 2018), SO42- is a redox-sensitive
solute and a product of autotrophic denitrification (Ayraud et al. 2008, Aquilina et al. 2018) and DOC is also redox-sensitive and an indicator of shallow flowpaths (Abbott et al. 2016). In Dz1, all three DSi, SO42- and DOC increased as nitrate decreased, thus preventing a clear distinction
between autotrophic and heterotrophic denitrification; this conundrum is related to a change in a catchment geomorphology when moving downstream, with a concomitant increase in deeper flowpaths and the extent of riparian wetlands (Montreuil et al. 2010). In LdG1, less intensive agricultural activities in the wet, DOC-rich upstream section of the catchment, make it difficult to draw conclusion about denitrification processes. Despite the many proxies used in this study, ambiguities remained about the dominant controlling factors; thus, we suggest adding more specific and robust proxies in future studies, such as C, N and sulfur isotopes (Ayraud et al. 2008, Abbott et al. 2016).
4.3. Implications for catchment monitoring and management
This study shows that high-resolution water-chemistry profiles in headwaters were influenced primarily by water flowpaths. It would therefore be a mistake, when observing an increase in nitrate concentration in a stream, to conclude that the nearest field is necessarily its source, because nitrate fluxes can travel long distances, especially along fractures and at the transition between geological formations (Konrad 2006). Identifying a nitrate-rich groundwater inflow zone can, however, be useful for optimal placement of constructed buffer zones (Tournebize et al. 2017). We show that the use of complementary information in addition to nitrate, such as DOC, NH4+, Cl- or DSi measurements, can help identify when a variation in nitrate
concentration can be attributed to a source near the stream, such as leaky manure storage facilities or septic tanks (Withers et al. 2014). To identify diffuse nitrate sources at the field scale, we recommend supplementing stream monitoring at the outlet of 2nd-order
sub-catchments to identify source sub-sub-catchments, with an environmental assessment of the nutrient management of individual farms in those sub-catchments.
Acknowledgements
This study was supported by the Région Bretagne, Agence de l’eau Loire Bretagne and Programme des interventions territoriales de l'État. We thank EPAB (Etablissement public de gestion et d’aménagement de la baie de Douarnenez) and Lannion-Trégor Communauté for their support, and Quentin Duval, Pierre Rendu, Antoine Casquin, Patrice Petitjean, Laurence Carteaux and Yannick Fauvel, who helped with the field and lab work.
Data availability
All data used in this article is available through
http://www.hydroshare.org/resource/173875a936f14c22a5ba19c721adfb86
JC manages a private company that sells the high-resolution mapping service used in this study.
References
Abbott, B. W., V. Baranov, C. Mendoza-Lera, M. Nikolakopoulou, A. Harjung, T. Kolbe, M. N. Balasubramanian, T. N. Vaessen, F. Ciocca, A. Campeau, M. B. Wallin, P. Romeijn, M. Antonelli, J. Goncalves, T. Datry, A. M. Laverman, J. R. de Dreuzy, D. M. Hannah, S. Krause, C. Oldham, and G. Pinay. 2016. Using multi-tracer inference to move beyond single-catchment ecohydrology. Earth-Science Reviews 160:19-42.
Abbott, B. W., G. Gruau, J. P. Zarnetske, F. Moatar, L. Barbe, Z. Thomas, O. Fovet, T. Kolbe, S. Gu, A. C. Pierson-Wickmann, P. Davy, and G. Pinay. 2018. Unexpected spatial stability of water chemistry in headwater stream networks. Ecology Letters 21:296-308.
Aquilina, L., C. Roques, A. Boisson, V. Vergnaud-Ayraud, T. Labasque, H. Pauwels, E. Petelet-Giraud, M. Pettenati, A. Dufresne, L. Bethencourt, and O. Bour. 2018. Autotrophic denitrification supported by biotite dissolution in crystalline aquifers (1): New insights from short-term batch experiments. Science of the Total Environment 619:842-853.
Ayraud, V., L. Aquilina, T. Labasque, H. Pauwels, J. Molenat, A. C. Pierson-Wickmann, V. Durand, O. Bour, C. Tarits, P. Le Corre, E. Fourre, P. Merot, and P. Davy. 2008. Compartmentalization of physical and chemical properties in hard-rock aquifers deduced from chemical and groundwater age analyses. Applied Geochemistry 23:2686-2707.
Barthold, F. K., Tyralla, C., Schneider, K., Vache, K. B., Frede, H. G., and Breuer, L. (2011). How many tracers do we need for end member mixing analysis (EMMA)? a sensitivity analysis. Water Resour. Res. 47, 1–14.
Bieroza, M. Z., A. L. Heathwaite, M. Bechmann, K. Kyllmar, and P. Jordan. 2018. The concentration-discharge slope as a tool for water quality management. Science of the Total Environment 630:738-749.
Burns, D. A., B. A. Pellerin, M. P. Miller, P. D. Capel, A. J. Tesoriero, and J. M. Duncan. 2019. Monitoring the riverine pulse: Applying high-frequency nitrate data to advance integrative understanding of biogeochemical and hydrological processes. Wiley Interdisciplinary Reviews-Water 6. Casquin, A., S. Gu, R. Dupas, P. Petitjean, G. Gruau, and P. Durand. 2020. River network alteration of
C-N-P dynamics in a mesoscale agricultural catchment. Science of the Total Environment 749. Causse, J., and O. Thomas. 2020. Intérêt de la mesure de la qualité des cours d’eau à très haute
résolution pour une meilleure gestion des bassins versants. Technique Sciences et Méthodes April:13-20.
Causse, J., O. Thomas, A. V. Jung, and M. F. Thomas. 2017. Direct DOC and nitrate determination in water using dual pathlength and second derivative UV spectrophotometry. Water Research 108:312-319.
Clément, J.-C., L. Aquilina, O. Bour, K. Plaine, T. P. Burt, and G. Pinay. 2003. Hydrological flowpaths and nitrate removal rates within a riparian floodplain along a fourth-order stream in Brittany (France). Hydrological Processes 17:1177-1195.
Creed, I. F., D. M. McKnight, B. A. Pellerin, M. B. Green, B. A. Bergamaschi, G. R. Aiken, D. A. Burns, S. E. G. Findlay, J. B. Shanley, R. G. Striegl, B. T. Aulenbach, D. W. Clow, H. Laudon, B. L. McGlynn, K. J. McGuire, R. A. Smith, and S. M. Stackpoole. 2015. The river as a chemostat: fresh perspectives on dissolved organic matter flowing down the river continuum. Canadian Journal of Fisheries and Aquatic Sciences 72:1272-1285.
Dent, C. L., and N. B. Grimm. 1999. Spatial heterogeneity of stream water nutrient concentrations over successional time. Ecology 80:2283-2298.
Dupas, R., M. Delmas, J. M. Dorioz, J. Garnier, F. Moatar, and C. Gascuel-Odoux. 2015a. Assessing the impact of agricultural pressures on N and P loads and eutrophication risk. Ecological Indicators 48:396–407.
Dupas, R., G. Gruau, S. Gu, G. Humbert, A. Jaffrezic, and C. Gascuel-Odoux. 2015b. Groundwater control of biogeochemical processes causing phosphorus release from riparian wetlands. Water Research 84:307-314.
Dupas, R., P. E. Mellander, C. Gascuel-Odoux, O. Fovet, E. B. McAleer, N. McDonald, M. Shore, and P. Jordan. 2017. The role of mobilisation and delivery processes on contrasting dissolved nitrogen and phosphorus exports in groundwater fed catchments. Science of the Total Environment:1275–1287.
Dupas, R., C. Minaudo, and B. W. Abbott. 2019. Stability of spatial patterns in water chemistry across temperate ecoregions. Environmental Research Letters.
Durand, P., P. Moreau, J. Salmon-Monviola, L. Ruiz, F. Vertes, and C. Gascuel-Odoux. 2015. Modelling the interplay between nitrogen cycling processes and mitigation options in farming catchments. Journal of Agricultural Science 153:959-974.
Fisher, S. G., R. A. Sponseller, and J. B. Heffernan. 2004. Horizons in stream biogeochemistry: Flowpaths to progress. Ecology 85:2369-2379.
Floriancic, M. G., B. M. C. Fischer, P. Molnar, J. W. Kirchner, and I. H. J. van Meerveld. 2019. Spatial variability in specific discharge and streamwater chemistry during low flows: Results from snapshot sampling campaigns in eleven Swiss catchments. Hydrological Processes 33:2847-2866.
Fovet, O., G. Humbert, R. Dupas, C. Gascuel-Odoux, G. Gruau, A. Jaffrezic, G. Thelusma, M. Faucheux, N. Gilliet, Y. Hamon, and C. Grimaldi. 2018. Seasonal variability of stream water quality response to storm events captured using high-frequency and multi-parameter data. Journal of Hydrology 559:282-293.
Frei, R. J., B. W. Abbott, R. Dupas, S. Gu, G. Gruau, Z. Thomas, T. Kolbe, L. Aquilina, T. Labasque, A. M. Laverman, O. Fovet, F. Moatar, and G. Pinay. 2020. Predicting Nutrient Incontinence in the Anthropocene at Watershed Scales. Frontiers in Environmental Sciences 7:200.
French, D. W., D. E. Schindler, S. R. Brennan, and D. Whited. 2020. Headwater catchments govern biogeochemistry in America’s largest free-flowing river network. Journal of Geophysical Research: Biogeosciences.
Gooseff, M. N., K. E. Bencala, and S. M. Wondzell. 2008. Solute Transport Along Stream and River Networks.395-417.
Gu, S., G. Gruau, R. Dupas, C. Rumpel, A. Crème, O. Fovet, C. Gascuel-Odoux, G. Humbert, and P. Petitjean. 2017. Release of dissolved phosphorus from riparian wetlands: evidence for complex interactions among hydroclimate variability, topography and soil properties. Science of the Total Environment:421–431.
Guillemot, S., O. Fovet, C. Gascuel-Odoux, G. Gruau, A. Casquin, F. Curie, C. Minaudo, L. Strohmenger, and F. Moatar. 2021. Spatio-temporal controls of C-N-P dynamics across headwater catchments of a temperate agricultural region from public data analysis. HESSD.
Guo, D., A. Lintern, J. A. Webb, D. Ryu, S. Liu, U. Bende-Michl, P. Leahy, P. Wilson, and A. W. Western. 2019. Key Factors Affecting Temporal Variability in Stream Water Quality. Water Resources Research 55:112-129.
Hale, R. L., and S. E. Godsey. 2019. Dynamic stream network intermittence explains emergent dissolved organic carbon chemostasis in headwaters. Hydrological Processes 33:1926-1936.
Haygarth, P. M., L. M. Condron, A. L. Heathwaite, B. L. Turner, and G. P. Harris. 2005. The phosphorus transfer continuum: Linking source to impact with an interdisciplinary and multi-scaled approach. Science of the Total Environment 344:5-14.
Hensley, R.T., L. Kirk, M. Spangler, M.N. Gooseff, M.J. Cohen. Flow Extremes as Spatiotemporal Control Points on River Solute Fluxes and Metabolism. Journal of Geophysical Research-Biogeosciences 2019; 124: 537-555.
Hensley, R. T., M. J. Spangler, L. F. DeVito, P. H. Decker, M. J. Cohen, and M. N. Gooseff. 2020. Evaluating spatiotemporal variation in water chemistry of the upper Colorado River using longitudinal profiling. Hydrological Processes 34:1782-1793.
Inglada, J., A. Vincent, M. Arias, B. Tardy, D. Morin, and I. Rodes. 2017. Operational High Resolution Land Cover Map Production at the Country Scale Using Satellite Image Time Series. Remote Sensing 9.
Kamjunke, N., O. Buettner, C. G. Jaeger, H. Marcus, W. von Tuempling, S. Halbedel, H. Norf, M. Brauns, M. Baborowski, R. Wild, D. Borchardt, and M. Weitere. 2013. Biogeochemical patterns in a river network along a land use gradient. Environmental Monitoring and Assessment 185:9221-9236.
Kirchner, J. W., X. H. Feng, C. Neal, and A. J. Robson. 2004. The fine structure of water-quality dynamics: the (high-frequency) wave of the future. Hydrological Processes 18:1353-1359.
Kolbe, T., J. R. de Dreuzy, B. W. Abbott, L. Aquilina, T. Babey, C. T. Green, J. H. Fleckenstein, T. Labasque, A. M. Laverman, J. Marcais, S. Peiffer, Z. Thomas, and G. Pinay. 2019. Stratification of reactivity determines nitrate removal in groundwater. Proceedings of the National Academy of Sciences of the United States of America 116:2494-2499.
Konrad, C. P. 2006. Location and timing of river-aquifer exchanges in six tributaries to the Columbia River in the Pacific Northwest of the United States. Journal of Hydrology 329:444-470.
Le Moal, M., C. Gascuel-Odoux, A. Ménesguen, Y. Souchon, C. Etrillard, A. Levain, F. Moatar, A. Pannard, P. Souchu, A. Lefebvre, and G. Pinay. 2019. Eutrophication: A new wine in an old bottle. Science of the Total Environment 651:1-11.
Lemercier, B., M. Lacoste, M. Loum, and C. Walter. 2012. Extrapolation at regional scale of local soil knowledge using boosted classification trees: A two-step approach. Geoderma 171:75-84. Likens, G. E., and D. C. Buso. 2006. Variation in streamwater chemistry throughout the Hubbard Brook
Valley. Biogeochemistry 78:1-30.
Lintern, A., J. A. Webb, D. Ryu, S. Liu, U. Bende-Michl, D. Waters, P. Leahy, P. Wilson, and A. W. Western. 2018. Key factors influencing differences in stream water quality across space. Wiley Interdisciplinary Reviews-Water 5.
Liu, Y., T. Wagener, H. E. Beck, and A. Hartmann. 2020. What is the hydrologically effective area of a catchment? Environmental Research Letters 15.
Marcais, J., A. Gauvain, T. Labasque, B. W. Abbott, G. Pinay, L. Aquilina, F. Chabaux, D. Viville, and J. R. de Dreuzy. 2018. Dating groundwater with dissolved silica and CFC concentrations in crystalline aquifers. Science of the Total Environment 636:260-272.
McGuire, K. J., C. E. Torgersen, G. E. Likens, D. C. Buso, W. H. Lowe, and S. W. Bailey. 2014. Network analysis reveals multiscale controls on streamwater chemistry. Proceedings of the National Academy of Sciences of the United States of America 111:7030-7035.
Mellander, P. E., P. Jordan, M. Shore, A. R. Melland, and G. Shortle. 2015. Flow paths and phosphorus transfer pathways in two agricultural streams with contrasting flow controls. Hydrological Processes 29:3504-3518.
Montreuil, O., P. Merot, and P. Marmonier. 2010. Estimation of nitrate removal by riparian wetlands and streams in agricultural catchments: effect of discharge and stream order. Freshwater Biology 55:2305-2318.
Murphy, J., and J. P. Riley. 1962. A modified single solution method for the determination of phosphate in natural waters. Anal. Chim. Acta 27:31-36.
Musolff, A., J. H. Fleckenstein, M. Opitz, O. Buttner, R. Kumar, and J. Tittel. 2018. Spatio-temporal controls of dissolved organic carbon stream water concentrations. Journal of Hydrology 566:205-215.
Musolff, A., C. Schmidt, B. Selle, and J. H. Fleckenstein. 2015. Catchment controls on solute export. Advances in Water Resources 86:133-146.
Nielsen, A., D. Trolle, M. Sondergaard, T. L. Lauridsen, R. Bjerring, J. E. Olesen, and E. Jeppesen. 2012. Watershed land use effects on lake water quality in Denmark. Ecological Applications 22:1187-1200.
Peterson, E. E., A. A. Merton, D. M. Theobald, and N. S. Urquhart. 2006. Patterns of spatial autocorrelation in stream water chemistry. Environmental Monitoring and Assessment 121:571-596.
Pinay, G., S. Peiffer, J. R. De Dreuzy, S. Krause, D. M. Hannah, J. H. Fleckenstein, M. Sebilo, K. Bishop, and L. Hubert-Moy. 2015. Upscaling Nitrogen Removal Capacity from Local Hotspots to Low Stream Orders' Drainage Basins. Ecosystems 18:1101-1120.
Rode, M., A. J. Wade, M. J. Cohen, R. T. Hensley, M. J. Bowes, J. W. Kirchner, G. B. Arhonditsis, P. Jordan, B. Kronvang, S. J. Halliday, R. A. Skeffington, J. C. Rozemeijer, A. H. Aubert, K. Rinke, and S. Jomaa. 2016. Sensors in the Stream: The High-Frequency Wave of the Present. Environmental Science & Technology 50:10297-10307.
Sabater, S., A. Butturini, J. C. Clement, T. Burt, D. Dowrick, M. Hefting, V. Maitre, G. Pinay, C. Postolache, M. Rzepecki, and F. Sabater. 2003. Nitrogen removal by riparian buffers along a European climatic gradient: Patterns and factors of variation. Ecosystems 6:20-30.
Shogren, A. J., J. P. Zarnetske, B. W. Abbott, F. Iannucci, R. J. Frei, N. A. Griffin, and W. B. Bowden. 2019. Revealing biogeochemical signatures of Arctic landscapes with river chemistry. Scientific Reports 9.
Smetacek, V., and A. Zingone. 2013. Green and golden seaweed tides on the rise. Nature 504:84-88. Taylor, P. G., and A. R. Townsend. 2010. Stoichiometric control of organic carbon-nitrate relationships
from soils to the sea. Nature 464:1178-1181.
Temnerud, J., and K. Bishop. 2005. Spatial variation of streamwater chemistry in two Swedish boreal catchments: Implications for environmental assessment. Environmental Science & Technology 39:1463-1469.
Thomas, Z., B. Abbott, O. Troccaz, J. Baudry, and G. Pinay. 2016. Proximate and ultimate controls on carbon and nutrient dynamics of small agricultural catchments. Biogeosciences 13:1863-1875. Tiwari, T., H. Laudon, K. Beven, and A. M. Agren. 2014. Downstream changes in DOC: Inferring
contributions in the face of model uncertainties. Water Resources Research 50:514-525. Tournebize, J., C. Chaumont, and U. Mander. 2017. Implications for constructed wetlands to mitigate
nitrate and pesticide pollution in agricultural drained watersheds. Ecological Engineering 103:415-425.
Withers, P. J. A., P. Jordan, L. May, H. P. Jarvie, and N. E. Deal. 2014. Do septic tank systems pose a hidden threat to water quality? Frontiers in Ecology and the Environment 12:123-130.
Zimmer, M. A., S. W. Bailey, K. J. McGuire, and T. D. Bullen. 2013. Fine scale variations of surface water chemistry in an ephemeral to perennial drainage network. Hydrological Processes 27:3438-3451.
Tables
Table 1. Characteristics of the six study headwaters catchments. Land-use information was derived from Centre d’Etudes Spatiales de la Biosphère (CESBIO 2018), geology from Bureau
de Recherches Géologiques et Minières (BRGM 2019), and elevation from Institut national de l'information géographique et forestière (IGN 2019).
Catchment Parent materia l Surface area (km²) Elevatio n (m above sea level) Agricu ltural land use (%) Arable land use (%) Riparian wetland s (%) Samplin g points Dz1 Granite 2.5 36-110 85.0 48.3 5.3 53 Dz2 Granite 1.1 17-77 79.8 37 5.7 19 Dz3 Schist 3.5 13-63 82.8 59.2 3.9 29 LdG1 Granite 2.9 76-108 80.1 31.6 16.8 23 LdG2 Granite 2.2 82-118 77.8 38.6 19.4 29 LdG3 Granite 2.2 141-159 70.7 25.5 11.4 33
Table 2. Mean discharge, air temperature and rainfall three days before each sampling date in the Douarnenez (Dz) and Lieue de Grève (LdG) catchments. Data : Météo France, 8 km resolution.
Campaign Date Site Discharge
(mm.d-1) Temperatur e (°C) Rainfall (mm.d-1) 1 22 Nov 2018 Dz1 0.4 3.3 0.4 21 Nov 2018 Dz2 0.4 3.8 0.1 21 Nov 2018 Dz3 0.4 3.8 0.1 26 Nov 2018 LdG1 0.4 5.6 1.4 23 Nov 2018 LdG2 0.4 4.7 0.9 24 Nov 2018 LdG3 0.4 5.3 1.3 2 21 Mar 2019 Dz1 1.7 9.0 0.4 23 Mar 2019 Dz2 1.5 9.3 0.1
23 Mar 2019 Dz3 1.5 9.3 0.1 07 Mar 2019 LdG1 1.8 9.1 3.6 08 Mar 2019 LdG2 1.8 8.5 3.5 09 Mar 2019 LdG3 1.7 8.5 3.0 3 19 Jun 2019 Dz1 0.5 14.9 2.8 18 Jun 2019 Dz2 0.6 15.1 3.0 18 Jun 2019 Dz3 0.6 15.1 3.0 27 Jun 2019 LdG1 0.5 18.7 0.4 28 Jun 2019 LdG2 0.4 20.1 0.1 26 Jun 2019 LdG3 0.5 17.0 2.5 4 20 Sep 2019 Dz1 0.2 15.0 0.0 19 Sep 2019 Dz2 0.2 15.0 0.1 19 Sep 2019 Dz3 0.2 15.0 0.1 08 Oct 2019 LdG1 0.4 13.4 6.5 07 Oct 2019 LdG2 0.3 13.9 6.6 06 Oct 2019 LdG3 0.3 14.3 3.1 Figure legends
Figure 1. Longitudinal nitrate profiles in Douarnenez 1 and Lieue de Grève 1 catchments. Gray vertical lines represent tributaries; the outlet lies on the right.
Figure 2. Mean nitrate (NO3-) and dissolved organic carbon (DOC) longitudinal profiles, and
percentages of agricultural land use and wetland in Douarnenez catchments. Douarnenez 1 is represented upstream of a farm point source. Gray vertical lines represent tributaries; the outlet lies on the right.
Figure 3. Mean nitrate (NO3-) and dissolved organic carbon (DOC) longitudinal profiles, and
percentages of agricultural land use and wetland in Lieue de Grève catchments. Gray vertical lines represent tributaries; the outlet lies on the right.
Figure 4. Relationship between nitrate (NO3-) and dissolved organic carbon (DOC)
concentrations in the six study catchments and on four campaigns.
Figure 5. Correlations between water-chemistry parameters measured in the laboratory in the Douarnenez 1 and Lieue de Grève 1 catchments. Crossed-out correlations are non-significant (p>0.05).
Figure 6. Focus on abrupt variations in water chemistry as influenced by a point source in the main river of Douarnenez 1 (1260 m from the outlet) and by a groundwater inflow point in one tributary of Lieue de Grève 1 (1000 m from the outlet).