HAL Id: hal-00302258
https://hal.archives-ouvertes.fr/hal-00302258
Submitted on 1 Jan 2003
HAL is a multi-disciplinary open access
archive for the deposit and dissemination of
sci-entific research documents, whether they are
pub-lished or not. The documents may come from
teaching and research institutions in France or
abroad, or from public or private research centers.
L’archive ouverte pluridisciplinaire HAL, est
destinée au dépôt et à la diffusion de documents
scientifiques de niveau recherche, publiés ou non,
émanant des établissements d’enseignement et de
recherche français ou étrangers, des laboratoires
publics ou privés.
electromagnetic way in which the critical regime is
reached as the rupture approaches
P. G. Kapiris, K. A. Eftaxias, K. D. Nomikos, J. Polygiannakis, E. Dologlou,
G. T. Balasis, N. G. Bogris, A. S. Peratzakis, V. E. Hadjicontis
To cite this version:
P. G. Kapiris, K. A. Eftaxias, K. D. Nomikos, J. Polygiannakis, E. Dologlou, et al.. Evolving towards
a critical point: A possible electromagnetic way in which the critical regime is reached as the rupture
approaches. Nonlinear Processes in Geophysics, European Geosciences Union (EGU), 2003, 10 (6),
pp.511-524. �hal-00302258�
Nonlinear Processes
in Geophysics
© European Geosciences Union 2003
Evolving towards a critical point: A possible electromagnetic way in
which the critical regime is reached as the rupture approaches
P. G. Kapiris1, K. A. Eftaxias1, K. D. Nomikos2, J. Polygiannakis1, E. Dologlou1, G. T. Balasis3, N. G. Bogris1,
A. S. Peratzakis1, and V. E. Hadjicontis1
1Solid State Section, Physics Department, University of Athens, Greece 2Technological Educational Institute of Athens, Greece
3GeoForschungsZentrum Telegrafenberg, Potsdam, Germany
Received: 13 November 2002 – Revised: 15 April 2003 – Accepted: 29 April 2003
Abstract. In analogy to the study of critical phase
transi-tions in statistical physics, it has been argued recently that the fracture of heterogeneous materials could be viewed as a critical phenomenon, either at laboratory or at geophysi-cal sgeophysi-cales. If the picture of the development of the fracture is correct one may guess that the precursors may reveal the critical approach of the main-shock. When a heterogeneous material is stretched, its evolution towards breaking is char-acterized by the appearance of microcracks before the final break-up. Microcracks produce both acoustic and electro-magnetic (EM) emission in the frequency range from VLF to VHF. The microcracks and the associated acoustic and EM activities constitute the so-called precursors of general fracture. These precursors are detectable not only at labora-tory but also at geophysical scales. VLF and VHF acoustic and EM emissions have been reported resulting from vol-canic and seismic activities in various geologically distinct regions of the world. In the present work we attempt to es-tablish the hypothesis that the evolution of the Earth’s crust towards the critical point takes place not only in a mechan-ical but also in an electromagnetic sense. In other words, we focus on the possible electromagnetic criticality, which is reached while the catastrophic rupture in the Earth’s crust ap-proaches. Our main tool is the monitoring of micro-fractures that occur before the final breakup, by recording their radio-electromagnetic emissions. We show that the spectral power law analysis of the electromagnetic precursors reveals distin-guishing signatures of underlying critical dynamics, such as: (i) the emergence of memory effects; (ii) the decrease with time of the anti-persistence behaviour; (iii) the presence of persistence properties in the tail of the sequence of the pre-cursors; and (iv) the acceleration of the precursory electro-magnetic energy release. Moreover, the statistical analysis of the amplitudes of the electromagnetic fluctuations reveals the breaking of the symmetry as the theory predicts. Finally, we try to answer the question: how universal the observed
Correspondence to: K. A. Eftaxias ([email protected])
electromagnetic critical behaviour of the failing system is?
1 Introduction
Fracture in heterogeneous systems has been an area of active study in recent years due to its relevance with practical engi-neering materials such as poly-crystals and fiber composites, biological materials such as bone, and possibly geological systems such as Earthquake faults. Despite great experimen-tal and numerical efforts, many aspects still remain unclear. In the case of Earthquake the problem becomes more com-plex, because the source volume inside the Earth is inacces-sible to direct observation and therefore the most important parameter, the stress level, cannot be measured.
In analogy to the study of critical phase transitions in sta-tistical physics, it has been recently argued that the frac-ture of heterogeneous materials could be viewed as a critical phenomenon (Herrmann and Roux, 1990; Vanneste and Sor-nette, 1992; Lamaignere et al., 1996; Andersen et al., 1997; Sornette, 2000), either at laboratory scale (Petri et al., 1994; Guarino et al., 1998, 2002) or at geophysical scales (Che-lidze, 1982; Allegre et al., 1982; Sornette and Sornette, 1990; Diodati et al., 1991; Sornette and Sammis, 1995; Saleur et al., 1996a,b; Main, 1996; Bowman et al., 1998; Kossobokov et al., 1999). This result comes from different observations including power law scaling in space (fractals), time and en-ergy, long-range correlations, or the divergence of the rate of energy dissipation near the critical point. Fractals are criti-cal features in the sense that they are not associated to any characteristic scale (Schmittbuhl et al., 1995; Lesne, 1996). Therefore, the numerous evidence from fractal geometry in the fracturing and fragmentation of rocks suggest an inter-pretation of these processes as critical phenomena.
If the critical picture of the development of a large Earth-quake is correct, then one may guess that its precursors may indicate the critical approach of the main-shock. When a
het-erogeneous material is stretched its evolution towards break-ing is characterized by the appearance of microcracks be-fore the final break-up. Microcracks produce both an acous-tic and an electromagneacous-tic (EM) emission in the frequency range from VLF to VHF (Gross et al., 1993; Carrilo et al., 1998; Mavromatou and Hadjicontis, 2001). The microcracks and the associated acoustic and EM activities constitute the so-called precursors of general fracture. These precursors are detectable not only at laboratory but also at geophysical scales. VLF and VHF acoustic and EM emissions have been reported resulting from volcanic and seismic activities in var-ious geologically distinct regions of the world (Diodati et al., 1991; Fujinawa and Takahashi, 1994; Fujinawa et al., 1997; Eftaxias et al., 2001a, 2002a).
In the present work we focus on the possible electromag-netic criticality, which is reached as the catastrophic rupture in the Earth’s crust approaches. Our main tool is the moni-toring of micro-fractures that occurs before the final breakup, by recording their radio-electromagnetic emissions during the last tens of hours prior to the main shock (Nomikos and Vallianatos, 1998; Vallianatos and Nomikos, 1998; Eftaxias et al., 2000, 2001a, 2002a). The observed precursory EM fluctuations might represent EM signatures of the energy re-arrangements that occur as the external field drives the het-erogeneous system of the pre-focal area from one meta-stable local free-energy minimum to another.
For the above mentioned purpose, we focus on ULF, VLF, and VHF EM activities observed before the 13 May 1995 Kozani-Grevena (K-G) Earthquake in northwestern Greece (40.2◦N–21.7◦E) with Ms(ATH) = 6.6, at Zante station (37.76◦N–20.76◦E) in western Greece. The basic
argu-ments for this choice are: (i) This is probably the first time that precursors covering ULF, VLF and VHF bands were de-tected all together, for the same Earthquake at only one ob-servation site and within the time-window of the last tens of hours prior to the main event. This experimental evidence helps to specify not only whether or not a single ULF, VLF or VHF electromagnetic disturbance is pre-seismic by itself, but also whether a combination of such disturbances at dif-ferent frequency bands, could be characterized as pre-failure. Hence, in previous papers, we have shown that the evolutions of the sequence of the observed radio-emissions reveals sim-ilarities to that observed in laboratory acoustic and electro-magnetic emissions during the last stages of failure prepara-tion process in rocks (Eftaxias et al., 2002a). (ii) We have also shown that features of these precursors are possibly cor-related with the corresponding fault model and with the de-gree of heterogeneity within the focal area (Eftaxias et al., 2000, 2001a). (iii) The VHF emission has a rather long du-ration, i.e. approximately a few tens of hours (the data were sampled at 1 Hz), thus, it provides sufficient data for statis-tical analysis. (iv) The scale of the fracture zone during the preparation stage of a significant EQ may be extended up to several kilometers. In the case of a significant surface Earth-quake, such as the K-G EarthEarth-quake, the hypothesis that the associated fracture zone is extended up to the ground surface can be accepted. Notice that an outstanding feature of the
K-G surface Earthquake was the clearly observed fault traces of 8–12 km length (Meyer et al., 1998). This surface rupture is the confirmation that the highly stressed region reached the ground surface. This fact could support the consideration that the detected VLF and VHF signals may have emitted from fracto-electromagnetic emitters activated in the ground surface layer of the K-G Earthquake preparation zone.
More precisely, electromagnetic fluctuations before the K-G Earthquake at Zante station were observed as follows: (i) a few tens of hours prior to the Kozani-Grevena Earth-quake at 41 MHz and 54 MHz respectively, with increasing electromagnetic emission rate (Fig. 1a). These bursts ceased approximately one hour before the Earthquake occurrence; (ii) very strong multi-peaked electromagnetic signals with sharp onsets and ends at 3 kHz and 10 kHz, lasting about half hour, emerged approximately one and half hour before the Earthquake (Fig. 1b) (Eftaxias et al., 2000); (iii) if some-one follows the diurnal background pattern of the DC-ULF recordings finds the existence of a minimum around mid-day (Fig. 1c). However, as the Earthquake approaches this be-haviour seems to change and a maximum instead of a mini-mum now is seen one day before the EQ. The curve attains its normal shape a few days after the event.
2 An approach based on the criticality concepts
In this section we attempt to establish the hypothesis that the evolution of the Earth’s crust towards critical state takes place not only in a seismological but also in a VLF-VHF electro-magnetic sense.
We focus on the study of the time-series of the amplitude
A(ti)of the recorded VHF pre-failure electromagnetic
fluc-tuations. One distinguishing feature of the dynamics of a heterogeneous medium close to a critical point lies in the emergence of memory effects. The power spectrum density (PSD) S(f ) is probably the most commonly used technique to provide useful information about the inherent memory of the system. Although the power spectrum is only the lowest order statistical measure of the deviations of the random den-sity field from homogeneity, it directly reflects the physical scales of the processes that affect structure formation. If the recorded time-series A(ti)is a temporal fractal then a power
law spectrum is expected:
S(f ) = α · f−β (1)
where f is the frequency of the transform. In a log S(f ) − log f representation the power spectrum is a straight line, with linear spectral slope β. The spectral am-plification α quantifies the power of the spectral components following the power spectral density law.
Applying the least square method, we calculated the spec-tral slope β, the specspec-tral amplification α, and the linear corre-lation coefficient r of the power law fit. The “global wavelet spectrum” is used in order to provide an unbiased and consis-tent estimation of the true power spectrum of the time-series
00:00 04:00 08:00 12:00 16:00 20:00 00:00 41Mhz 54Mhz 11−May−1995 300 (mV) 300 (mV) 00:00 04:00 08:00 12:00 16:00 20:00 00:00 41Mhz 54Mhz 12−May−1995 300 (mV) 300 (mV) Period 1 00:00 04:00 08:00 12:00 16:00 20:00 00:00 41Mhz 54Mhz 13−May−1995 300 (mV) 300 (mV) EQ a Time (UT) Period 2 Period 3 00:00 04:00 08:00 12:00 16:00 20:00 00:00 3kHz (VERT) 3kHz (NS) 3kHz (EW) 10kHz (NS) 10kHz (EW) 1000 (mV) 11−May−1995 00:00 04:00 08:00 12:00 16:00 20:00 00:00 3kHz (VERT) 3kHz (NS) 3kHz (EW) 10kHz (NS) 10kHz (EW) 1000 (mV) 12−May−1995 00:00 04:00 08:00 12:00 16:00 20:00 00:00 3kHz (VERT) 3kHz (NS) 3kHz (EW) 10kHz (NS) 10kHz (EW) 1000 (mV) 13−May−1995 EQ b Time (UT) 07/05/95 08/05/95 09/05/95 10/05/95 11/05/95 12/05/95 EW NS 150 (mV) 150 (mV) STWA 12/05/95 13/05/95 14/05/95 15/05/95 16/05/95 17/05/95 EW NS 150 (mV) 150 (mV) STWA EQ 17/05/95 18/05/95 19/05/95 20/05/95 21/05/95 22/05/95 EW NS 150 (mV) 150 (mV) STWA c Time (UT)
Fig. 1. Electromagnetic fluctuations
de-tected at Zante station before the Ms = 6.6 Kozani-Grevena Earthquake which occurred on 13 May 1995, 08:57 UT:
(a) at 41 MHz and 54 MHz by
elec-tric dipoles antennas; (b) at 3 kHz and 10 kHz by magnetic loop antennas; and
(c) at DC-ULF frequency range by
−4 −3 −2 −1 0 1 2 40 50 60 70 80 90 100 log 10(Hz) Power (dBm) β=1.308 ± 0.004 r=0.99 06:33 06:41 06:49 06:57 07:05 100 150 200 250 300 350 400 450 500 Time (UT) mV 41Mhz
Fig. 2. The power spectral density versus frequency plotted in a
log-log diagram obtained from a raw data sample of the 41 MHz pre-seismic time-series.
(Percival, 1995; Torrence and Compo, 1998). The calcula-tion is made by the Continuous Wavelet Transform based on the Morlet wavelet.
However, a system can exhibit a power law behaviour al-though not near to the critical transition (Perkovic et al., 1999). Thus, we calculated the parameters {α, β, r} upon dividing the signal into successive segments of 1024 samples each, in order to study not only the presence of a power law but mainly the time evolution of the associated parameters
{α, β, r}. The results of this approach suggest that the under study electromagnetic phenomenon is governed by scaling laws.
In Fig. 2 we show an example of the fitting of Eq. (1). (Note that the power spectral density versus frequency is plotted in log-log scale.) It should be noticed that the data fit the power law quite well.
2.1 The evolution of linear coefficient r with time
The linear correlation coefficient r is a measure of the good-ness of fitting of the power law (Eq. 1). In Fig. 3 we illus-trate the histograms of the distribution of the coefficient r for the three time windows that presented in Fig. 1a. It is clear that as the time of the Earthquake occurrence approaches r is shifted close to 1. Notice that at the tail of the pre-seismic time-series the fitting to the power law is continuously excel-lent (r > 0.98). It is remarkable that this behaviour breaks down just after the cessation of the signal.
2.2 The evolution of dynamical parameter β with time The dynamical parameter β indicates the strength of the sig-nal’s irregularity, i.e. as the value of β increases the spatial correlation also increases and the profile is smoothened (Tur-cotte, 1992). In Fig. 3 we demonstrate the histograms of the distribution of the spectral exponent β for the three time wdows that presented in Fig. 1a. We recognize a systematic in-crease of the exponent β as the EQ approaches; the β-values are maxima at the tail of the pre-seismic time-series. In paral-lel, we recognize a progressive increase of the time intervals with β = 1.5 ± 0.2 as the Earthquake approaches. This be-haviour also fails just after the cessation of the signal, almost 1 hour prior to the Earthquake; the spectral slope β exhibits random fluctuations out of the range β = 1.5 ± 0.2, just after the cessation of the signal.
The analysis of the time variation both of the spectral ex-ponent β and the linear correlation coefficient r has revealed a fluctuating behaviour, with a variance changing with time. An important observation is that the variance attains its mini-mum at the tail of the precursory time-series, i.e. the fitting to the power law was continuously excellent (r > 0.98) while the values of the scaling parameter β oscillate around 1.5. This finding meets corresponding experience based on ULF precursors reported by Balasco et al. (2002).
The combined temporal evolution of β and r is reasonable if we accept that stress and strain become nonlinear at the end of the loading cycle, producing rapidly accelerating effects.
The finding of 1/fβ behaviour may reflect the fact that the final output of fracture is affected by many processes that act on different time scales. The power law form also indicates that we are dealing with long memory process. This implies that during the EM fluctuations each value co-varies not only with its most recent value but also with its long-term his-tory in a scale invariance, fractal manner; the system refers to its history in order to define its future (non-Markovian be-haviour).
1 1.5 2 0 0.05 0.1 0.15 0.2 0.25 0.3 Exponent β Probability Antipersistence Persistence 0 0.5 1 0 0.1 0.2 0.3 0.4 0.5 0.6 r > 0.94 57% Period 1 linear coeficient r Propability 1 1.5 2 Exponent β Antipersistence Persistence 0 0.5 1 91% r > 0.94 Period 2 linear coeficient r 1 1.5 2 Exponent β Antipersistence Persistence 0 0.5 1 48% r > 0.94 Period 3 linear coeficient r
Fig. 3. The probability distributions of the linear coefficient r for three different periods are presented on the top row of the figure. The
intervals that mark these three periods of the VHF time-series are indicated in Fig. 1a. Top windows show the percentage of segments (duration is 1024 s) with r > 0.94. As the EQ approaches the distribution of r is shifted closer to 1. The probability distribution of the critical exponent β, for the same time intervals as before, are shown in the bottom row of the figure. We recognize a systematic increase of
βas the EQ approaches.
However, there is something more: the tantalizing rela-tionship between fractal structure (and fractal function) and non linear dynamics in order to explore the “raison d’ ˆetre” of many complex natural patterns being structurally fractal (Nicolis, 1991). What is the functional advantage of a geo-logical pattern “playing 1/fβ music”?
2.3 The persistence properties of the VHF fluctuations The spectral exponent β is related to another exponent, the Hurst exponent H , by the formula (Turcotte, 1992) β = 2H + 1. H lies anywhere in the range of 0 < H < 1 and characterises the persistence properties of the recorded elec-tromagnetic fluctuations according to the following scheme: (i) for H = 0.5 (i.e. β = 2) there is no correlation between the process increments and we are in a standard diffusing regime. As it is well-known, in the random walk which mod-els classical Brownian diffusion the walker follows a ran-dom path driven by non-memory dynamics; (ii) the range 0.5 < H < 1 (or 2 < β < 3) suggests persistence of the sig-nal (super-diffusion), i.e. if the amplitude of electromagnetic
fluctuations increase in one time interval, it is likely to con-tinue increasing in the period immediately following. The accumulation of fluctuations is faster than in classical Brow-nian motion; (iii) the range 0 < H < 0.5 (or 1 < β < 2), on the contrary, suggests anti-persistence or clustering (sub-diffusion), i.e. if the fluctuations increase in one period, it is likely to continue decreasing in the period immediately fol-lowing, and vice versa; (iv) at the limit H = 0 (or β = 1) it does not grow at all and the signal is stationary. Concerning our data, the β (or H ) values gradually increase (see Fig. 3) as the EQ approaches. This indicates that the EM fluctua-tions become less anti-correlated (the exponents H are closer to 0.5) as the main event approaches.
The observed temporal evolution of the dynamical param-eter H is compatible with the dynamics of the last phase of the EQ generation.
2.4 Indications of a universal behaviour
Recently, the fractal analysis has been performed for the ULF emission (Hayakawa et al., 1999, 2000a; Balasco et al.,
100 200 300 400 500 0 0.05 0.1 0.15 Amplitude (mV) Probability a 100 200 300 400 500 Amplitude (mV) b 100 200 300 400 500 Amplitude (mV) c
Fig. 4. The amplitude distributions of the 41 MHz time-series for three successive time periods. Middle diagram (b) covers a duration of
∼6.5 h (see shaded region of Fig. 1a) and represents the “critical window” (WS). Diagrams (a) and (c) refer to 3 h interval before and after
the WS respectively. The plateau’s breaking indicates the “symmetry” breaking.
2002; Smirnova et al., 2001; Hayakawa et al., 2000b; Go-toh et al., 2003). This study reinforces our hypothesis that the behaviour of parameter β (or H ) seems to be a candidate precursor of failure. Indeed, an important question is as fol-lows: how universal this signature of the failing system can be? Does it depend upon the frequency range of the precur-sors or the geographical position of the collated plates? Is it magnitude dependent?
The above mentioned literature indicates the existence of a possible universal behaviour in the temporal evolution of the critical exponents as the failure approaches. For example: (i) a similar increase with the time of the Hurst exponent from
H ≈ 0.1 to H ≈ 0.5 was also observed in the VLF pre-seismic time-series associated with the Athens EQ (Kapiris et al., 2002; Eftaxias et al., 2002b); (ii) an increase of the exponents β and H (approximately from 0.1 to 0.25) has been observed in the tail of the electromagnetic ULF time-series associated with the Biak Earthquake (Mw =8.2), on
17 February 1996 (see Fig. 4 in Hayakawa et al., 2000a) and the Guam Earthquake (Ms = 8.0) on 8 August 1993 (see Fig. 2 in Hayakawa et al., 1999). Also, encouraging are the relevant findings (associated with ULF EM precursors) de-scribed in Telesca and Lapenna (2001) and Balasco et al. (2002).
2.5 Broken symmetry indication
Recently, Contoyiannis and Diakonos (2000) and Contoyian-nis et al. (2002b) have presented a new method for the study of the critical fluctuations. Their analysis is based on the observation that the fluctuation pattern in the order param-eter space has intermittent origin. This suggests the intro-duction of a new critical exponent related to these intermit-tent dynamics. A necessary condition for their method to be applicable is the existence of a stationarity window (WS) in the corresponding time-series. This method has been ap-plied to the under study VHF electromagnetic fluctuations
(Contoyiannis et al., 2002a). The authors observed a time-window (WS), approximately from 18 to 12 h before the EQ (shaded window in Fig. 1a) that appears to be stationary (Contoyiannis et al., 2002b). The behaviour of EM fluctu-ations within this window is a fingerprint of a continuous phase transition. The associated characteristics (e.g. the crit-ical exponent) classify this transition to the 3-D-Ising univer-sality class. It is worth mentioning that before and after WS we find amplitude distributions of the EM fluctuations that demonstrate the expected, from the critical theory, symmetry breaking (see Fig. 2 in Contoyiannis et al., 2002b). Indeed, in Fig. 4 we show the amplitude distribution within the “crit-ical” window WS. In Fig. 4a and c we illustrate the ampli-tude distributions at the “symmetry” phase (phase I) and at the broken phase (phase II) respectively. A relevant paper is under preparation.
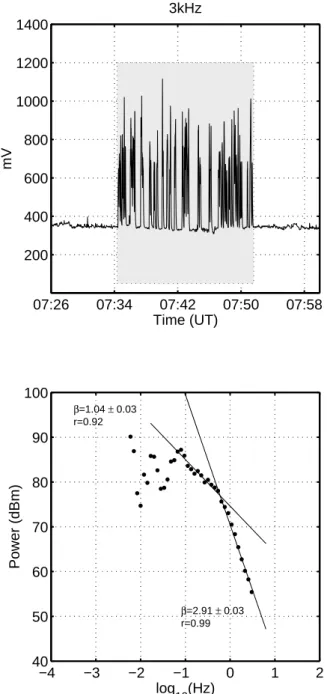
2.6 The VLF EM fluctuations as a temporal fractal Now we focus on the detected impulsive VLF signal just before the Earthquake occurrence. The spectrum of the recorded activity displays a decreasing power law behaviour
S(f ) ∼ f−β, typical of critical dynamics, with the following characteristic: the analysis reveals two different power laws, one for the low frequencies: r = 0.92, β = 1.04 ± 0.03 and another for the high frequencies: r = 0.99, β = 2.91 ± 0.03 (Fig. 5). The high frequency power law may reflect the dy-namics within the bursts while the low frequency one may indicate the correlation between the bursts.
We pay attention to the fact that the critical exponent
β = 2.91 (or H = 0.95) of the high frequency power law indicates strong persistent behaviour of the electromagnetic fluctuations within the avalanches. The detected VLF fluctu-ations that exhibit critical behaviour, at the tail of the VHF precursory anomaly and just before the Earthquake, should be attributed to a new, rather final, stage of the Earthquake preparation process. Notice that, if we consider that the same
−4 −3 −2 −1 0 1 2 40 50 60 70 80 90 100 log 10(Hz) Power (dBm) β=2.91 ± 0.03 r=0.99 β=1.04 ± 0.03 r=0.92 07:26 07:34 07:42 07:50 07:58 200 400 600 800 1000 1200 1400 Time (UT) mV 3kHz
Fig. 5. The power spectral density versus frequency of the 3 kHz
(NS) EM activity plotted in a log-log diagram.
dynamics governs the large-scale Earthquake and the lab-oratory scale sample rheological structure, then, the funda-mental experiments performed by Ohnaka and Mogi (1982) lead to the suggestion that the recorded VLF bursts might re-flect the last (nucleation) phase of the Earthquake (Eftaxias et al., 2002a). The following experimental finding also en-courages the hypothesis of the association of the precursory VLF signals with the last phase of the generation of Earth-quake. Two clear kHz EM signals were detected before the
M = 5.9 Athens EQ (7 September 1999) Earthquake. The larger anomaly, the second one, contains approximately 80% of the total EM energy received. The fault modeling of the
Athens EQ, based on information obtained by radar interfer-ometry (Kontoes et al., 2000) showed two faults. The main fault segment is responsible for the 80% of the total released seismic energy and the secondary fault segment for the re-maining 20%. Notice that we found that the spectrum of this strong impulsive emission also displays decreasing power law behaviour, with the scaling exponent increasing during the process of the Earthquake preparation. At the tail of the activity the evolution of the VLF precursors also attains per-sistent behaviour (Kapiris et al., 2002; Eftaxias et al., 2002b).
3 Test of the acceleration of the precursory
electromag-netic energy release
Theoretical studies suggest an acceleration of the energy re-lease as the general fracture approaches. Using equations from crack propagation (Das and Scholz, 1981) and dam-age mechanics (Leckie and Hayhurst, 1977; Bufe and Varnes, 1993) a formula for the cumulative elastic energy release ε(t ) is derived:
ε(t ) = A + B(tf −t )m. (2)
Here, tf is the failure time, the constant B is negative and m
is a critical exponent. A is the value of ε(t ) when t = tf,
i.e. the final Benioff, strain up to and including the largest event. The cumulative Benioff strain at time t is defined as
ε(t ) =PN (t )
i=1 Ei(t )
1
2 where Ei is the energy of the ithevent
and N (t ) is the number of events at time t .
Models also predict a power law time-to-failure function where the crust is in the state of “intermittent criticality” (e.g. Sammis and Smith, 1999; Bowman and King, 2001).
On the other hand laboratory results suggest an exponen-tial acceleration of the energy release at the final stage of the macroscopic rupture: when the stress/time curve devi-ates from linearity, i.e. as the failure approaches, there is an acceleration in the acoustic/electromagnetic activity indicat-ing the growth of new microcracks up to the point of failure (Mansurov, 1983; Yamada et al., 1989; Meredith et al., 1990; Reches and Lockner, 1994; Ohnaka, 2000; Mavromatou and Hadjicontis, 2001).
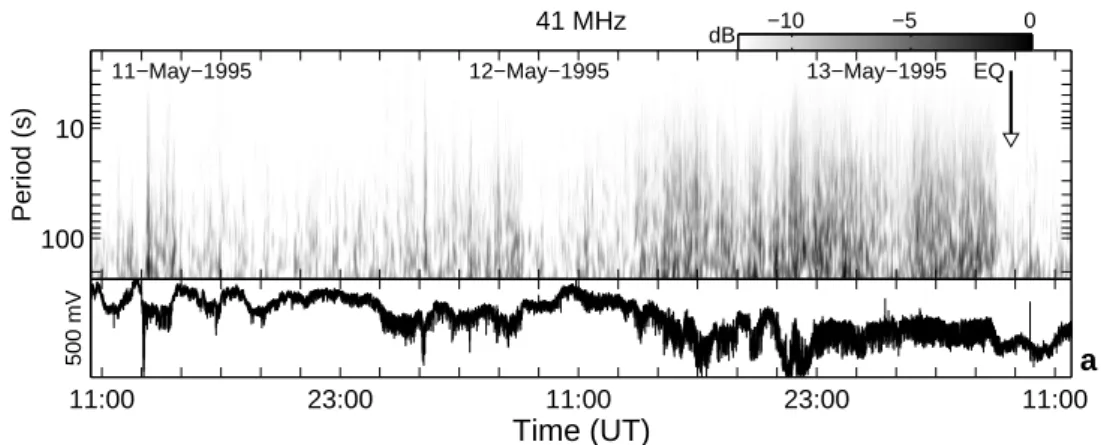
Now, we test the existence of the accelerating energy re-lease in the under study EM activity. The wavelet power spectrum of the VHF time-series indicates an acceleration of the captured EM energy (Fig. 6). Indeed, an inspection of this figure reveals a progressive shift to higher levels in terms of frequency (emission rate) and amplitude.
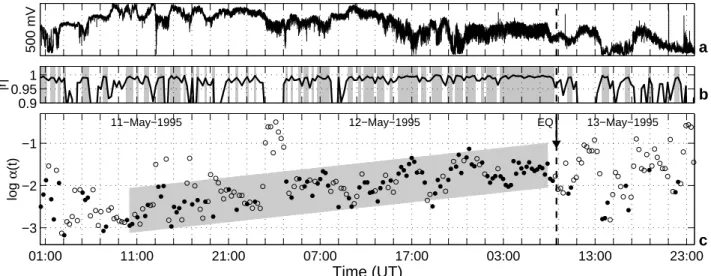
Spectral analysis permits a quantitative test concerning the presence of an accelerating emission rate in the under study VHF time-series. The temporal evolution of the es-timated spectral amplification α, corresponding to segments with r > 0.98, reveals a nearly exponential increase dur-ing the last few tens of hours prior to the K-G Earthquake (Fig. 7). Note that it is often difficult to distinguish in real data an exponential from a power law increase. A fundamtal indication of criticality is the divergence of the rate of en-ergy dissipation near the critical point. Hence, the observed
Period (s)
41 MHz
EQ
11−May−1995 12−May−1995 13−May−1995
10 100 11:00 23:00 11:00 23:00 11:00 a 500 mV Time (UT) dB −10 −5 0
Fig. 6. The wavelet power spectrum of the readings recorded by the electric antennas tuned at 41 MHz. The intensity scale on the top of each
diagram is brightness corresponding to the values of the square spectral amplitudes, in arbitrary units. There is a progressive increase in the emission rate as the K-G EQ approaches.
acceleration further strengthens the hypothesis that the sys-tem approaches the critical point.
4 The VLF precursor as the sub-product of the
struc-tural instability associated with the nucleation phase
Perhaps the most convincing evidence that there is a nucle-ation stage before major Earthquakes comes from observa-tions of foreshoks (Dodge et al., 1995). The K-G Earthquake was preceded within 30 min of the main shock by five fore-shocks with M > 3.5 clustered within 2 km of one another about 5 to 10 km from the main shock epicentre (Bernard et al., 1997). This size of foreshocks clustering fits well the correlation law with the main-shock magnitude obtained by Dodge et al. (1995) for Californian Earthquakes (Bernard et al., 1997). This unusual foreshock activity for the aseis-mic K-G region, which was completely quiet for a long pe-riod before the EQ, may be possibly regarded as a fingerprint of local dynamic rupture of asperities in the weak zone as-sociated with the nucleation of the main rupture. It should be noticed that the series of the above-mentioned foreshocks was reported a few minutes after the cessation of the 3 and 10 kHz electromagnetic precursor. Thus, the 3 and 10 kHz impulsive electromagnetic emission could be considered as the electromagnetic signature of the underlying structural in-stability that belongs to the final (nucleation) stage of the EQ preparation process within the K-G pre-focal area.
5 The forming fault as a emitting EM fractal
geo-antenna
Next, we propose a possible scenario concerning the mecha-nism of the generation of the detected pre-failure radio emis-sions. The K-G Earthquake created clear fault traces of NE-SW direction and of 8–12 km length. Such surface rupture is the signature of a highly stressed region that reached the surface. The principle feature of criticality is the fractal
or-ganization both in space and time: the spatial distribution of epicentres is fractal and Earthquakes occur on a fractal struc-ture of faults (Bak et al., 2002). Moreover, there is additional evidence for the fractal character of fragments size distri-bution (e.g. Turcotte, 1992). Therefore, the hypothesis that an array of “fault elements” having a fractal distribution is formed as the Earthquake approaches can be accepted. How-ever, it is well-known that fracturing in a solid body is asso-ciated with the emergence of a mosaic of charges at the edges of the moving cracks. This means that each “fault element-moving crack” can act as a “radiating element”. The notion is that as the Earthquake approaches a surface fractal antenna is formed (Kapiris et al., 2002).
Fractals are highly convoluted, irregular shapes. It is well-known that sharp edges, corners and discontinuities enhance radiation from electric systems. Thus, it seems logical to expect that curves and surfaces which have a characteristic highly irregular shape, which is fundamentally different from that of classical Euclidean shapes, should become efficient radiators. The radiation pattern of an antenna is specified by the characteristic length scale of the antenna, i.e. kL ∼ 1, where k denotes the radiation’s wavenumber and L repre-sents the scale length. Therefore, if there is no characteristic size, as in the case of a fractal structure, then the antenna will generate an effective radiation pattern for a whole range of frequencies controlled by the smaller and largest spatial scale. Notice that the EM precursors are observed in a wide frequency range. It is reasonable to assume that the order of the largest spatial scale of the geo-antenna is related either to the length of the observed fault traces, i.e. ∼10 km, or to the critical region radius, i.e. ∼100 km (Zoller et al., 2001). The fact that the 3 and 10 kHz pre-seismic electromagnetic anomalies were detected at the end of the 41 and 54 MHz pre-seismic emissions seems to confirm the under study sce-nario. The critical point hypothesis for large Earthquakes predicts two different precursory phenomena in space and time, an accelerating energy release (see Eq. 2) and growth of the spatial correlation length (Zoller and Hainzl, 2002).
a 500 mV 01:00 11:00 21:00 07:00 17:00 03:00 13:00 23:00 −3 −2 −1 c log α (t) EQ
11−May−1995 12−May−1995 13−May−1995
Time (UT) b |r| 0.9 0.95 1
Fig. 7. (a) The 41 MHz EM time-series recorded prior to the 13 May 1995 K-G EQ (the event is indicated by the vertical dashed line in all the
diagrams). (b) The corresponding evolution of the linear coefficient r. Grey zones correspond to r greater than 0.98. (c) Time-dependence of the spectral amplification parameter α. Solid circles correspond to segments with r-values greater than 0.98. Grey zone indicates an exponential increase of α.
Part of mechanical energy released in the formation of cracks is transformed into electromagnetic energy by a variety of mechanism (Gershenzon and Bambakidis, 2000). Hence, the reported increasing EM activity as the EQ approaches further supports the concept of fractal geo-antenna formation.
Recently, particular interest attracts the research area known as “Fractal Electrodynamics”. The term “fractal elec-trodynamics” was first suggested by Jaggard (1990) to iden-tify the newly emerging branch of research, which com-bines fractal geometry with Maxwell’s theory of electromag-netism. Particularly, the field radiated from a fractal channel has been studied and discussed in the time domain and the frequency domain (e.g. Werner, 1995; Puente et al., 1999). The authors found that the field radiated by a fractal channel appears to have fractal structure. We remind that the under study precursory EM time series appear fractal properties. Hence, “Fractal Electrodynamics” supports the hypothesis that the precursory EM signals have been emitted by an EM fractal-shaped geo-antenna.
The proposed scenario is simple, whereas the real situation is very complex. However, it seems to meet the physical aspects of the problem.
6 The DC-ULF critical indications
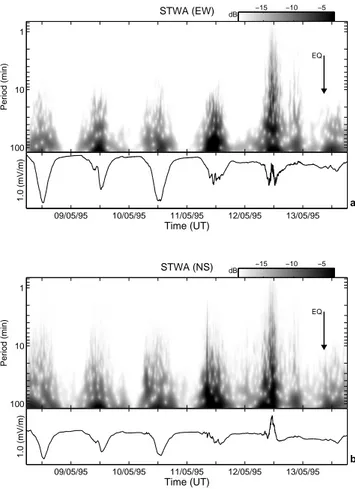
Although the DC-ULF recordings (Fig. 1c) is out of the fre-quency range we deal with in this paper, it is worth mak-ing some comments. The wavelet analysis revealed an ac-celerating ULF event-rate, associated with larger amplitudes (Fig. 8). This behaviour further supports the concept that the system is near the critical point.
The feature of this anomaly supports the hypothesis of its coupling with the phenomenon of the abnormal propagation in the Earth-ionosphere duct. Indeed, it is well-known that
the absorption in the D and E ionospheric layers decreases with the decrease in the density of electrons and ions at night. Hence, the nighttime radiation, due to a propagation mode formed between the ionosphere and Earth, is more intense than the daytime radiation. This arrangement rationalizes the normal diurnal undulation of the recordings of the STWA sensors. On the other hand, there is mounting number of in-dications on possible coupling between ionospheric anoma-lies and Earthquakes (Molchanov and Hayakawa, 1998; Liu et al., 2000; Pilipenco et al., 2001, and references therein). On physical grounds, we expect that the terminal nonlinear stage of the generation of a large shallow Earthquake of mag-nitude 6.6, with clear extensive surface fault traces, such as the K-G EQ, could be the required source for these iono-spheric anomalies.
The reported surprising increase of the signal during the daytime on 12 May 1995 is explained in terms of the maxi-mum height of the ionospheric layers and of maximaxi-mum elec-tron density. For example, Sorokin and Chmyrev (1999), based on satellite data (COSMOS-1809), found that the iono-sphere had considerably changed one day before EQs, i.e. a significant increase of the maximum height of F-layer about 50% and a remarkable decrease of the maximum density of electrons. Parrot (1999) concludes that ionospheric perturba-tions produced by Earthquakes are revealed by an increase of the background noise level, a few hours before the shock.
7 Geomagnetic activity during precursory
EM emissions
The most serious problem in the study of seismogenic emis-sions in any frequency range (i.e. ULF, VLF or VHF) is the distinction of the emissions possibly associated with Earth-quakes from noise. There are different kinds of emissions in
Period (min) STWA (EW) EQ 1 10 100 09/05/95 10/05/95 11/05/95 12/05/95 13/05/95 a 1.0 (mV/m) Time (UT) dB −15 −10 −5 Period (min) STWA (NS) EQ 1 10 100 09/05/95 10/05/95 11/05/95 12/05/95 13/05/95 b 1.0 (mV/m) Time (UT) dB −15 −10 −5
Fig. 8. The wavelet power spectrum of the ULF signals (upper part)
along with their corresponding signal (lower part) at: (a) EW STWA antenna; (b) NS STWA antenna. The intensity scale on the top of each diagram is the brightness corresponding to the values of the square spectral amplitudes, in arbitrary units. The spectrum reveals an accelerating ULF event-rate associated with larger amplitudes as the EQ approaches.
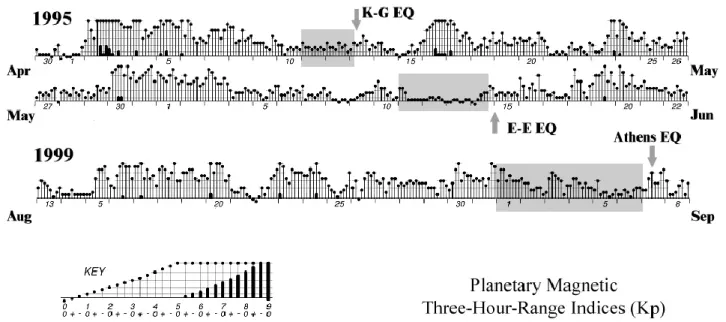
VLF frequency band originated in ionosphere and magneto-sphere, which are found to be closely related to geomagnetic activity. We pay our attention to this point: geomagnetic activity as expressed by the planetary three-hour-range Kp
index (http://www.gfz-potsdam.de/pub/home/obs/kp-ap/) is depicted in the visualization of the Kp values utilizing the
Bartels musical diagram (Fig. 9). During the period 1995– 1999 two additional destructive Earthquake occurred in con-tinental Greece: on 15 June 1995 the Egio-Eratini (Ms = 6.5) and on 7 September 1999 Athens Earthquake (Ms = 5.9). These Earthquake were preceding by a sequence of EM anomalies (Eftaxias et al., 2000).
One can recognize that the recorded sequence of ULF, VLF and VHF electromagnetic emissions before the Kozani-Grevena Earthquake was observed during quiet magnetic conditions. Based on the classification of days (deduced from Kpindices) the 11 May 1995 is among the most quiet
days (Q-days) of the month (Fig. 9).
The whole period of ULF, VLF and VHF electromagnetic activity prior to Egio-Eratini Earthquake also falls in the
Q-days time span of the month (see Fig. 9).
In the case of Athens Earthquake the Kpvalues (Fig. 9) are
also low during the corresponding electromagnetic anoma-lies. Note that the 6 September 1999 is referred as one of the Q-days of the month.
All the above constitute an observational evidence that the precursory EM activities recorded before the Kozani-Grevena, Egion-Eratini and Athens Earthquakes have been detected during low geomagnetic activity. This evidence may support the hypothesis that the precursory electromagnetic phenomena could be related to the crustal activity during the Earthquake preparation stage.
8 Conclusions
The hypothesis that the evolution of the Earth’s crust towards the Critical Point may take place not only in the seismolog-ical but also in the VLF-VHF electromagnetic sense is sup-ported by the following experimental findings:
1. The Power Spectral Density of the VHF time-series, during the last few tens of hours before the K-G Earth-quake, includes time intervals that exhibit a power law of a stable spectral exponent β and excellent linear cor-relation coefficient r. It is remarkable that the num-ber of the time intervals meeting these two features in-creases progressively as the moment of the Earthquake approaches. This is a reasonable behaviour if we ac-cept that stress and strain become nonlinear at the end of the loading cycle, producing rapidly accelerating ef-fects. The spectral analysis of the precursory VHF time-series revealed an underlying criticality that can be de-scribed in terms of a 3-D-Ising model phase transition. 2. The power law form also indicates that we are dealing
with a long memory process. This implies that during the EM fluctuations each value co-varies not only with its most recent value but also with its long-term history in a scale invariant, fractal manner; the system refers to its history in order to define its future (non-Markovian behaviour).
3. The observed decrease with the time of the anti-persistence behaviour as well as the emergence of per-sistence properties in the tail of the precursors are fea-tures consistent with the critical approach of the main shock.
4. The VHF activity during the last tens of hours before the K-G Earthquake exhibits a systematic accelerating energy release. Notice that a basic indication of critical-ity is the divergence of the dissipation near the critical point.
Thus, experimental evidence indicates that information on the preparation process of a significant surface Earthquake can be deduced from the high frequency part of the precur-sory EM emission. This statement is reinforced with the fol-lowing arguments that we have published recently:
Fig. 9. The temporal evolution of the geomagnetic activity as expressed by the planetary three-hour-range Kp index (http://www.
gfz-potsdam.de/pub/home/obs/kp-ap/). The shaded frames indicate the time windows of the precursory EM activities recorded before the Kozani-Grevena, Egion-Eratini and Athens Earthquakes. One can recognize that in all cases the precursory electromagnetic phenomena have been detected during low geomagnetic activity.
5. We have shown (Eftaxias et al., 2002a) that if the same dynamics govern the large-scale Earthquakes and the laboratory scale sample rheological structure, the recorded VLF EM fluctuations might reflect the nucle-ation phase of the Earthquake. The appearance of strong persistence properties in the VLF precursory time series further supports the former argument.
6. In terms of energy, features of VLF signals (see Sect. 2.6) are possibly correlated with the corresponding fault model (Eftaxias et al., 2001a). This experimental finding further encourages the hypothesis that the VLF part of the precursory emission might reflect the nucle-ation phase of fracture process.
7. We have shown that the distribution of the time in-tervals l between two successive VHF EM bursts ex-hibits a power-law behaviour P (l) ∼ l−1.20 (Kapiris et al., 2002). Diodati et al. (1991) have presented ev-idence of criticality in volcanic rock ruptures associ-ated with the Strobolian activity, measured by acous-tic emissions (AE). The distribution of the time in-tervals l between two successive AE bursts exhibits a power-law behaviour P (l) ∼ l−1.20. The perfect agree-ment between the two scaling exponents increases the confidence in the reliability of our conclusion that the detected sequence of electromagnetic burst is a sub-product of the fracture process in a fraction of the pre-focal area (Kapiris et al., 2002).
8. A key parameter is the degree of disorder (Sornette, 2000). The VLF-anomalies for the three EQs in Kozani-Grevena, Egion-Eratini and Athens differ in their
lead-time: as the structure in the pre-focal area becomes less heterogeneous, the lead-time becomes smaller (Eftaxias et al., 2000, 2001b). Gershenzon et al. (1989) have pro-posed a model for the micro-fracture of granular media consisting of rigid grains and interstices filled with a brittle elastic material. Strong grains can act as crack barriers, whereas the brittle elastic material may en-hance crack growth. This elastic model predicts that the less the variance in the distribution of local threshold for breaking in the brittle material is the smaller the lead-time of the pre-failure signal is (Eftaxias et al., 2000, 2001b).
We have reasons to assert that the detected precursory VLF, VHF EM emissions include significant signatures of the last phases of the Earthquake generation. This argument implies that each of the detected VLF and VHF emission may have been emitted by corresponding VLF and VHF electro-magnetic emitters that their number is efficient to represent the behaviour of the total number of the activated emitters during the evolution of complex seismicity patterns in nature. It is a reasonable hypothesis if we consider that the Kozani-Grevena, Egion-Eratini and Athens EQs occurred in the land of Greece, and all the three EQs were surface ones. An out-standing feature of the first two EQs was the clearly observed extended fault traces while in the case of the Athens EQ the energy centroid depth was 10.3 km for the main fault, and 5.4 km for the secondary one (Kontoes et al., 2000). Notice that typical values of skin depth (e.g. for Quartzite, Gabbro, and Soil of 6% humidity) is ∼ 1 km for a few kHz and 100 m for a few MHz respectively (see Fig. IX.14, Gueguen and Palciauskas, 1994).
We must keep in mind that the Earth’s crust in the pre-focal area is strongly heterogeneous, as far as the spatial dis-tribution of the electrical parameters is concerned. The exis-tence of waveguides between the vicinity of hypocenter and the ground surface cannot be excluded. Waveguiding of EM waves can take place in a complex medium by total internal reflection or through evanescent-field coupling (Yariv et al., 1999). Recently, in a number of papers the authors suggest that the evolution of the Earth’s crust toward the critical point takes place not only in a seismological sense, as a forma-tion of the block-spring fractal structure in the fault zone, but also in the electromagnetic sense as a possible formation of the fractal conductordielectric structure (Hayakawa et al., 1999, 2000a; Balasco et al., 2002). The propagation of EM waves in composite materials has been the object of consid-erable attention (Chew, 1995). Theoretical calculations have shown that the transmission and absorption of EM waves by conductive-dielectric non-periodic systems may be radi-cally different from those of their homogeneous constituents (Modinos et al., 2001; Yannopapas et al., 2002). It is a tricky task to extrapolate results of theoretical study to the field, however, we cannot ignore the theoretical results. It is evi-dent that much further investigation in order to get more con-vincing results is required.
Generally, heterogeneity constitutes a fundamental re-quirement for the transmission at a distance from source (more than 100 km) even for an ULF pre-seismic EM emis-sion. The remarkable property of ULF Seismic Electric Sig-nal (SES) is that it can be recorded at sensitive sites, which are hundred or more kilometers from the epicenter. More-over, a sensitive site is sensitive only to SES from some spe-cific focal area(s) (Varotsos et al., 1996). These basic proper-ties cannot be explained by a homogeneous medium. To ex-plain the experimental data, one needs to assume some highly conductive channel(s) between the source and the observa-tion sites (Varotsos et al., 1998; Sarlis et al., 1999; Surkov et al., 2002). Recently, electrokinetic effects possibly asso-ciated with Earthquake preparation process have been theo-retically investigated, with the assumption that the structure of pore space around hypocentral zone has fractal properties. To explain the observed amplitude of SESs signals, even in the frame of this approach, the electric source must be at a distance of about 10 km from the registration point for a ho-mogeneous medium (Surkov et al., 2002).
An Earthquake is a long-term complex stress accumula-tion and release process occurring in the highly heteroge-neous Earth’s crust. The various stages of the EQ gener-ation are accompanied by EM emissions at different fre-quency bands ranging from ULF, VLF to VHF. The time sequence deduced from these various observations seems to agree qualitatively with the idea that different frequency elec-tromagnetic anomalies are not synchronous: signals of the ULF band tend to appear earlier (Uyeda, 1996). According to recent Greek experience ULF EM signals have a precur-sory time from a few weeks to several weeks (Varotsos et al., 2002) in contrast to much shorter lead-time (from a few hours to several tens of hours) for the VLF-VHF signals (Eftaxias
et al., 2000; Kapiris et al., 2002). These two groups of signals may arise from different mechanisms since they do not occur within the same time scales. It seems useful, as strongly rec-ommended by Hayakawa et al. (1994), to combine ULF and VLF-VHF field measurements to enhance the understanding of the physics behind the various stages of the Earthquake preparation process. Of course as the depth of the hypocenter increases the VLF, VHF information fades faster than ULF one.
At any rate, the complexity of seismogenic systems is ob-vious, as also is the amount of research necessary before we begin to understand them.
Acknowledgements. The authors would like to thank Prof. S. Uyeda
and Dr. H.‘Tanaka for their critical and constructive comments. We are pleased to acknowledge many stimulating discussions with Prof. T. Chelidze and Prof. J. Nicolis. We also acknowledge that the comments of the two referees Prof. M. Hayakawa and Dr. N. Ger-shenzon were helpful in improving the present work.
References
Allegre, C., Mouel, J. L., and Provost, A.: Scaling riles in rock frac-ture and possible implications for Earthquake predictions, Na-ture, 297, 47–49, 1982.
Andersen, J., Sornette, D., and Leung, K.: Tricritical behaviour in rupture induced by disorder, Phys. Rev. Lett., 78, 2140–2143, 1997.
Bak, P., Christensen, K., Danon, L., and Scanlon, T.: Unified scal-ing law for Earthquakes, Phys. Rev. Lett., 88, 178 501–178 501, 2002.
Balasco, M., Lapenna, V., and Telesca, L.: 1/fa fluctuations in
geoelectrical signals observed in a seismic area of southern Italy, Tectonophysics, 347, 253–268, 2002.
Bernard, P., Pinettes, P., Hadjidimitriou, P., Scordilis, E., Veis, G., and Milas, P.: From precursors to prediction: a few recent cases from Greece, Geophys. J. Int, 131, 467–477, 1997.
Bowman, D. and King, G.: Accelerating seismicity and stress ac-cumulation before large Earthquakes, J. Geophys. Res. Lett., 28(21), 4039–4042, 2001.
Bowman, D., Quillon, G., Sammis, C., Sornette, A., and Sornette, D.: An observational test of the critical Earthquake concept, J. Geophys. Res., 103, 24 359–24 372, 1998.
Bufe, C. and Varnes, D.: Predictive modelling of the seismic cycle of the greater San Francisco Bay region, J. Geophys. Res., 98, 9871–9883, 1993.
Carrilo, L., Manosa, L., Ortin, J., Planes, A., and Vives, E.: Exper-imental evidence for universality of acoustic emission avalanche distributions during structural transitions, Phys. Rev. Let., 81, 1889–1892, 1998.
Chelidze, T.: Percolation and fracture, Phys. Earth Planet. Inter., 28, 93–101, 1982.
Chew, W.: Wave and fields in inhomogeneous media, IEEE Press, 1995.
Contoyiannis, Y. and Diakonos, F.: Criticality and intermittency in the order parameter space, Phys. Lett. A, 268, 286–292, 2000. Contoyiannis, Y., Diakonos, F., Kapiris, P., Peratzakis, A., and
Ef-taxias, K.: Fingerprints of intermittent and critical behaviour of pending Earthquake in electromagnetic anomalies, in: EGS, Nice, April, 2002a.
Contoyiannis, Y., Diakonos, F., and Malakis, A.: Intermittent dy-namics of critical fluctuations, Phys. Rev. Lett., 89, 35 700/1– 35 700/4, 2002b.
Das, S. and Scholz, C.: Theory of time-dependent rupture in the Earth, J. Geophys. Res., 86, 6039–6051, 1981.
Diodati, P., Marchesoni, F., and Piazza, S.: Acoustic emission from volcanic rocks: An example of self-organized criticality, Phys. Rev. Let., 67, 2239–2241, 1991.
Dodge, A., Beroza, C., and Ellswroth, L.: Evolution of the 1992 landers, california, foreshock sequence and its implications for Earthquake nucleation, J. Geophys. Res., 100, 9865–9880, 1995. Eftaxias, K., Kopanas, J., Bogris, N., Kapiris, P., Antonopoulos, G., and Varotsos, P.: Detection of electromagnetic Earthquake precursory signals in Greece, Proc. Japan Acad., 76(B), 45–50, 2000.
Eftaxias, K., Kapiris, P., Polygiannakis, J., Bogris, N., Kopanas, J., Antonopoulos, G., Peratzakis, A., and Hadjicontis, V.: Sig-natures of pending Earthquake from electromagnetic anomalies, Geophys. Res. Lett., 28, 3321–3324, 2001a.
Eftaxias, K., Kapiris, P., Polygiannakis, Y., Hadjicontis, V., Che-lidze, Z., Zilpimiani, D., and CheChe-lidze, T.: Seismogenic radio-emission as a signature of the Earthquake preparation process, Journal of the Georgian Geophysical Society, 6, 3–16, 2001b. Eftaxias, K., Kapiris, P., Dologlou, E., Kopanas, J., Bogris, N.,
Antonopoulos, G., Peratzakis, A., and Hadjicontis, V.: EM anomalies before the Kozani Earthquake: A study of their be-haviour through laboratory experiments, Geophys. Res. Lett., 29, 69/1–69/4, 2002a.
Eftaxias, K., Kapiris, P., Polygiannakis, J., Peratzakis, A., Kopanas, J., Antonopoulos, G., and Rigas, D.: Experience of short term Earthquake precursors with VLF-VHF elecromagnetic emis-sions, Natural Hazards and Earth System Sciences, in press, 2002b.
Fujinawa, Y. and Takahashi, K.: Anomalous VLF subsurface elec-tric changes preceding eartquakes, in: Electromagnetic Phenom-ena Related to Earthquake Prediction, edited by Hayakawa,M. and Fujinawa, Y., pp. 131–148, Terrapub, Tokyo, 1994. Fujinawa, Y., Takahashi, K., Matsumoto, T., and Kawakami,
N.: Experiments to locate sources of Earthquakes-related VLF-electromagnetic signals, Proc. Japan. Acad., 73(B), 33–38, 1997.
Gershenzon, N. and Bambakidis, G.: Modelling of
seismo-electromagnetic phenomena, Russian, 97, 4561–4566, 2000. Gershenzon, N., Gokhberge, M., Karakin, A., Petviashvili, N.,
and Rykunov, A.: Modeling the connection between Earth-quake preparation processe and crustal electromagnetic emis-sion, Physics of Earth and Planetary Interiors, 57, 129–138, 1989.
Gotoh, K., Hayakawa, M., and Smirnova, N.: Fractal analysis of the ULF geomagnetic data obtained at Izu Peninsula, Japan in rela-tion to nearby Earthquake swarm of June-August 2000, Natural Hazard and Earth System Sci., in press, 2003.
Gross, S., Fineberg, J., Marder, M., McCormick, and Swinney, H.: Acoustic emissions from rapidly moving cracks, Phys. Rev. Let., 71, 3162–3165, 1993.
Guarino, A., Garcimartin, A., and Ciliberto, S.: An experimental test of the critical behaviour of fracture precursors, Eur. Phys. J. B, 6, 13–24, 1998.
Guarino, A., Ciliberto, S., Garcimartin, A., Zei, M., and Scorretti, R.: Failure time and critical behaviour of fracture precursors in heterogeneous materials, Eur. Phys. J. B, 26, 141–151, 2002. Gueguen, Y. and Palciauskas, V.: Introduction to the physics of
rocks, Princeton University Press, 1994.
Hayakawa, M., Fujinawa, Y., Evison, F. F., Shapiro, V., Varotsos, P., Fraser-Smith, A., Molchanov, O., Pokhotelov, O., Enomoto, Y., and Schloessin, H.: What is the future direction of investi-gation on electromagnetic phenomena related to Earthquake pre-diction?, in: Electromagnetic phenomena related to Earthquake prediction, edited by Hayakawa, M. and Fujinawa, Y., 667–677, Terrapub, Tokyo, 1994.
Hayakawa, M., Ito, T., and Smirnova, N.: Fractal analysis of ULF geomagnetic data associated with the Guam eartquake on August 8, 1993, Geophys, Res. Lett., 26, 2797–2800, 1999.
Hayakawa, M., Itoh, T., Hattori, K., and Yumoto, K.: ULF elec-tromagnetic precursors for an Earthquake at Biak, Indonesia on February 17, 1996, Geophys, Res. Lett., 27(10), 1531–1534, 2000a.
Hayakawa, M., Kopytenko, Y., Smirnova, N., Troyan, V., and Pe-terson, T.: Monitoring ULF magnetic disturbances and schemes for recognizing Earthquake precursors, Phys. Chem. Earth (A), 25, 263–269, 2000b.
Herrmann, H. and Roux, S.: Statistical models for fracture of disor-dered media, Amsterdam, Elsevier, 1990.
Jaggard, D.: On fractal electrodynamics, in: Recent advances in Electromagnetic Theory, edited by Kritikos, H. and Jaggard, D., pp. 183–224, Springer-Verlag, 1990.
Kapiris, P., Polygiannakis, J., Nomicos, K., and Eftaxias, K.: VHF-electromagnetic evidence of the underlying pre-seismic critical stage, Earth Planets Space, 54, 1237–1246, 2002.
Kontoes, C., Elias, P., Sykioti, O., Briole, P., Remy, D., Sach-pazi, M., Veis, G., and Kotsis, I.: Displacement field and fault model for the September 7, 1999 Athens Earthquake inferred from ERS2 satellite radar interferometry, Geophys. Res. Lett., 27(24), 3989–3992, 2000.
Kossobokov, V., Maeda, K., and Uyeda, S.: Precursory of seismic-ity in advance of the Kobe,1995, M = 7.2 Earthquake, Pure and Applied Geophysics, 155, 409–423, 1999.
Lamaignere, L., Carmona, F., and Sornette, D.: Experimental re-alization of critical thermal fuses rupture, Phys. Rev. Lett., 77, 2738–2741, 1996.
Leckie, F. and Hayhurst, D.: Constitutive equations for creep rup-ture, Acta Metall., 25, 1059–1070, 1977.
Lesne, A.: Methodes de renormalisation, Paris, Eyrolles, 1996. Liu, J., Chen, Y., Pulinets, S., Tsai, Y., and Chuo, Y.:
Seismo-ionospheric signatures prior to M ≥ 6.0 Taiwan Earthquakes, Geophys. Res. Lett., 27, 3113–3116, 2000.
Main, I.: Statistical physics seismogenesis and seismic hazard, Rev. Geophys., 34, 433–462, 1996.
Mansurov, A.: Prognoz zemletriasenii, Dushanbe-Moscow, 1983. Mavromatou, C. and Hadjicontis, V.: Laboratory investigation of
the electric signals preceding the fracture of crystalline insula-tors, in: Earthquake thermodynamics and phase transformations in the Earth’s interior, edited by Teisseyre, R. and Majewski, E., pp. 501–517, Academic Press, 2001.
Meredith, P., Main, I., and Jones, C.: Temporal variations in seis-micity during quasi-static and dynamic rock failure, Tectono-physics, 175, 249–268, 1990.
Meyer, B., Armijo, R., Massonet, D., Chabalier, J. B. D., Delacourt, C., Ruegg, J. C., Achache, J., and Papanastassiou, D.: Results from combining tectonic observations and SAR interferometry for the 1995 Grevena Earthquake: A summary, J. Geodynamics., 26(2–4), 255–259, 1998.
Modinos, A., Stefanou, N., Psarobas, I., and Yannopapas, V.: On wave propagation in inhomogeneous systems, Physica B, 296, 167–173, 2001.
Molchanov, O. and Hayakawa, M.: On the generation mecha-nism of ULF seismogenic electromagnetic emission, Phys. Earth Planet, 105, 201–210, 1998.
Nicolis, J. S.: Chaos and information processing, World Scientific, 1991.
Nomikos, K. and Vallianatos, F.: Electromagnetic variations asso-ciated with the seismicity of the frontal Hellenic arc, Geologica Carpathica, 49, 57–60, 1998.
Ohnaka, M.: A physical scaling relation between the size of an Earthquake and its nucleation zone size, Pure and Applied Geo-phys., 157, 2259–2282, 2000.
Ohnaka, M. and Mogi, K.: Frequency characteristics of acoustic emission in rocks under uniaxial compression and its relation to the fracturing process to failure, J. Geophys. Res., 87, 3873– 3884, 1982.
Parrot, M.: Statistical studies with satellite observations of seismo-genic effects, in: Atmospheric and ionospheric electromagnetic phenomena associated with Earthquakes, edited by Hayakawa, M., pp. 685–695, Terrapub, Tokyo, 1999.
Percival, D.: On estimation of the wavelet variance, Biometrika, 82, 619–631, 1995.
Perkovic, O., Dahmen, K., and Sethna, J.: Disorder-induced critical phenomena in hysteresis: Numerical scaling in three and higher dimensions, Phys. Rev. B, 59, 6106–6119, 1999.
Petri, A., Paparo, G., Vespignani, A., Alippi, A., and Constantini, M.: Experimental evidence for critical dynamics in microfractur-ing processes, Phys. Rev. Let, 73, 3423–3426, 1994.
Pilipenco, V., Shalimov, S., Uyeda, S., and Tanaka, H.: Possible machanism of the over-horizon reception of FM radio waves dur-ing Earthquake preparation period, Proc. Japan Acad., 77, 125– 130, 2001.
Puente, C., Romeu, J., and Cardama, A.: Fractal-shaped antennas, in: Frontiers in electromagnetics, edited by Werner, D. and Mit-tra, R., pp. 785, IEEE Press, 1999.
Reches, Z. and Lockner, D.: Nucleation and growth of faults in brittle rocks, J. Geophys. Res., 99, 18 159–18 173, 1994. Saleur, H., Sammis, C., and Sornette, D.: Discrete scale invariance,
complex fractal dimensions, and log-periodic fluctuations in seis-micity, J. Geophys. Res., 101, 17 661–17 667, 1996a.
Saleur, H., Sammis, C., and Sornette, D.: Renormalization group theory of Earthquakes, Nonlin. Proc. Geophys., 3, 102–109, 1996b.
Sammis, C. and Smith, S.: Seismic cycles and the evolution of stress correlation in cellular automaton models of finite fault networks, Pure Appl. Geophys., 155, 307–334, 1999.
Sarlis, N., Lazaridou, M., Kapiris, P., and Varotsos, P.: Numerical model of the selectivity effect and the 1V /L criterion, Geophys. Res. Lett., 23, 1441–1444, 1999.
Schmittbuhl, J., Schmitt, F., and Scholz, C.: Scaling invariance of crack surfaces, J. Geophys. Res., 100, 5953–5973, 1995. Smirnova, N., Hayakawa, M., Gotoh, K., and Volobuev, D.: Scaling
characteristics of ulf geomagnetic field at Guam seismo active area and their dynamics in relation to the Earthquake, Natural Hazard Earth System Sci., 1, 119–126, 2001.
Sornette, A. and Sornette, D.: Earthquake rupture as a critical point: Consequences for telluric precursors, Tectonophysics, 179, 327– 334, 1990.
Sornette, D.: Critical Phenomena in Natural Sciences, Springer, 2000.
Sornette, D. and Sammis, C.: Complex critical exponents from renormalization group theory of Earthquakes: Implications for Earthquake predictions, J. Phys. I., 5, 607–619, 1995.
Sorokin, V. and Chmyrev, V.: The physical model of electromag-netic and plasma of the ionosphere on the pre-Earthquake pro-cesses, in: Atmospheric and ionospheric electromagnetic phe-nomena associated with Earthquakes, edited by Hayakawa, M., pp. 819–828, Terrapub, Tokyo, 1999.
Surkov, V., Uyeda, S., Tanaka, H., and Hayakawa, M.: Fractal prop-erties of medium and seismoelectric phenomena, J. Geodynam-ics, 33, 477–487, 2002.
Telesca, L. and Lapenna, V.: A new approach to investigate the correlation between geoelectrical time fluctuations and Earth-quakes in a seismic area of southern Italy, Geophys. Res. Lett., 28, 4375–4378, 2001.
Torrence, C. and Compo, P.: A practical guide to wavelet analysis, Bull. Amer. Meteor. Soc., 79, 61–78, 1998.
Turcotte, D.: Fractals and chaos in geology and geophysics, Cam-bridge University Press, 1992.
Uyeda, S.: Introduction to the VAN method of Earthquake predic-tion, in: A critical review of VAN-Earthquake Prediction from Seismic Electric Signals, edited by Lighthill, S. J., pp. 3–28, World Scientific Publishing Co., Singapore, 1996.
Vallianatos, F. and Nomikos, K.: Seismogenic radioemissions as Earthquake precursors in Greece, Phys. Chem. Earth, 23, 953– 957, 1998.
Vanneste, C. and Sornette, D.: Dynamics of rupture in thermal fuse models, J. Phys. I France, 2, 1621–1644, 1992.
Varotsos, P., Lazaridou, M., Eftaxias, K., Antonopoulos, G., Makris, J., and Kopanas, J.: Short-term Earthquake prediction in Greece by seismic electric signals, in: A Critical Review of VAN: Earthquake prediction from Seismic Electric Signals, edited by Ligthhill, S. J., pp. 29–76, World Scientific Publishing Co., Sin-gapore, 1996.
Varotsos, P., Sarlis, N., Lazaridou, M., and Kapiris, P.: Transmis-sion of stress induced electric signals in dielectric media, J. App. Phys., 83, 60–70, 1998.
Varotsos, P., Sarlis, N., and Skordas, E.: Long-range correlations in the electric signals that precede rupture, Phys. Rev. E, 66, 011 902 1–7, 2002.
Werner, D.: An overview of fractal electrodynamics research, Proc. of the 11th Annual Review of Progress in Applied Computational Electromagnetics (ACES), II, 964–969, 1995.
Yamada, I., Masuda, K., and Mizutani, H.: Electromagnetic and acoustic emission associated with rock fracture, Physics of the Earth and Planetary Interiors, 57, 157–168, 1989.
Yannopapas, V., Modinos, A., and Stefanou, N.: Scattering and ab-sorption of light by periodic and nearly periodic metallodielectric structures, Optical and Quantum Electronics, 34, 227–234, 2002. Yariv, A., Xu, Y., Lee, R., and Scherer, A.: Coupled-resonator opti-cal waveguide: a proposal and analysis, Optics Letters, 24, 711– 713, 1999.
Zoller, G. and Hainzl, S.: A systematic spatiotemporal test of the critical point hypothesis for large Earthquakes, Geophys. Res. Lett., 29, 53/1–53/4, 2002.
Zoller, G., Hainzl, S., and Kurths, J.: Observations of growing cor-relation length as an indicator for critical point behaviour prior to large Earthquakes, J. Geophys. Res., 106, 2167–2175, 2001.