HAL Id: hal-00302794
https://hal.archives-ouvertes.fr/hal-00302794
Submitted on 22 May 2007HAL is a multi-disciplinary open access
archive for the deposit and dissemination of sci-entific research documents, whether they are pub-lished or not. The documents may come from teaching and research institutions in France or abroad, or from public or private research centers.
L’archive ouverte pluridisciplinaire HAL, est destinée au dépôt et à la diffusion de documents scientifiques de niveau recherche, publiés ou non, émanant des établissements d’enseignement et de recherche français ou étrangers, des laboratoires publics ou privés.
An Asian emission inventory of anthropogenic emission
sources for the period 1980?2020
T. Ohara, H. Akimoto, J. Kurokawa, N. Horii, K. Yamaji, X. Yan, T.
Hayasaka
To cite this version:
T. Ohara, H. Akimoto, J. Kurokawa, N. Horii, K. Yamaji, et al.. An Asian emission inventory of anthropogenic emission sources for the period 1980?2020. Atmospheric Chemistry and Physics Discussions, European Geosciences Union, 2007, 7 (3), pp.6843-6902. �hal-00302794�
ACPD
7, 6843–6902, 2007
An Asian emission inventory for the period 1980–2020 T. Ohara et al. Title Page Abstract Introduction Conclusions References Tables Figures ◭ ◮ ◭ ◮ Back Close
Full Screen / Esc
Printer-friendly Version
Interactive Discussion
EGU Atmos. Chem. Phys. Discuss., 7, 6843–6902, 2007
www.atmos-chem-phys-discuss.net/7/6843/2007/ © Author(s) 2007. This work is licensed
under a Creative Commons License.
Atmospheric Chemistry and Physics Discussions
An Asian emission inventory of
anthropogenic emission sources for the
period 1980–2020
T. Ohara1,2, H. Akimoto2, J. Kurokawa1, N. Horii3, K. Yamaji2, X. Yan4, and T. Hayasaka5
1
National Institute for Environmental Studies, Tsukuba, Ibaraki, Japan
2
Frontier Research Center for Global Change, Japan Agency for Marine Science and Technology, Yokohama, Japan
3
Institute of Developing Economies, IDE-JETRO, Chiba, Japan
4
Institute of Soil Science, Chinese Academy of Sciences, Nanjing, China
5
Research Institute for Humanity and Nature, Kyoto, Japan
Received: 26 March 2007 – Accepted: 3 May 2007 – Published: 22 May 2007 Correspondence to: T. Ohara ([email protected])
ACPD
7, 6843–6902, 2007
An Asian emission inventory for the period 1980–2020 T. Ohara et al. Title Page Abstract Introduction Conclusions References Tables Figures ◭ ◮ ◭ ◮ Back Close
Full Screen / Esc
Printer-friendly Version
Interactive Discussion
EGU
Abstract
We developed a new emission inventory for Asia (Regional Emission inventory in ASia (REAS) Version 1.1) for the period 1980–2020. REAS is the first inventory to inte-grate historical, present, and future emissions in Asia on the basis of a consistent methodology. We present here emissions in 2000, historical emissions for 1980–2003,
5
and projected emissions for 2010 and 2020 of SO2, NOx, CO, NMVOC, black carbon
(BC), and organic carbon (OC) from fuel combustion and industrial sources. Total en-ergy consumption in Asia more than doubled between 1980 and 2003, causing a rapid growth in Asian emissions, by 28% for BC, 30% for OC, 64% for CO, 108% for NMVOC, 119% for SO2, and 176% for NOx. In particular, Chinese NOx emissions showed a
10
marked increase of 280% over 1980 levels, and growth in emissions since 2000 has been extremely high. These increases in China were mainly caused by increases in coal combustion in the power plants and industrial sectors. NMVOC emissions also rapidly increased because of growth in the use of automobiles, solvents, and paints. By contrast, BC, OC, and CO emissions in China showed decreasing trends from 1996
15
to 2000 because of a reduction in the use of biofuels and coal in the domestic and in-dustry sectors. However, since 2000, Chinese emissions of these species have begun to increase. Thus, the emissions of air pollutants in Asian countries (especially China) showed large temporal variations from 1980–2003. Future emissions in 2010 and 2020 in Asian countries were projected by emission scenarios and from emissions in 2000.
20
For China, we developed three emission scenarios: PSC (policy success case), REF (reference case), and PFC (policy failure case). In the 2020 REF scenario, Asian to-tal emissions of SO2, NOx, and NMVOC were projected to increase substantially by 22%, 44%, and 99%, respectively, over 2000 levels. The 2020 REF scenario showed a modest increase in CO (12%), a lesser increase in BC (1%), and a slight decrease
25
in OC (–5%) compared with 2000 levels. However, it should be noted that Asian total emissions are strongly influenced by the emission scenarios for China.
ACPD
7, 6843–6902, 2007
An Asian emission inventory for the period 1980–2020 T. Ohara et al. Title Page Abstract Introduction Conclusions References Tables Figures ◭ ◮ ◭ ◮ Back Close
Full Screen / Esc
Printer-friendly Version
Interactive Discussion
EGU
1 Introduction
Anthropogenic emissions in Asia are larger than those in Europe and North America today and will continue to increase in the future (Akimoto, 2003). In fact, recent tro-pospheric satellite observations have demonstrated that NOx emissions in China have accelerated impressively since 2000 (Irie et al., 2005; Richter et al., 2005). In light of
5
this situation, the development of Asian emission inventories for the past, present, and future is very important for the understanding and management of the regional and global atmospheric environment.
There are comparatively few Asian inventories of anthropogenic emission sources from East, Southeast, or South Asia. The first Asian inventory was developed by Kato
10
and Akimoto (1992) and Akimoto and Narita (1994); it reported SO2 and NOx
emis-sions for 1975, 1980, and 1985–1987. Recently, Streets et al. (2003) developed an emission inventory for use during the ACE-Asia (Asian Pacific Regional Aerosol Char-acterization Experiment) and TRACE-P (Transport and Chemical Evolution over the Pacific) field campaigns carried out in the East Asia and the Western Pacific region in
15
spring 2001. The campaigns focused on the characterization of gaseous and aerosol species in Asian outflows to the western Pacific Ocean, and the inventories included SO2, NOx, CO, nonmethane volatile organic compounds (NMVOC), black carbon (BC),
organic carbon (OC), NH3, and CH4. Twenty-two countries and regions in East, South-east, and South Asia were included, and 1◦
×1◦ grid maps for the base year (2000)
20
were provided. The Regional Air Pollution Information and Simulation (RAINS-Asia) is a project organized by the International Institute for Applied Systems Analysis (IIASA) and funded by the World Bank for the purpose of constructing a policy tool for the mit-igation of acid rain in Asia (Downing et al., 1997). In this study, emission inventories for SO2 with base years of 1990 and 1995, and also projections from 2000 to 2030,
25
were estimated, and the results are available on a CD-ROM (IIASA, 2001). The global emission inventories EDGAR (Emission Database for Global Atmospheric Research; Olivier et al., 1999) and the IIASA inventory (Cofala et al., 2006) naturally include Asian
ACPD
7, 6843–6902, 2007
An Asian emission inventory for the period 1980–2020 T. Ohara et al. Title Page Abstract Introduction Conclusions References Tables Figures ◭ ◮ ◭ ◮ Back Close
Full Screen / Esc
Printer-friendly Version
Interactive Discussion
EGU emissions.
Despite the importance of understanding annual variations in past air quality, only a few attempts have been made to estimate the time series of historical Asian emis-sions. Streets et al. (2000, 2001a) reported trends in country-based emissions of SO2
and NOx in Asia during 1985 and 1997; their data were based on the RAINS-Asia
5
emission inventory. Global gridded emissions of CO2, CO, CH4, NMVOC, SO2, NOx,
N2O, and NH3 by sector for the period 1890–1990 have been estimated by Van
Aar-denne et al. (2001). The emissions data set EDGAR-HYDE was estimated by using historical activity data from the HYDE database (Klein Goldewijk and Battjes, 1997) and historical emission factors based on the uncontrolled emission sources included in
10
EDGAR. However, year-by-year emissions after 1990, which can be expected to show marked variations in Asian countries, were not included.
Future changes in the air quality in Asia will be affected strongly by the expected growth in anthropogenic emissions, which are controlled by economic growth, environ-mental policy, and future implementation of emissions controls. Projections of Asian
15
emissions have been made by Van Aardenne et al. (1999) for NOx, Streets and Wald-hoff (2000) for SO2, NOx, and CO, and Klimont et al. (2001) for SO2, NOx, NH3, and
NMVOC. Additionally, Asian emissions have been projected as part of the estimations of global emissions of SO2, NOx, CO, and NMVOC (Cofala et al., 2006) and of
car-bonaceous particles (Streets et al., 2004).
20
Thus, it is very important to develop a historical and future emission inventory for multiple species and years covering the whole of Asia. We have developed a new Asian emission inventory (Regional Emission inventory in ASia (REAS), Version 1.1) for the 40 years from 1980 to 2020. REAS is the first inventory to integrate historical, current, and future emissions data for Asia on the basis of a consistent methodology.
25
Table 1 demonstrates the emission sources and chemical species targeted by REAS. The REAS inventory includes NOx, SO2, CO, BC, OC, CO2, N2O, NH3, CH4, and NMVOC from anthropogenic activities (combustion, non-combustion, agriculture, and others). The methodology and results for NOx, N2O, NH3, and CH4 emissions from
ACPD
7, 6843–6902, 2007
An Asian emission inventory for the period 1980–2020 T. Ohara et al. Title Page Abstract Introduction Conclusions References Tables Figures ◭ ◮ ◭ ◮ Back Close
Full Screen / Esc
Printer-friendly Version
Interactive Discussion
EGU agricultural sources are explained by Yamaji et al. (2003, 2004) and Yan et al. (2003a,
b, c). Open biomass burning is not yet included in REAS.
Here, we focus on the emissions of NOx, SO2, BC, OC, CO, and NMVOC from
fuel combustion and non-combustion sources. Section 2 describes the methodology used in REAS to estimate emissions, including activity data, emission factors, emission
5
scenarios in 2010 and 2020, and grid allocation. Section 3, the results and discussion, covers four topics: (1) Asian and national emissions in 2000; (2) historical emissions between 1980 and 2003; (3) projections of future emissions in 2010 and 2020; and (4) gridded emissions in Asia. Conclusions and a summary are given in Sect. 4.
2 Methodology
10
2.1 Basic methodology
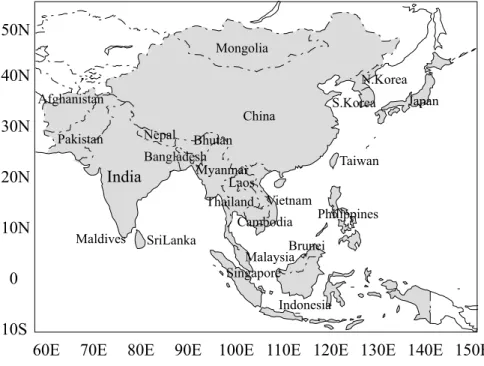
The target domain of REAS covers 24 countries in East, Southeast, and South Asia (Fig. 1). Emissions were estimated on the basis of activity data at district levels for China (30 provinces), India (20 states), Japan (6 regions), South Korea (4 sub-regions), and Pakistan (5 sub-regions). For the other countries, national emissions
15
were estimated on the basis of activity data at the national level.
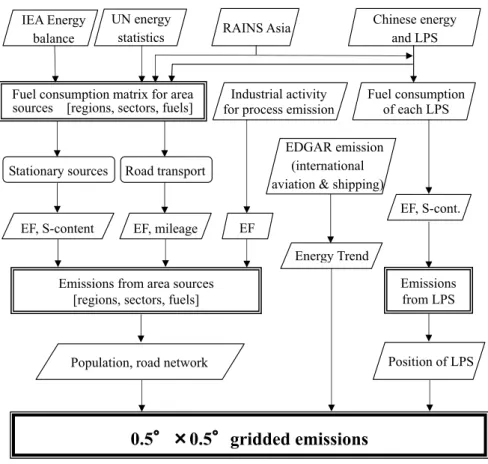
Figure 2 demonstrates the general methodology for the emission estimates in REAS. We estimated the emissions from fuel combustion sources and non-combustion sources as part of anthropogenic activities: transformation (power) sectors (electric-ity and heat production, oil refineries, manufacture of solid fuels, and other energy
20
and transformation industries); industry sectors (including iron and steel, chemical and petrochemical, non-ferrous metals, and non-metallic minerals); transport sectors (in-cluding aviation, roads, railways, and shipping); and other (mainly domestic) sectors (including agriculture, commerce and public, and residential). Emissions of a particular species were estimated as a product of the activity data, emission factors, and removal
25
ACPD
7, 6843–6902, 2007
An Asian emission inventory for the period 1980–2020 T. Ohara et al. Title Page Abstract Introduction Conclusions References Tables Figures ◭ ◮ ◭ ◮ Back Close
Full Screen / Esc
Printer-friendly Version
Interactive Discussion
EGU species from subdivided source sectors were developed from a wide range of sources
(published or unpublished information) and were used to estimate emissions on district and country levels. These emissions, estimated on district and country levels, were divided into a 0.5◦
×0.5◦ grid by using index databases, i.e. population data; informa-tion on the posiinforma-tions of large point sources (LPSs); land cover data sets; and land
5
area data sets. Here, we give the methodology, data, and data sources of the emis-sion estimations in this inventory. Emisemis-sions from fuel combustion sources, including 20 economic sectors and 36 fuel types, were estimated in REAS. Emissions of SO2 and other species (except NMVOC) from stationary sources were estimated by using Eqs. (1) and (2), respectively.
10
E=(A/NCV) × S × (1−SR) × (1−R) (1)
E: SO2emissions [kg]
A: Energy consumption [J] NCV: Net calorific value [J kg−1]
S: Sulfur content of fuel [kg kg−1]
SR: Sulfur retention in ash [–] R: Removal efficiency [–]
E=A × EF × (1−R) (2)
E: Emissions [kg]
A: Energy consumption [J] EF: Emission factor [kg J−1]
R: Removal efficiency [–]
For road transport, emissions of SO2, NOx, CO, BC, and OC were estimated by the 15
following equation:
ACPD
7, 6843–6902, 2007
An Asian emission inventory for the period 1980–2020 T. Ohara et al. Title Page Abstract Introduction Conclusions References Tables Figures ◭ ◮ ◭ ◮ Back Close
Full Screen / Esc
Printer-friendly Version
Interactive Discussion
EGU
E: Emissions [kg]
A: Energy consumption [J] EF: Emission factor [kg m−1]
FE: Fuel economy [m L−1]
SG: Specific gravity [kg L−1]
NCV: Net calorific value [J kg−1]
We classified on-road vehicles into seven types (light-duty gasoline vehicles, heavy-duty gasoline vehicles, light-heavy-duty diesel vehicles, heavy-heavy-duty diesel vehicles, gasoline buses, diesel buses, and motorcycles). Motor gasoline and diesel oil consumption was distributed to each vehicle type by using traffic volume and fuel economy data,
5
and then the emissions were estimated by using country-specific emission factors by vehicle type.
Additionally, REAS includes SO2emissions from non-ferrous metals and sulfuric acid
production and CO emissions from iron and steel production. These non-combustion emissions were estimated by industrial activity data and process emission factors.
10
NMVOC emissions for 1995 and 2000 were not estimated independently in the present version; they were obtained from Klimont et al. (2002) and Streets et al. (2003).
The emissions from aviation and international shipping in 2000 were estimated from the gridded data for 1995 in EDGAR 3.2 (http://www.mnp.nl/edgar/model/edgarv32/), the rates of change in energy consumption (country value for aviation and Asian total
15
value for international shipping) from 1995 to 2000 in the International Energy Agency (IEA) Energy Balances (2004), and BC and OC emission factors (Cass et al., 1982).
Regional- or country-based emission data, excluding LPSs data, were broken down into grid data with a 0.5◦
×0.5◦ resolution by using three kinds of allocation factor: (1) road networks, provided by Streets et al. (2003), for road transport sources; (2) rural
20
populations, provided by Streets et al. (2003), for biofuel combustion in the domes-tic sector and all fuel combustion in the agricultural sector; and (3) total populations, extracted from the Land Scan Global Population database developed by Oak Ridge National Laboratory (ORNL, 2001), for other area sources. We assumed that the
spa-ACPD
7, 6843–6902, 2007
An Asian emission inventory for the period 1980–2020 T. Ohara et al. Title Page Abstract Introduction Conclusions References Tables Figures ◭ ◮ ◭ ◮ Back Close
Full Screen / Esc
Printer-friendly Version
Interactive Discussion
EGU tial distributions of these allocation factors did not vary in the period 1980–2020. In
China, power plants with capacities over 100 MW are treated as LPSs. Information on the locations and fuel consumption of LPSs in China was provided from some in-stitutes related to China State Grid Company. For other countries LPSs information was obtained from RAINS-Asia. In this study, the numbers of LPSs in China and other
5
countries were taken to be 436 and 87, respectively. 2.2 Activity data
Table 2 shows fuel consumption by region, sector, and fuel type between 1980 and 2003. Fuel consumption data from IEA Energy Balances (IEA, 2004) were used for most of the countries, except for the period 1996–2003 in China for reasons described
10
below. For countries whose fuel consumption data were not included in the IEA data, those from RAINS-Asia (IIASA, 2001) and the UN Energy Statistics Yearbook (United Nations, 1983–2004) were used. The IEA fuel consumption data for China are dis-tributed to each province by using the China Energy Statistical Yearbook (CESY; Na-tional Bureau of Statistics, 1997–2004). For India, the total fuel consumption in the
15
IEA data are subdivided into the fuel consumption for each Indian region by using the RAINS-Asia data.
In constructing the REAS, particular concern was paid to the coal consumption trend in China during 1996–2000, which, according to CESY and IEA statistics, was decreas-ing. These data were verified from GOME satellite observational data for tropospheric
20
NO2column density in the North China Plain (Akimoto et al., 2006). The NO2 column increase from 1996–2002 averaged for the two reports was about 50%, whereas the NOx emission increases based on the province-by-province data in the China Energy Statistics Yearbook (PBP-CESY) and the IEA data were 25% and 15%, respectively. The country-total data from CESY were even lower than the PBP-CESY and IEA data.
25
The discrepancy in increasing trends between the satellite data and the PBP-CESY emission inventory could be within the uncertainty level, with the reservation that the in-crease in total fuel consumption in PBP-CESY may still be underestimated, particularly
ACPD
7, 6843–6902, 2007
An Asian emission inventory for the period 1980–2020 T. Ohara et al. Title Page Abstract Introduction Conclusions References Tables Figures ◭ ◮ ◭ ◮ Back Close
Full Screen / Esc
Printer-friendly Version
Interactive Discussion
EGU since 1999. After performing these verifications we adopted the fossil fuel
consump-tion data of PBP-CESY for 1996–2003. Recently, statistical data on coal consumpconsump-tion were modified to higher values in the China Statistical Yearbook (National Bureau of Statistics, 2006), and this fact may support our conclusion.
Biofuel consumption was obtained from other data sources. For China, the
provin-5
cial consumption of biofuel for 1995 or 2000 was obtained from Yan et al. (2006) and RAINS-Asia. For other countries, regional consumption data for 1990 or 1995 in RAINS-Asia were used. Data for the period 1980–2000 were extrapolated from these data of regional biofuel consumption for 1990 or 1995 or 2000 by using interna-tional statistics for fuelwood (FAO, 2000) and primary solid biomass (IEA, 2004). For
10
non-combustion sources, an industrial activity data set (production of non-ferrous met-als, sulfuric acid, iron, and steel) was derived from international statistics (e.g., USGS Minerals Yearbook, 2006; UN Statistics Yearbook, 1983–2004).
2.3 Emission factors
Emission factors were determined for each of the sectors, fuels, and countries for 1995
15
and 2000. Table 3 shows the mean emission factors for fuel combustion in 2000. Emission factors by economic sector, fuel type, combustion facility, country, and region were compiled from a wide range of literature, such as Kato et al. (1991), Kato and Aki-moto (1992), AP-42 (US EPA, 1999), the IPCC Guideline (1997), the EMEP/CORINAIR Emission Inventory Guidebook (EEA, 2000), and Streets et al. (2003). Emission
fac-20
tors for other years in the period 1980–2003 were then estimated by using the emission control levels in each country. Because the historical data for emission factors were unavailable, it was assumed that the emission factors (except for those from some stationary sources in some developed countries and from the automobile sources in many countries) did not vary throughout the period. For Japan, the time variations of
25
country-specific emissions factors in the period 1980–2003 were determined from a large number of domestic research reports (e.g. Kannari et al., 2007).
ACPD
7, 6843–6902, 2007
An Asian emission inventory for the period 1980–2020 T. Ohara et al. Title Page Abstract Introduction Conclusions References Tables Figures ◭ ◮ ◭ ◮ Back Close
Full Screen / Esc
Printer-friendly Version
Interactive Discussion
EGU of oil (motor gasoline, kerosene, heavy fuel oil, and diesel oil) in China for pre-1980,
1990, 1995, and 2000 were determined from the information of Kato et al. (1991), Streets et al. (2000), and the China Coal Industry Yearbook 2002 (State Administration for Coal Safety, 2003). Because SO2 emissions in China depended strongly on the sulfur content of coal, province-by-province data for power plants and other sectors
5
were used in this estimation. The average sulfur content of coal in China was 1.35% pre-1985, 1.27% in 1990, 1.12% in 1995, and 1.08% in 2000. A simple interpolation was used to generate values for each year during the period 1985–2000. For India, we prepared state-by-state data on the sulfur content of coal on the basis of the data reported by Reddy et al. (2001a). For other countries, the RAINS-Asia and Kato et
10
al. (1991) databases on sulfur content in fuel were used. On the basis of Streets et al. (2000) and others, adjustments were made to account for the reduction in sulfur content by national regulation in Japan, Taiwan, South Korea, Hong Kong, Singapore, and Thailand during the period 1990–2000. It was assumed that sulfur retention values in ash were 5% to 30% (depending on country, sector, and coal type) for coal and 0%
15
for other fuels.
SO2 emission factors for oil (excluding motor gasoline, kerosene, heavy fuel oil, and diesel oil), and gas were provided mainly from Kato et al. (1991), AP-42, the IPCC Guideline, and the EMEP/CORINAIR Guidebook and were provided from Garg et al. (2001) for biofuel. After 1990, the efficiencies of removal of SO2by desulfuriza-20
tion were defined for power plants, industry, and oil refineries on the basis of Wang et al. (2000) in the case of China and RAINS-Asia for other countries. Because post-2000 data were unavailable, it was assumed that these parameters remained constant after 2000.
NOx emission factors, excluding those from automobile sources, were derived from
25
Kato et al. (1991), AP-42, the IPCC Guideline, and the EMEP/CORINAIR Guidebook. Additionally, Streets et al. (1998), and Zhang et al. (2000) were used. Because NOx emissions in the developed countries of Asia depended on emission controls after the 1980s, these effects were reflected in the emission factors and removal efficiencies for
ACPD
7, 6843–6902, 2007
An Asian emission inventory for the period 1980–2020 T. Ohara et al. Title Page Abstract Introduction Conclusions References Tables Figures ◭ ◮ ◭ ◮ Back Close
Full Screen / Esc
Printer-friendly Version
Interactive Discussion
EGU Japan, Taiwan, South Korea, Hong Kong, and Singapore (where national regulations
are applied to major stationary sources, especially in the case of power plants and in-dustry sectors), based on information in RAINS-Asia. For other countries, uncontrolled emission factors were used throughout the period 1980–2003.
Excluding emissions from automobile sources, the BC and OC emission factors for
5
1995 and 2000 were provided by Streets et al. (2001b, 2003). These emission factors were classified into those for developed countries (Japan, South Korea, Taiwan, Hong Kong, and Singapore) and other countries known to have no emission controls. For the other countries it was assumed that the emission factors, which were considered to be uncontrolled, did not vary throughout the period 1980–2003. On the other hand, the
10
emission factors for developed countries were changed in the period 1980–2003: (1) before 1985, emission factors were uncontrolled; (2) between 1985 and 1995 emission factors were interpolated from the 1985 and 1995 values; (3) between 1995 and 2000 emission factors were interpolated from the 1995 and 2000 values; and (4) after 2000 emission factors for 2000 were used.
15
CO emission factors, excluding those from automobile sources, were derived from Kato et al. (1991), AP-42, the IPCC Guideline, and the EMEP/CORINAIR Guidebook. Additionally, Veldt and Berdowski (1995), Zhang et al. (2000), and Streets et al. (2003) were used for biofuel emissions. Recently, Streets et al. (2006) updated the a priori Chinese CO emission inventory (Streets et al., 2003) by making some improvements in
20
the emission factors for industrial sectors. These estimates for Chinese CO emissions in 2001 were 31% higher than the former estimates for 2000 (Streets et al., 2003) and agreed with some of the results obtained by inverse and forward modeling. This increase was caused mainly by some improvements in the emission factors from coal combustion. Therefore, we based our emission factors for coal combustion in power
25
plants, by industry, and by the residential sector on the data of Streets et al. (2006). However, for residential coal combustion we selected an emission factor (150 kg/t), which was the close to the average of the value for hand-feed stokers (124 kg/t) by Streets et al. (2006) and the maximum value for coal stoves (170 kg/t) by Zhang et
ACPD
7, 6843–6902, 2007
An Asian emission inventory for the period 1980–2020 T. Ohara et al. Title Page Abstract Introduction Conclusions References Tables Figures ◭ ◮ ◭ ◮ Back Close
Full Screen / Esc
Printer-friendly Version
Interactive Discussion
EGU al. (1999). These are comparatively rough assumptions and need to be improved in
future. These emission factors were considered invariant throughout the period 1980– 2003 in all developing countries.
Automobile emissions in the period 1980–2003 were calculated by using country-specific emission factors under country-country-specific emission controls. For Japan,
year-by-5
year emissions factors for the period 1980–2003 were developed from a large number of domestic research reports. For other countries the emission factors were determined by the following method. We were able to collect the NOx emission factors for around 1995 in several modeled countries (China, South Korea, Taiwan, Thailand, Philippines, Indonesia, and India). Other countries were assigned the emission factors of those
10
modeled countries that they resembled. For CO, BC, and OC the emission factors for 2000 were obtained from Streets et al. (2003). These emission factors were used as the values for the base year of 1995 or 2000. For other years we calculated the emis-sions by using the emission factor for the base year and country-specific information (Minato, 2002; Nissan Automobile Corporation, 2005) on emission controls and car
15
age profiles.
Process emission factors were gathered from Kato et al. (1991) and Kato and Aki-moto (1992) for SO2emissions and from Streets et al. (2003) for CO emissions. They
were invariable throughout the period 1980–2003. Finally, NMVOC emissions for the period 1980–2003 were calculated by an extrapolation of NMVOC emissions for 1995
20
and 2000 by using an appropriate indicator per sector. Emissions from fuel combustion sources were scaled in time by using fuel consumption data. National production or fuel (gas and oil) consumption was used to scale non-combustion emissions related to fuel use. For other sectors the Gross Domestic Product (GDP) was used as a scaling factor (provinces of China: China Statistical Yearbook; other countries: World Bank,
25
ACPD
7, 6843–6902, 2007
An Asian emission inventory for the period 1980–2020 T. Ohara et al. Title Page Abstract Introduction Conclusions References Tables Figures ◭ ◮ ◭ ◮ Back Close
Full Screen / Esc
Printer-friendly Version
Interactive Discussion
EGU 2.4 Projection of future emissions
Future projection of Asian emissions was performed on the basis of emission scenarios and emissions for 2000. Three emission scenarios for China have been developed for the years 2010 and 2020 by Zhou et al. (2003). The socioeconomic indices, such as population, urbanization, and GDP, are almost the same under these scenarios. The
5
population in 2020 (1.45–1.49 billion) is about equal to that of the IPCC B2 scenario (1.45 billion) (Nakicenovic and Swart, 2000). The GDP growth rate from 2000 to 2020 (7.3% y−1 before 2010 and 6.7% y−1 after 2010) is close to that of the A2 scenario of
IPCC (7% y−1) (Nakicenovic and Swart, 2000).
The first scenario was termed the Policy Failed Case scenario, or PFC. This is a
10
pessimistic scenario with high emission rates caused by continuation of the current energy structure, increased energy consumption, and the slow deployment of new en-ergy technologies and new emission control technologies. The second scenario was termed the Reference scenario, or REF. This was a sustainable scenario with moder-ate emission rmoder-ates caused by the suppression of energy consumption through energy
15
conservation, a change to clean energy, and the moderate deployment of new energy technologies and new emission control technologies. We considered that this repre-sented our “best guess” as to what emissions in Asia will be in 2010 and 2020. The third scenario was termed the Policy Succeed Case scenario, or PSC. This was the optimistic case, with low emission rates owing to the implementation of strong energy
20
and environmental policies and the fast deployment of new energy technologies and new emission control technologies. Each concept–PSC, REF, and PFC–resembled that of the B1 scenario, the B2 scenario, and the A2 scenario of IPCC (Nakicenovic and Swart, 2000), respectively.
In the research project of the China Energy Research Institute and National
25
Lawrence Berkley Laboratory (Zhou et al., 2003), fuel consumptions under the PSC, REF, and PFC scenarios were provided from forecasts by a simulation model, the Long-range Energy Alternatives Planning system (LEAP; available athttp://forum.seib.
ACPD
7, 6843–6902, 2007
An Asian emission inventory for the period 1980–2020 T. Ohara et al. Title Page Abstract Introduction Conclusions References Tables Figures ◭ ◮ ◭ ◮ Back Close
Full Screen / Esc
Printer-friendly Version
Interactive Discussion
EGU org/leap), developed by the Stockholm Environment Institute. Chinese fuel
consump-tion for the years 2010 and 2020 are presented in Fig. 3. Total fuel consumpconsump-tion in China in 2010 was 1.22 (PSC), 1.30 (REF), and 1.35 (PFC) times that in 2000. There is expected to be a further marked increase by 2020. There should be increases in fuel consumption of 39% (PSC), 63% (REF), and 77% (PFC), between 2000 and 2020. In
5
particular, the differences in coal consumption by power plants between the three sce-narios are important to note. For other countries, fuel consumption in 2010 and 2020 was calculated on the basis of Reference Scenario Projections in the “World Energy Outlook” (IEA, 2002).
Changes in emission factors were considered only in terms of the following: (1) the
10
efficiencies of removal of SO2by the power plants and industry sector under the three
scenarios in China (Wang et al., 2002). For other countries, removal efficiencies by power plants were set on the basis of RAINS-Asia and on the assumption that these would be 99% in 2030; (2) the emission factors of NOx for power plants under the three scenarios in China. It was assumed that those in 2020 would be the same as
15
the Japanese values for the year 2000 under the PSC scenario, as the Chinese 2000 values under the PFC scenario, and as the average values of those for PSC and PFC scenarios under the REF scenario. For other countries, efficiencies of removal by power plants were set on the assumption that the 2030 values would reach the new technology level in RAINS-Asia; and (3) for the road transport sector, country-specific
20
information on emission controls (Nissan Automobile Corporation, 2005).
Non-combustion emissions in 2010 and 2020 were estimated by using 2000 emis-sions and the increment rate of GDP under each scenario, except in the case where data on the industrial production of iron, cement, and some metals were available for the three scenarios in China. NMVOC emissions were estimated by extrapolation of
25
NMVOC emissions for 2000 by using national or regional values of fuel consumption for fuel combustion and non-combustion sources related to fuel use, and of GDP for other emission sources.
ACPD
7, 6843–6902, 2007
An Asian emission inventory for the period 1980–2020 T. Ohara et al. Title Page Abstract Introduction Conclusions References Tables Figures ◭ ◮ ◭ ◮ Back Close
Full Screen / Esc
Printer-friendly Version
Interactive Discussion
EGU
3 Results and discussion
3.1 Asian and national emissions in 2000
Table 4 summarizes national emissions in 2000 and Table 5 shows regional emissions in 2000 by emitting sector and fuel type.
3.1.1 SO2
5
Total Asian emissions of SO2 was 42.8 Mt in 2000; China at 27.6 Mt (65%) and India
at 6.1 Mt (14 %) were the high-emission countries. In terms of sectoral and fuel-type contribution, emissions from coal combustion were dominant (70%); in particular, those from power plants and industry were major sources with 35% and 28%, respectively, of total emissions. In China, the country with the highest emission rates, the contribution
10
of coal combustion to total emissions was as high as 84%. In India, the country with the second-highest emission rate, emissions from coal-burning power plants accounted for around half (47%), whereas the contribution of emissions from coal combustion to the total emissions (58%) was smaller than that of China (84%).
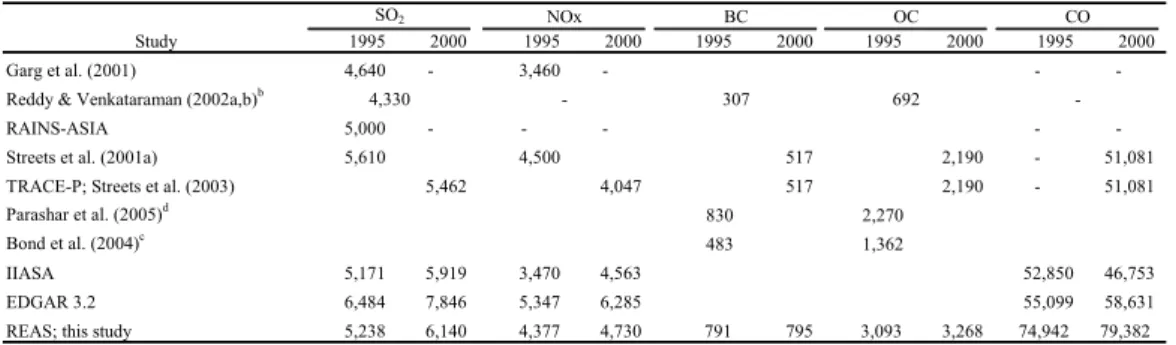
Table 6 shows the emissions for 2000 from different inventories, excluding emissions
15
from international aviation and shipping and from open biomass burning. We compared the values in the Asian inventories REAS and TRACE-P (Streets et al., 2003) and the global inventories IIASA (http://www.iiasa.ac.at/rains/global emiss/global emiss1.html) and EDGAR 32FT2000 (http://www.mnp.nl/edgar/model/v32ft2000edgar/). For Asian emission of SO2, the REAS value (41.2 Mt) was the same as the IIASA one (41.2 Mt), 20
whereas the TRACE-P value (32.9 Mt) was 20% lower and that of EDGAR (56.0 Mt) was 36% higher than that of REAS. The distributions of emissions among sectors in REAS and IIASA were similar (data not shown).
Table 7 compares the Chinese emissions from 1995 to 2003 according to REAS and other inventories, including the values estimated by the State Environmental Protection
25
ACPD
7, 6843–6902, 2007
An Asian emission inventory for the period 1980–2020 T. Ohara et al. Title Page Abstract Introduction Conclusions References Tables Figures ◭ ◮ ◭ ◮ Back Close
Full Screen / Esc
Printer-friendly Version
Interactive Discussion
EGU (27.6 Mt) was almost the same as the IIASA one (27.7 Mt) but higher than those of
SEPA (20.0 Mt) and TRACE-P (20.3 Mt). The main reason is the differences in fuel consumption values used in each inventory: total fuel consumption used in TRACE-P (Streets et al., 2003) was 36 201 TRACE-PJ (coal consumption 18 189 TRACE-PJ), whereas that used in REAS was 44 520 PJ (coal consumption 26 797 PJ) – 1.23 times the total fuel
5
consumption and 1.47 times the coal in TRACE-P. These differences reflect the fact that coal consumption for 2000 in PBP-CESY, which was used in REAS, was 1.5 times that in CESY (Akimoto et al., 2006). On the other hand, EDGAR estimated emissions in China in 2000 to be 34.2 Mt – much higher than the values used in other inventories. Table 8 compares the Indian emissions for 1995 and 2000 as estimated by REAS
10
and other inventories. For SO2 emissions in 2000 in India, REAS estimated 6.1 Mt, which is very close to the value reported by IIASA (5.9 Mt). However the TRACE-P value (5.5 Mt) was slightly lower and that of EDGAR (7.8 Mt) much higher than the REAS and IIASA values; these results are similar to those for the Chinese emissions.
It should be noted that the SO2emissions in EDGAR were larger than those in other 15
emission inventories, with the exception of emissions from other South Asia (Table 6). For example, EDGAR estimated emissions from China in 2000 as 34.2 Mt, compared with about 20–28 Mt in other inventories. Because EDGAR was the inventory most widely used for global modeling, the marked discrepancy in Asia needs to be resolved (Akimoto and Ohara, 2004).
20
3.1.2 NOx
Total emissions of NOx in Asia were 27.3 Mt in 2000 (Table 4); China at 11.2 Mt (65%) and India at 4.7 Mt (17%) were high-emission countries, as was the case for SO2
emis-sions. Japan (7%), South Korea (6%), and Indonesia (6%) also made relatively large contributions. In terms of sectoral and fuel-type contributions (Table 5), transport oil
25
use was the largest (34%), followed by coal use in power plants (22%) and industrial coal use (14%). For contributions by fuel type alone, oil use (41%) was slightly greater than coal use (37%), unlike the case with SO2 emissions, where coal use was the
ACPD
7, 6843–6902, 2007
An Asian emission inventory for the period 1980–2020 T. Ohara et al. Title Page Abstract Introduction Conclusions References Tables Figures ◭ ◮ ◭ ◮ Back Close
Full Screen / Esc
Printer-friendly Version
Interactive Discussion
EGU dominant contributor. In China, the country with the largest emissions, coal-burning
power plants were the largest emitters (34%), followed by industrial coal use and trans-port oil use (both at 25%). In India, the contributions of coal-burning power plants and transport oil use were dominant (both at 33%). Additionally, domestic biofuel use was a large contributor (13%) – larger than in China (4%).
5
Comparison of the Asian total emissions for 2000 (Table 6), as estimated by REAS and other inventories revealed that the REAS value (25.1 Mt) was almost the same as the IIASA one (25.8 Mt), whereas the TRACE-P value (22.7 Mt) was 10% lower, and that of EDGAR (31.1 Mt) 24% higher, than the REAS value. For Chinese NOx emissions (Table 7), the REAS value for 2000 (11.2 Mt) was almost the same as the
10
IIASA one (11.7 Mt), whereas the TRACE-P value (10.5 Mt) was lower, and that of EDGAR (13.7 Mt) substantially higher, than the REAS and IIASA values. For Indian NOx emissions (Table 8), the REAS (4.7 Mt) and IIASA (4.6 Mt) values were very close, whereas the TRACE-P value (4.0 Mt) was slightly lower, and the EDGAR (6.3 Mt) value higher, than the REAS and IIASA values.
15
Thus, the differences among emission inventories (REAS, IIASA, TRACE-P, and EDGAR) were similar for SO2 and NOx emissions in Asia, China, and India: the val-ues estimated by REAS were close to those of IIASA, whereas TRACE-P valval-ues were smaller, and EDGAR ones larger, than those of REAS and IIASA.
3.1.3 BC
20
Total emissions of BC in Asia were 2.73 Mt in 2000 (Table 4), and emissions from China (1.09 Mt; 40%) and India (0.80 Mt; 29%) were dominant, as were the SO2 and
NOx emissions. Domestic consumption of biofuel and coal was the dominant contrib-utor of BC emissions (80% – 60% for biofuel and 20% for coal) (Table 5). For China, domestic combustion contributed 85% (43% each for biofuel and coal), and this
per-25
centage of coal use was twice the Asian average. In India, domestic biofuel use is a huge contributor at 77% – larger than the Asian total (60%) or the Chinese value (43%).
ACPD
7, 6843–6902, 2007
An Asian emission inventory for the period 1980–2020 T. Ohara et al. Title Page Abstract Introduction Conclusions References Tables Figures ◭ ◮ ◭ ◮ Back Close
Full Screen / Esc
Printer-friendly Version
Interactive Discussion
EGU The Asian total BC emissions estimated by REAS (2.73 Mt) were 34% higher than
those of TRACE-P (2.02 Mt) (Table 6). However, more recent estimates of emissions for 1996 that were developed for global carbonaceous particle inventories by the same group (Bond et al., 2004; Streets et al., 2004) were 2.65 Mt (central value), which corresponds to 2.88 Mt for 1996 in REAS. The Chinese BC emissions in 2000 (Table 7)
5
as estimated by REAS (1.09 Mt) were lower than those of Cao et al. (2006) (1.40 Mt) but slightly higher than those of TRACE-P (0.94 Mt). For Chinese emissions in 1996 (Table 7), the REAS value of 1.33 Mt agreed with that of 1.37 Mt estimated by Bond et al. (2004). The Indian BC emissions for 2000 (Table 8) as estimated by REAS (0.80 Mt) were the same as those of Dickerson et al. (2002), which were based on the INDOEX
10
(Indian Ocean Experiment) observations, but higher than those of TRACE-P (0.52 Mt). For Indian emissions in about 1995 (Table 8), the REAS value of 0.79 Mt is close to the 0.83 Mt (central value; range 0.31–1.94 Mt) estimated by Parashar et al. (2005), but higher than the values of 0.31 Mt by Reddy and Venkataraman (2002b) and 0.48 Mt (central value; range 0.31–1.04 Mt) by Bond et al. (2004). It should be noted that the
15
estimated BC emissions are highly variable because of the large uncertainties in the emission factors.
3.1.4 OC
Total emissions of OC in Asia was 8.88 Mt in 2000 (Table 4). India at 3.27 Mt (37%) was the largest emitter, followed by China at 2.56 Mt (29%): the Indian emissions were
20
larger than the Chinese one, unlike the case for SO2, NOx, and BC. Domestic con-sumption was the dominant contributor of OC emissions (95%), especially for biofuel use (90%). In India, domestic biofuel use contributed a large proportion of the OC emissions (94%). For Chinese emissions, domestic combustion contributed 97% (82% for biofuel and 15% for coal).
25
Asian total OC emissions as estimated by REAS (8.87 Mt) were 26% higher than those estimated by TRACE-P (7.04 Mt) (Table 6), owing to differences in coal consump-tion in the domestic sector (for which the REAS value was 1.5 times the TRACE-P one).
ACPD
7, 6843–6902, 2007
An Asian emission inventory for the period 1980–2020 T. Ohara et al. Title Page Abstract Introduction Conclusions References Tables Figures ◭ ◮ ◭ ◮ Back Close
Full Screen / Esc
Printer-friendly Version
Interactive Discussion
EGU In addition, more recent estimates of emissions for 1996 (Bond et al., 2004; Streets et
al., 2004) were 2.80–9.18 Mt (central value; 4.81 Mt); the upper value corresponded to the value for 1996 estimated by REAS (9.05 Mt; data not shown). The emission factors for residential biofuel and coal combustion used by Bond et al. (2004) were lower than those in REAS and TRACE-P.
5
The Chinese OC emissions in 2000 (Table 7) as estimated by REAS (2.56 Mt) were close to those of TRACE-P (2.66 Mt) but much lower than those of Cao et al. (2006) (3.82 Mt), whose industrial emission value (1.12 Mt) was much higher than those of REAS and TRACE-P (both 0.03 Mt), as was the case with BC emissions. For 1996, the REAS emission value of 3.07 Mt was higher than the 2.11 Mt estimated by Bond
10
et al. (2004). There were large differences in the OC/BC ratio between inventories for China – 1.55 for Bond et al. (2004), 2.24 for REAS, 2.73 for Cao et al. (2006), and 2.84 for TRACE-P – indicating that the emission factors for carbonaceous aerosols were highly uncertain. The discrepancy in the OC/BC ratio between REAS and TRACE-P was because there were large differences in the contribution of each fuel type in the
15
domestic sector but only small differences in the emission factors in this sector. That is, fuel consumption in the domestic sector for REAS was 10.6 EJ (coal 3.1 EJ, biofuel 5.3 EJ, others 2.2 EJ) and that for TRACE-P was 10.6 EJ (coal 2.4 EJ, biofuel 7.2 EJ, others 1.0 EJ). Thus, total consumption was the same, but each apportionment was quite different: for coal, the REAS value was larger than the TRACE-P one, whereas
20
for biofuel the REAS value was smaller than the TRACE-P one. For BC, the averaged emission factor for coal combustion was twice that for biofuel, whereas for OC that for biofuel was 3.5 times that for coal (see Table 3). Therefore, the value of BC emissions in REAS was higher than that in TRACE-P, whereas the value of OC emissions in REAS was lower than that in TRACE-P, and the resulting OC/BC ratio for REAS was
25
lower than that in TRACE-P.
The Indian OC emissions in 2000 as estimated by REAS (3.27 Mt) (Table 8) were higher than that of TRACE-P (2.19 Mt). This discrepancy was due to differences in biofuel consumption in the domestic sector: the REAS value was 20% larger than
ACPD
7, 6843–6902, 2007
An Asian emission inventory for the period 1980–2020 T. Ohara et al. Title Page Abstract Introduction Conclusions References Tables Figures ◭ ◮ ◭ ◮ Back Close
Full Screen / Esc
Printer-friendly Version
Interactive Discussion
EGU the TRACE-P one. For Indian emissions in about 1995, the REAS emission value of
3.09 Mt was close to the upper value (range, 1.19–3.34 Mt) estimated by Parashar et al. (2005) but much higher than the 0.69 Mt of Reddy and Venkataraman (2002b) and the 1.36 Mt (central value; range 0.80–2.47 Mt) of Bond et al. (2004). This higher REAS value was a result of the high emission factor for biofuel in the residential sector; the
5
value used in REAS (5 g kg−1) was close to the upper limit in Table 2 of Parashar et
al. (2005). 3.1.5 CO
Total emissions of CO in Asia were 306 Mt in 2000 (Table 4); China was the dominant country with 137 Mt (45%), followed by India with 79 Mt (26%). In terms of sectoral and
10
fuel-type contribution (Table 5), domestic biofuel use was the largest (48%), followed by industrial burned coal (19%), transport oil use (14%), and domestic coal use (7%). Thus, CO emission sources, unlike those of other species, were distributed over many kinds of sector and/or fuel type. Contributors to Chinese CO emissions were indus-trial burned coal (35%), biofuel and coal in the domestic sector (29% and 13%), and
15
transport oil use (14%): the contribution of burned coal was higher than the average for Asia. In India, domestic biofuel use was the largest contributor (71%), followed by industrial biofuel use and transport oil use (each 9%).
The Asian CO emissions for 2000 as estimated by REAS (306 Mt) (Table 6) were higher than the values by TRACE-P (253 Mt), EDGAR (232 Mt), and IIASA (186 Mt)
20
because of the application of higher emission factors for coal combustion in REAS. For Chinese CO emissions in 2000 (Table 7), the REAS value (137 Mt) was similar to that of Streets et al. (2006) (142 Mt). However, there were large differences in sectoral emissions between REAS and Streets et al. (2006): emissions from the power plants, industry, transport, and domestic sectors were, respectively 2, 57, 19, and 58 Mt by
25
REAS and 2, 54, 38, and 48 Mt by Streets et al. (2006). Thus, the REAS value was higher in the domestic sector and lower in the transport sector than that of Streets et al. (2006). The Chinese CO emissions in REAS were consistent with the values for fossil
ACPD
7, 6843–6902, 2007
An Asian emission inventory for the period 1980–2020 T. Ohara et al. Title Page Abstract Introduction Conclusions References Tables Figures ◭ ◮ ◭ ◮ Back Close
Full Screen / Esc
Printer-friendly Version
Interactive Discussion
EGU fuel and biofuel combustion sources (145–168 Mt) estimated by top-down approaches
such as inverse modeling (Palmer et al., 2003; Yumimoto and Uno, 2006) and forward modeling (Allen et al., 2004).
3.2 Historical emissions between 1980 and 2003
By using the activity data and emission factors described in Sects. 2.2 and 2.3,
emis-5
sions of SO2, NOx, BC, OC, and CO, as well as NMVOC, were calculated for the period
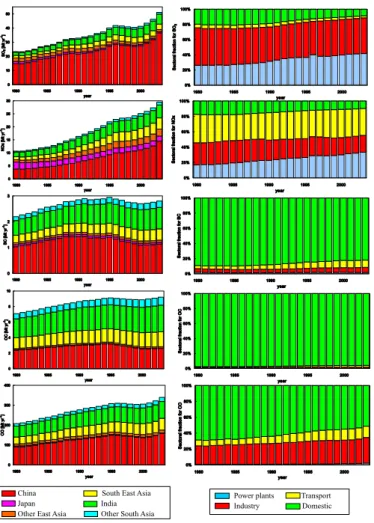
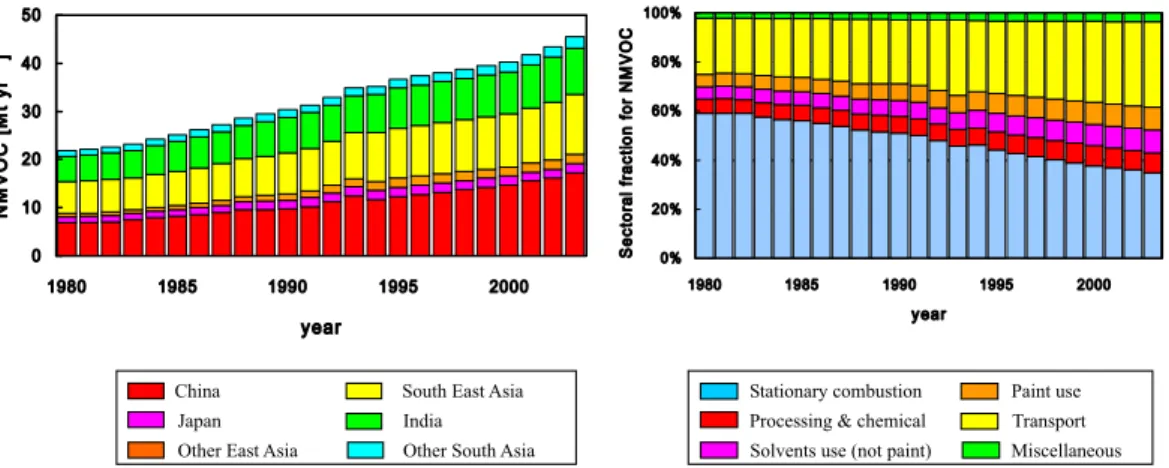
1980–2003. Annual variations in regional emissions and the sectoral distributions of total emissions between 1980 and 2003 are shown in Fig. 4 for SO2, NOx, BC, OC,
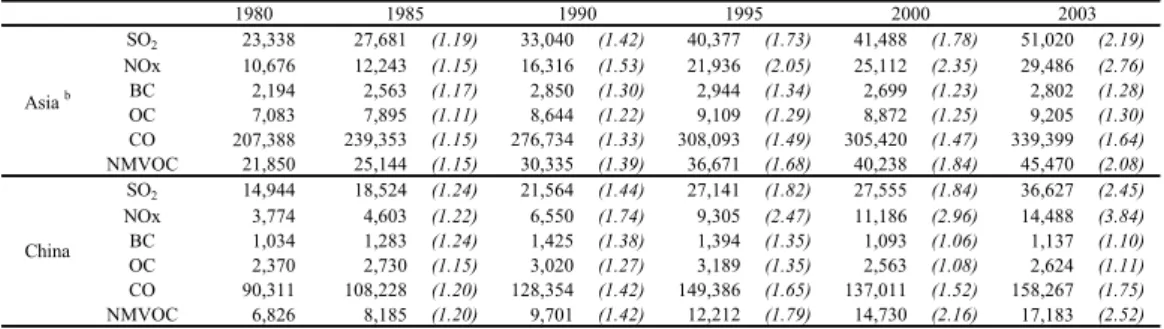
and CO, and in Fig. 5 for NMVOC. Table 9 shows the Asian and Chinese emissions at 5-year intervals in the period 1980–2003. Asian total emissions for every species
10
increased by 1.3 times (for BC) to 2.8 times (for NOx) from 1980–2003. Asian emis-sions for SO2 and NOx, whose major sources are combustion facilities of fossil fuel, rapidly increased from 1980. NMVOC emissions also rapidly increased because of such factors as the growth of automobile use and solvent and paint use. The trend in carbonaceous particles (BC and OC) emissions, whose major sources are biofuel
com-15
bustion in the residential sector, showed small increases or fluctuations. The trend in CO emission showed the blended features of emissions for SO2(or NOx) and
carbona-ceous particles. A detailed explanation of these features is presented in the following sections.
3.2.1 SO2
20
Total emissions of SO2 in Asia increased from 1980 to 1996, but subsequently
de-creased till 1999, reflecting a decrease in fuel consumption due to the Asian economic crisis; after 2000 SO2 emissions increased at a phenomenal rate. Those emissions
increased by 2.2 times in the period 1980–2003, and, notably, by 3.2 times in India and 2.5 times in China. Examination of sectoral contributions in Asia revealed that the
con-25
ACPD
7, 6843–6902, 2007
An Asian emission inventory for the period 1980–2020 T. Ohara et al. Title Page Abstract Introduction Conclusions References Tables Figures ◭ ◮ ◭ ◮ Back Close
Full Screen / Esc
Printer-friendly Version
Interactive Discussion
EGU varied only slightly from 46% in 1980 to 42% in 2003, and that of the domestic sector
greatly decreased from 21% in 1980 to 9% in 2003.
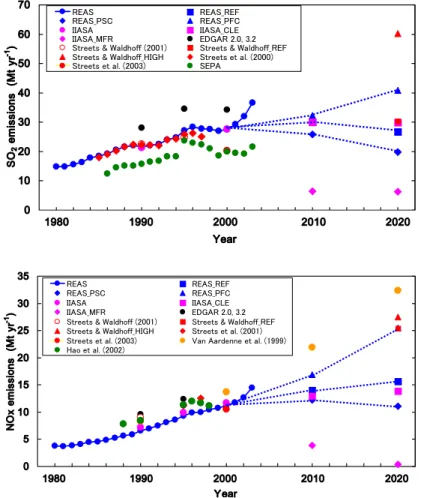
We examined the time series of Chinese SO2emissions in REAS, along with
previ-ous estimates (Fig. 6). Before 2000, the REAS variation corresponded to that of IIASA. The variation in SEPA (2003) was similar to that in REAS during 1986–1994, but about
5
7 Mt y−1
lower. In contrast, there were large differences between SEPA and REAS in the decreasing trend of SO2emissions during 1995 and 2000, reflecting the differences
in coal consumption in each inventory (Akimoto et al., 2006). 3.2.2 NOx
Total emissions of NOx in Asia (Table 9 and Fig. 4) showed a monotonic increase
10
between 1980–2003 with no dips, in contrast to the pattern of SO2 emissions. The
emissions increased by 2.8 times from 1980–2003, with values of 10.7 Mt in 1980 and 29.5 Mt in 2003. In particular, Chinese NOx emissions increased dramatically by 3.8 times from 1980 to 2003 – an annual-average growth rate of 6%, with the high-est growth after 2000 (by 1.3 times over only 3 years). Recently, these NOx trends
15
in the period 1996–2003 over China were validated by comparison with column NO2
data from the GOME (Global Ozone Monitoring Experiment) satellite by Akimoto et al. (2006) and Uno et al. (2006). These trends in Chinese NOx emissions in REAS were consistent with those in other inventories, including IIASA, TRACE-P, and Hao et al. (2002) (Fig. 6).
20
Examination of sectoral contributions to Asian NOx emissions revealed that emis-sions from the power plants, industry, transport, and domestic sectors contributed 17%, 29%, 37%, and 17%, respectively, in 1980 and 33%, 22%, 35%, and 10%, respectively, in 2003: thus, the contribution of power plants almost doubled between 1980 and 2003.
ACPD
7, 6843–6902, 2007
An Asian emission inventory for the period 1980–2020 T. Ohara et al. Title Page Abstract Introduction Conclusions References Tables Figures ◭ ◮ ◭ ◮ Back Close
Full Screen / Esc
Printer-friendly Version
Interactive Discussion
EGU 3.2.3 BC
Total BC emissions in Asia increased by 1.3 times over the period 1980–2003 (Table 9 and Fig. 4). However, the complexity of the temporal variation in this period was rel-atively large: emissions increased from 1980 to 1991, but subsequently were almost constant or slightly decreased till 2000; after 2000 they increased again. These
com-5
plicated variations are reflected by those of the Chinese emissions. In China, the trend in total BC emissions is controlled by the balance between a decreasing rate of emis-sions from coal and biofuel combustion in the domestic sector and an increasing rate of emissions from coal-burning sources in the industrial sector and diesel vehicles. Ex-amination of sectoral contributions showed that the contribution of the domestic sector
10
decreased from 89% in 1980 to 82% in 2003 owing to the trend toward upgrading fuel quality from biofuels and coals (as mentioned below), whereas that of transport sector increased from 4% in 1980 to 10% in 2003 because of the increase in the use of diesel vehicles.
The increase in BC emissions from 1980 to 2000 in South Asia, including India,
15
was highest (1.5 times; data not shown), but that in China was comparatively small (1.1 times). Accordingly, there was a large difference between India and China in the changes in spatial distribution of BC emissions (see Fig. 8 in Sect. 3.4). In China, coal and biofuel combustion in the domestic sector is the dominant contributor to BC emissions (see Table 5). Total fuel consumption in the domestic sector increased from
20
8.4 EJ in 1980 to 10.6 EJ in 2000, whereas the contributions of coal and biofuel to total fuels decreased. As a result, total consumption (7.9 EJ) of coal and biofuel in 2000 was almost the same as that in 1980 (7.8 EJ; see Table 2). This caused a small increase in BC emissions in China. On the other hand, in India, only biofuel combustion in the domestic sector was the dominant contributor to BC emissions (see Table 5). Biofuel
25
consumption in the domestic sector in India increased from 5.9 EJ in 1980 to 7.9 EJ in 2000, and its contribution in the period 1980–2000 was maintained at around 90% (91% for 1980 and 86% for 2000; see Table 2). Consequently, Indian BC emissions
ACPD
7, 6843–6902, 2007
An Asian emission inventory for the period 1980–2020 T. Ohara et al. Title Page Abstract Introduction Conclusions References Tables Figures ◭ ◮ ◭ ◮ Back Close
Full Screen / Esc
Printer-friendly Version
Interactive Discussion
EGU continued to increase throughout the period, unlike Chinese BC emissions.
3.2.4 OC
Total OC emissions in Asia increased by 1.3 times in the period 1980–2003 (Table 9 and Fig. 4), and the temporal variations were very similar to those of BC. Biofuel com-bustion in the domestic sector was the dominant contributor to OC emissions in both
5
China and India (see Table 5). Biofuel consumption in China increased until 1995, and then slightly decreased or was uniform, whereas that in India continued to increase. As a result, although the value of OC emissions in India was almost the same as that in China before 1995, the former was higher than the latter after 1996. Consequently, the contrast between India and China in the changes in spatial distributions of OC
10
emissions was similar to, but clearer than, that for BC (see Fig. 8 in Sect. 3.4).
The OC/BC ratio in emissions varies widely throughout Asia, depending on the bio-fuel share of total bio-fuels in the domestic sector. For example, the averaged OC/BC ratio in the period 1980–2003 was almost 2.3 (2.29 in 1980 and 2.31 in 2003) in China, but it was higher at almost 4.2 (4.29 for 1980 and 4.12 for 2003) in India because of the
15
higher share of biofuel. Additionally, a clear contrast in the regional OC/BC ratio was also found within China: the ratio in southern areas of China was higher than that in northern areas, reflecting the higher share of coal and lower share of biofuel in north-ern areas. It should be noted that these spatial and temporal variations in OC/BC ratio play an important role in the radiative effects of these aerosols over Asia.
20
3.2.5 CO
Total emissions for CO in Asia increased by 1.6 times in the period 1980–2003 (Table 9 and Fig. 4). The variation was similar to that of SO2 and was reflected by that of
Chinese CO emissions, whose value was the largest in Asia, whereas CO emissions in India, which had the second-highest emission rate in Asia, continued to increase
25
ACPD
7, 6843–6902, 2007
An Asian emission inventory for the period 1980–2020 T. Ohara et al. Title Page Abstract Introduction Conclusions References Tables Figures ◭ ◮ ◭ ◮ Back Close
Full Screen / Esc
Printer-friendly Version
Interactive Discussion
EGU 2003, but they decreased from 1995–2000 owing to a reduction in consumption of coal
and biofuel in the domestic sector in this period. Examination of sectoral contributions to Asian CO emissions revealed that the contribution of industry increased from 23% in 1980 to 32% in 2003, and that of transport increased from 7% in 1980 to 14% in 2003. That of the domestic sector decreased from 69% in 1980 to 51% in 2003.
5
3.2.6 NMVOC
Total emissions of NMVOC in Asia showed a monotonic increase over the years 1980– 2003 with no dip (Table 9 and Fig. 5), and the fundamental features of variation were similar to those for NOx. Asian emissions increased by 2.1 times during the same pe-riod, especially in China, which had an increase of 2.5 times. Stationary combustion,
10
processing and handling of fossil fuels and chemical industry (“Processing & chemi-cal” in Fig. 5), solvent use (excluding paint), paint use, transport, and miscellaneous contributed 59%, 6%, 5%, 5%, 23%, and 2%, respectively, to the total Asian NMVOC emissions in 1980, and 35%, 8%, 9%, 9%, 35%, and 4%, respectively, in 2003: thus, examination of sectoral contributions showed a decrease for stationary combustion, a
15
small increase for processing and handling of fossil fuels and chemical industry, and an increase for solvent and paint use and transport.
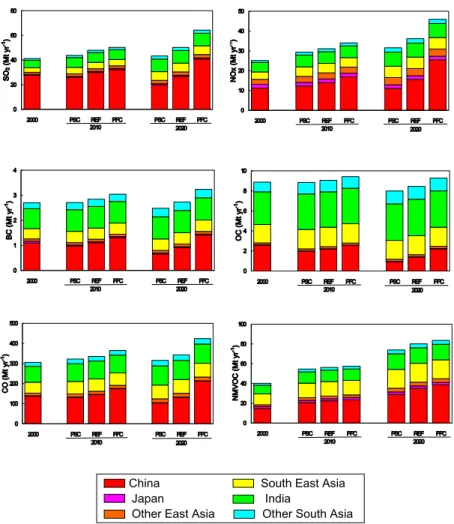
3.3 Projection of future emissions
Here, we briefly summarize the projected emissions of SO2, NOx, BC, OC, CO, and
NMVOC in 2010 and 2020 (Table 10 and Fig. 7).
20
3.3.1 SO2
Chinese SO2 emissions in the REF scenario showed a 9% increase (to 30.0 Mt) for
2010 and a 3% decrease (to 26.8 Mt) for 2020 compared with 2000 (27.6 Mt). Although SO2 emissions in China were significantly reduced from 2000 levels in the PSC
sce-nario (by 6% in 2010 and 28% in 2020), the PFC scesce-nario showed an increase of 17%
ACPD
7, 6843–6902, 2007
An Asian emission inventory for the period 1980–2020 T. Ohara et al. Title Page Abstract Introduction Conclusions References Tables Figures ◭ ◮ ◭ ◮ Back Close
Full Screen / Esc
Printer-friendly Version
Interactive Discussion
EGU in 2010 and 48% in 2020 over the 2000 level.
Consequently, Asian total SO2 emissions are strongly influenced by the emission scenario in China. The future total Asian emissions for SO2 under the REF scenario
for China were projected to increase by 16% (to 47.9 Mt) in 2010 and 22% (to 50.2 Mt) in 2020 over the 2000 level (41.2 Mt). Asian 2020 emissions under the PSC scenario for
5
China were estimated to be 43.3 Mt, showing only a small increase (by 5%) compared with the 2000 level, whereas the PFC scenario for China showed a rapid increase in Asian 2020 emissions: by 55% compared with the 2000 level.
SO2 emissions in East Asia excluding China (sum of values for Japan and other
East Asia in Table 10) were projected to increase by 41% from 2000 (2.6 Mt) to 2020
10
(3.6 Mt). In Southeast Asia, SO2 emissions would double between 2000 (3.6 Mt) and 2020 (7.1 Mt). Indian and other South Asian SO2 emissions in 2020 were estimated
to be 10.2 Mt and 2.5 Mt, respectively, showing a rapid growth in emissions (by 66% in India and 91% in other South Asia) compared with the 2000 level.
3.3.2 NOx
15
In China, future NOx emissions under the REF scenario were projected to increase by 25% (to 14.0 Mt) in 2010 and by 40% (15.6 Mt) in 2020, compared with 2000 emissions (11.2 Mt). There was a marked difference between NOx projections under the PSC and PFC scenarios. Under the PSC scenario, 2020 NOx emissions were projected to be 11.1 Mt, but the PFC projection was more than twice as large at 25.5 Mt. Although
20
the 2020 PSC scenario showed a slight reduction in emissions (1%) compared with the 2000 level, the 2020 PFC scenario projected a marked increase of 128% over the 2000 level.
Asian total emissions for NOx under the REF scenario for China were projected to increase by 24% (to 31.1 Mt) in 2010 and 44% (36.1 Mt) for 2020 over 2000 values
25
(25.1 Mt). Asian 2020 emissions under the PSC scenario for China were estimated to be 31.6 Mt, a modest increase (by 26%) compared with the 2000 level, whereas the PFC scenario for China showed a rapid increase in Asian 2020 emissions (to 46.0 Mt),
ACPD
7, 6843–6902, 2007
An Asian emission inventory for the period 1980–2020 T. Ohara et al. Title Page Abstract Introduction Conclusions References Tables Figures ◭ ◮ ◭ ◮ Back Close
Full Screen / Esc
Printer-friendly Version
Interactive Discussion
EGU by 83% compared with the 2000 level.
NOx emissions in East Asia excluding China were projected to increase by 24% from 2000 (4.4 Mt) to 2020 (5.5 Mt). In Southeast Asia, NOx emissions would increase by 53% from 3.8 Mt in 2000 to 5.8 Mt in 2020. Indian and other South Asian NOx emissions in 2020 were estimated at 7.1 Mt and 2.2 Mt, respectively – a rapid growth in
5
emissions (by 49% in India and 122% in other South Asia) compared with 2000 levels. 3.3.3 BC
Under the REF scenario, 2010 BC emissions in China (1.11 Mt) would be almost equal to those in 2000 (1.09 Mt) and would then decrease by 17% (to 0.91 Mt) by 2020, owing to the reduction in coal and biofuel consumption in the domestic sector. Under the PSC
10
scenario, Chinese BC emissions would be markedly reduced from 2000 levels (by 11% in 2010 and 40% in 2020). On the other hand, the PFC scenario showed an increase of 19% (in 2010) and 29% (in 2020) compared with the 2000 level because the increase in coal combustion will exceed the decrease in biofuel combustion in the domestic sector. The future trend in Asian total BC emissions depends on the emission scenario in
15
China. Under the REF scenario for China, future BC emissions in all of Asia would increase from the 2000 level (2.70 Mt) by 16% (to 2.84 Mt) in 2010, and would then decline to about the 2000 level (2.73 Mt) in 2020. Asian 2020 emissions under the PSC scenario for China were estimated to be 2.48 Mt, a decrease (by 8%) compared with the 2000 level, whereas the PFC scenario for China gave an increase in Asian
20
2020 emissions of 20% over the 2000 level.
BC emissions in East Asia excluding China were projected to decline by 12% from 2000 (0.16 Mt) to 2020 (0.14 Mt) owing to the rapid reduction in Japan. In Southeast Asia, BC emissions would increase from 2000–2020, with 0.41 Mt in 2000 and 0.46 Mt in 2020. In India and other South Asia, 2020 BC emissions were estimated to be
25
0.89 Mt and 0.34 Mt, respectively – a modest increase in emissions (12% in India and 45% in other South Asia) compared with 2000 levels.
ACPD
7, 6843–6902, 2007
An Asian emission inventory for the period 1980–2020 T. Ohara et al. Title Page Abstract Introduction Conclusions References Tables Figures ◭ ◮ ◭ ◮ Back Close
Full Screen / Esc
Printer-friendly Version
Interactive Discussion
EGU 3.3.4 OC
Chinese OC emissions in both 2010 and 2020 would decrease under any scenario compared with the 2000 level, owing to the decrease in biofuel consumption in the domestic sector. OC emissions in 2020 under the PSC, REF, and PFC scenarios were markedly reduced by 64% (to 0.92 Mt), 46% (to 1.38 Mt), and 14% (to 2.21 Mt),
5
respectively, compared with the 2000 level (2.56 Mt).
Total Asian 2020 OC emissions under the PSC, REF, and PFC scenarios in China were estimated to be 7.99 Mt, 8.45 Mt, and 9.29 Mt – a 10% decrease, 5% decrease, and 5% increase, respectively, compared with 2000 emissions (8.87 Mt).
OC emissions in 2020 in East Asia excluding China were estimated to be 0.25 Mt
10
– almost equal to the 2000 emissions (0.24 Mt). In Southeast Asia, India, and other South Asia, 2020 OC emissions showed increases (4%, 11%, and 33%, respectively) compared with 2000 levels.
The OC/BC ratio in China was projected to decrease from 2.3 in 2000 to 1.5 in the 2020 REF because of a marked reduction in OC but a modest reduction in BC. On the
15
other hand, the Indian OC/BC ratio in 2020 was projected to be the same as that in 2000 (almost 4.1). Consequently, the difference in the OC/BC ratio between China and India would increase in future.
3.3.5 CO
Under the REF scenario, CO emissions in China were projected to increase from
20
137 Mt in 2000 to 145 Mt in 2010, and then to decrease to 131 Mt in 2020 (a 5% in-crease in 2010 and a 4% dein-crease in 2020 compared with the 2000 level). Although Chinese CO emissions under the PSC scenario were projected to decrease by 4% in 2010 and 28% in 2020 compared with 2000 emissions, the PFC scenario showed an increase in emissions (27% in 2010 and 55% in 2020) over 2000 levels.
25
The future changes in Asian CO emissions were projected to be similar to those for SO2 emissions. Under the REF scenario for China, total Asian emissions were
ACPD
7, 6843–6902, 2007
An Asian emission inventory for the period 1980–2020 T. Ohara et al. Title Page Abstract Introduction Conclusions References Tables Figures ◭ ◮ ◭ ◮ Back Close
Full Screen / Esc
Printer-friendly Version
Interactive Discussion
EGU estimated to increase by 10% (to 335 Mt) and 12% (to 343 Mt) in 2010 and 2020,
respectively, compared with the 2000 level (305 Mt). Under the PSC scenario for China, total Asian CO emissions were projected to increase by 5% (to 322 Mt) and 3% (to 316 Mt) in 2010 and 2020, respectively. Under the PFC scenario for China, total Asian CO emissions would increase by 19% (to 365 Mt) and 39% (to 424 Mt) in 2010 and
5
2020, respectively.
CO emissions in East Asia excluding China were estimated to increase by 35% from 15 Mt in 2000 to 21 Mt in 2020. In Southeast Asia, 2020 CO emissions (68 Mt) should increase by 26% from 55 Mt in 2000. CO emissions in India (and other South Asia) were projected to increase by 21% (42%) from 79 Mt (19 Mt) in 2000 to 96 Mt (27 Mt) in
10
2020.
3.3.6 NMVOC
Under the REF scenario, 2020 NMVOC emissions in China (35.2 Mt) would rapidly in-crease by 139% from 2000 (14.7 Mt). Under the PSC and PFC scenarios, the 2020 NMVOC emissions in China would increase markedly by 97% and 163%, respectively,
15
compared with the 2000 level. Thus, Chinese NMVOC emissions were expected to rapidly at least double under any scenario, because the development of control tech-nologies for anthropogenic NMVOC emissions would be behind those for other species. It should be noted that there were comparatively small differences between the values under the three kinds of scenarios. This shows that our assumptions of control
tech-20
nologies under each scenario (especially under the PSC scenario) may have been too conservative.
Under the REF scenario, total Asian NMVOC emissions were estimated to increase by 40% (to 56.3 Mt) and 100% (to 80.1 Mt) in 2010 and 2020, respectively, from 2000 (40.2 Mt). Under the PSC scenario, Asian NMVOC emissions were projected to
in-25
crease by 36% (to 54.6 Mt) and 84% (74.0 Mt) in 2010 and 2020, respectively. Under the PFC scenario, Asian NMVOC emissions would increase by 43% (to 57.5 Mt) and 108% (to 83.6 Mt) in 2010 and 2020, respectively.