HAL Id: insu-00448303
https://hal-insu.archives-ouvertes.fr/insu-00448303
Submitted on 11 Apr 2011HAL is a multi-disciplinary open access archive for the deposit and dissemination of sci-entific research documents, whether they are pub-lished or not. The documents may come from teaching and research institutions in France or abroad, or from public or private research centers.
L’archive ouverte pluridisciplinaire HAL, est destinée au dépôt et à la diffusion de documents scientifiques de niveau recherche, publiés ou non, émanant des établissements d’enseignement et de recherche français ou étrangers, des laboratoires publics ou privés.
Controls on Gold Solubility in Arc Magmas: An
Experimental Study at 1000°C and 4 kbar
Sébastien Jégo, Michel Pichavant, J.A. Mavrogenes
To cite this version:
Sébastien Jégo, Michel Pichavant, J.A. Mavrogenes. Controls on Gold Solubility in Arc Magmas: An Experimental Study at 1000°C and 4 kbar. Geochimica et Cosmochimica Acta, Elsevier, 2010, 74 (7), pp.2165-2189. �10.1016/j.gca.2010.01.012�. �insu-00448303�
Controls on gold solubility in arc magmas: An experimental study at
1000 °C and 4 kbar
Sébastien Jégoa b Michel Pichavantb and John A. Mavrogenesc
a Institute of Earth Sciences, Academia Sinica, 128 Academia Road, Sec. 2, Nankang, Taipei 11529, Taiwan, Republic of China
b Institut des Sciences de la Terre d’Orléans (ISTO), CNRS: UMR6113, INSU, Université d’Orléans, France
c Research School of Earth Sciences, The Australian National University, Canberra, ACT 0200, Australia
Abstract
In order to (1) explain the worldwide association between epithermal gold–copper–
molybdenum deposits and arc magmas and (2) test the hypothesis that adakitic magmas would be Au-specialized, we have determined the solubility of Au at 4 kbar and 1000 °C for three intermediate magmas (two adakites and one calc-alkaline composition) from the Philippines. The experiments were performed over a fO2 range corresponding to reducing ( NNO−1), moderately oxidizing ( NNO+1.5) and strongly oxidizing ( NNO+3) conditions as measured by solid Ni–Pd–O sensors. They were carried out in gold containers, the latter serving also as the source of gold, in presence of variable amounts of H2O and, in a few
additional experiments, of S. Concentrations of Au in glasses were determined by LA-ICPMS. Gold solubility in melt is very low (30–240 ppb) but increases with fO2 in a way consistent with the dissolution of gold as both Au1+ and Au3+ species. In the S-bearing experiments performed at NNO−1, gold solubility reaches much higher values, from 1200 to 4300 ppb, and seems to correlate with melt S content. No systematic difference in gold solubility is observed between the adakitic and the non-adakitic compositions investigated. Oxygen fugacity and the sulfur concentration in melt are the main parameters controlling the incorporation and concentration of gold in magmas. Certain adakitic and non-adakitic magmas have high fO2 and magmatic S concentrations favorable to the incorporation and transport of gold. Therefore, the cause of a particular association between some arc magmas and Au–Cu–Mo deposits needs to be searched in the origin of those specialized magmas by involvement of Au- and S-rich protoliths. The subducted slab, which contains metal-rich massive sulfides, may constitute a potentially favorable protolith for the genesis of magmas specialized with respect to gold.
1. Introduction
There is general agreement that epithermal and porphyry-type deposits result from a
combination of magmatic and hydrothermal processes ([Hedenquist and Lowenstern, 1994], [White and Hedenquist, 1990] and [White and Hedenquist, 1995]). On a worldwide scale, epithermal and porphyry-type deposits are spatially and temporally associated with magmatic intrusions ([Ulrich et al., 1999], [Halter et al., 2002], [Sillitoe, 1989], [Sillitoe, 1997] and [Sillitoe and Bonham, 1990]). Magma bodies may chemically contribute to the mineralizing systems by supplying elements which, upon volatile exsolution, are transferred into the magmatic-hydrothermal fluid phase. Certain components of hydrothermal fluids such as
halogens and sulfur originate from magmatic sources (Hattori and Keith, 2001). However, the origin of metals (Au, Ag, Cu, Mo) in epithermal and porphyry-type deposits has long been a subject of debate, with metallogenic models dividing in essentially two groups. One group of models considers that metals originate in country rocks (e.g., [Keays and Skinner, 1989] and [Mathur et al., 2000]). In a second group of models, magmatic intrusions constitute the source of metals. These can be pre-concentrated through igneous differentiation processes, before being transferred to the magmatic-hydrothermal fluid phase ([Ulrich et al., 1999], [Halter et al., 2002] and [Harris et al., 2003]). In this paper, we use an experimental approach to explore the hypothesis that certain classes of magmas have the ability to pre-concentrate Au at the magmatic stage and, therefore, represent Au-enriched magmas.
A correlation between ore-forming processes and magma chemistry has been noted many times. Cu–Mo deposits are commonly associated with oxidized magnetite-bearing magmas ([Ishihara, 1981] and [Blevin and Chappell, 1992]), and Au–Cu deposits with potassic calk-alkaline rocks and shoshonites (Müller and Groves, 1993). The existence of a link between economic deposits and alkaline arc magmas has been demonstrated in Papua-New Guinea (Richards, 1990). In other cases, a preferential relationship has been noted between adakitic magmatism and Au–Ag–Cu–Mo epithermal and porphyry deposits ([Baldwin and Pearce, 1982], [Thiéblemont et al., 1997], [Sajona and Maury, 1998], [Gonzalez-Partida et al., 2003], [Levresse et al., 2004] and [Rae et al., 2004]), although such an association remains doubtful to some authors (e.g., Richards and Kerrich, 2007). The origin of a potential connection between adakitic magmas and epithermal and porphyry-type deposits is the central question addressed in this paper. We approach the problem by providing experimental Au solubility data in representative arc magmas. The experimental results allow the transport properties for Au of adakitic and non-adakitic magmas to be compared. They also place constraints on mechanisms of Au complexation in hydrous magmatic liquids of intermediate composition, typical of arc settings. The critical importance of oxygen fugacity (fO2) and the presence of sulfur on Au transport in magmas are emphasized.
2. Starting materials and experimental strategy
2.1. Starting materials
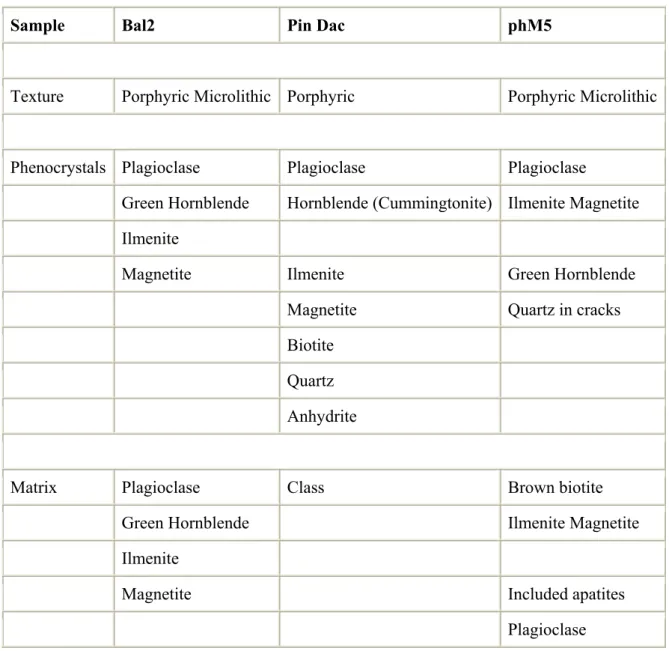
Our experiments were performed in parallel on three natural samples, respectively
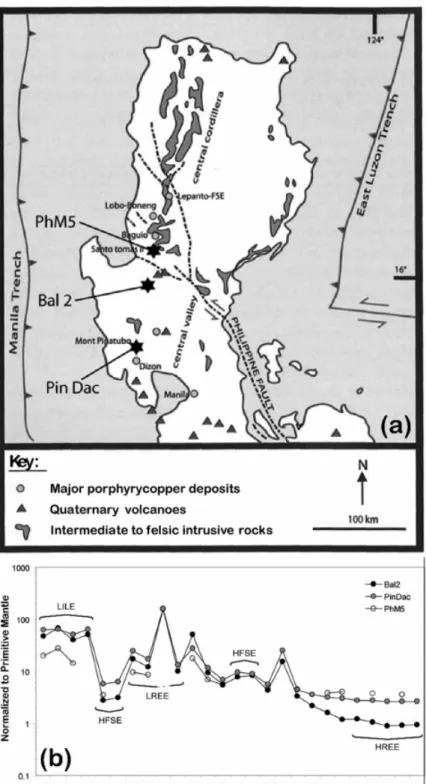
representative of a typical adakite (Bal2), an intermediate adakite (Pin Dac) and a typical calc-alkaline magma (PhM5) after the definition of Jego et al. (2005; see below), all from the North Luzon arc, Philippines (Fig. 1a; bulk rock compositions in Table 1). Recent (<20 Ma) magmatism in the North Luzon arc is linked to the current subduction of the South China Sea plate along the Manila Trench, and includes a range of arc rocks ([Sajona and Maury, 1998], [Prouteau et al., 2000], [Yumul et al., 2000], [Bellon and Yumul, 2001] and [Jego et al., 2005]). World-class Cu–Au deposits are spatially and temporally associated with this recent magmatic activity, as shown by the chain of porphyry copper deposits extending from Dizon in the south to Lepanto in the north, and the epithermal Au deposits from the Baguio district ([Bellon and Yumul, 2000], Imai, 2001 A. Imai, Generation and evolution of ore fluids for porphyry Cu–Au mineralization of the Santo Tomas II (Philex) deposit, Philippines, Res. Geol. 51 (2001), pp. 71–96. [Imai, 2001] and [Imai, 2002]; Fig. 1a). In the Baguio district, there is an intimate association between intrusive rocks and mineralization (Santo Tomas II Cu–Au porphyry and Antamok and Acupan epithermal Au deposits, [Imai, 2001], [Imai, 2002] and [Polve et al., 2007]). The three starting rocks selected all come from this recent North Luzon magmatism. They have ages < 3 Ma (Table 1). Diorite PhM5 comes from the Santo Tomas II
(Philex) underground mine (Imai, 2001). Dacite Pin Dac is the white pumice erupted from Mt. Pinatubo in 1991, this volcanic system being considered analogous to plutonic systems related to Cu–Au mineralization elsewhere in the North Luzon arc ([Imai et al., 1996] and [Imai, 2002]). Diorite Bal2 comes from a small intrusive plug located near Balungao (see Fig. 1a) and surrounded by hot springs and epithermal mineralization. Note that, with respect to the Manila Trench, Mt. Pinatubo is located in the main volcanic arc, called West Volcanic Chain (WVC), whereas Balungao is in a back-arc position, i.e., the East Volcanic Chain (EVC). The three starting samples have intermediate SiO2 contents, within a narrow range (61.5 to 64.5 wt%, Table 1). The other major oxides differ slightly between samples: Bal2 is the richest in MgO, whereas PhM5 is slightly richer in CaO and Fe2O3, but poorer in K2O than the others. Thus, CaO/K2O is three times greater in the non-adakitic (PhM5) than in the two adakitic samples (Bal2 and Pin Dac). The trace element contents are typical of arc magmas (Table 1): Large Ion Lithophile Elements (LILE) and Light Rare Earth Elements (LREE) are both enriched while High Field Strength Elements (HFSE) and Heavy REE (HREE) are depleted (Fig. 1b). However, the trace element patterns of the three samples are different in detail. The HREE and yttrium (Y) contents are much lower in the two adakites than in the non-adakite, consistent with the fractionation of these elements by garnet and amphibole during adakite genesis (e.g., [Defant and Drummond, 1990] and [Sen and Dunn, 1994]). For example, Sr/Y ratios range between 20.8 and 197.8 (Table 1), which corresponds to a progressive transition from typical calc-alkaline magmas (PhM5) to adakites (Pin Dac then Bal2). According to Jego et al. (2005), adakitic rocks in island arc settings may be subdivided into two groups: (1) “typical” adakites (scarce; like Bal2) which exhibit primitive mantle-normalized HREE and Y contents around 1 or lower; (2) “intermediate” adakites (common; like Pin Dac) which display HREE and Y concentrations between 2 and 5 times the primitive mantle values. Those authors proposed that the most likely origin of “typical” adakites in arc settings is the hydrous partial melting, at minimum depth of 100 km, of altered oceanic metabasalts converted to eclogite; a possible alternative hypothesis is the high-pressure fractionation (uppermost mantle) of garnet plus amphibole at the expense of mafic melts. “Intermediate” adakites, on the other hand, are believed to originate for most of them through magma mixing between slab-derived “typical” adakitic magmas and mafic mantle-derived ones, with an additional contribution of mantle in many cases (e.g., by assimilation). Also, the intervention of low degrees of partial melting of adakite-metasomatized mantle cannot be excluded, either in the genesis of some “intermediate” adakites, or in that of the mafic precursors from which they might derive through low pressure crystal fractionation or AFC. Sulfur contents in starting materials (double-melting glass; see Section 3.1) are below the detection limits of the EPMA apparatus (see Section 3.4.1), i.e., less than 30 ppm. There is no previous published data on the sulfur content of PhM5 and Bal2, but sulfur in Pin Dac has been extensively studied (e.g., [Westrich and Gerlach, 1992], [Wallace and Gerlach, 1994], [Gerlach et al., 1996], [Kress, 1997], [Hattori and Keith, 2001] and [Borisova et al., 2006]). About 80–90 ppm S are reported in Pin Dac rhyolitic melt inclusions and 60–90 ppm S in the rhyolite matrix glass. The bulk dacite pumice, though, contains as much as
1361 ± 588 ppm S, with maximum concentrations up to 2200 ppm S ([Bernard et al., 1991] and [Bernard et al., 1996]). These variable S contents in dacite pumices are explained by secondary alteration of magmatic anhydrite. Sulfur concentrations measured in our starting materials are very low, about three times lower than in the rhyolite matrix. Besides the fact that we avoided including anhydrite phenocrysts in the starting sample powder, such low S contents must be due to volatilization and loss of sulfur during double melting of the starting rock powder at 1400 °C in air. Anyway, less than 30 ppm S in melt are unexpected to form
significant Au–S complexes under the experimental conditions. Thus the experiments performed without addition of sulfur will be labeled “S-free” experiments throughout this study, as opposed to “S-added” runs.
The bulk gold contents of our samples are quite low (12–38 ppb; Table 1), close to the detection limits (which are generally 10 ppb) of the analytical equipment used (ICP-MS, Toulouse, France); these Au concentrations are in the same range as those measured by Borisova et al. (2006) in the rhyolitic matrix glass of the Pinatubo 1991 white dacite (22 ± 8 ppb). Note that the typical adakite Bal2 is the most Au-enriched.
2.2. Experimental strategy
The aim of this study is to determine the solubility of Au in adakitic and non-adakitic melts, in order to quantitatively evaluate their respective transport properties for Au at the magmatic stage (i.e., as opposed to the hydrothermal stage). Previously, the dependence of gold
solubility with fO2 has been determined at 1 atm for a haplobasaltic (anorthite–diopside) composition ([Borisov and Palme, 1996] and [Borisov and Palme, 2000]). Solubilities of noble metals, including gold, were measured in basaltic liquids saturated with sulfides and sulfates at 1300 °C and 10 kbar (Jugo et al., 2005). Several other studies have focused on the partitioning of Au between either silicic or mafic melt, vapour, brine, and condensed phases such as magnetite and sulfides ([Bezmen et al., 1994], [Fleet et al., 1996], [Fleet et al., 1999], [Crocket et al., 1997], [Jugo et al., 1999], [Frank et al., 2002], [Simon et al., 2003], [Simon et al., 2005] and [Simon et al., 2007]). Therefore, no Au solubility data is presently available at magmatic conditions for intermediate melts typical of mineralizing systems in arc settings. To simulate conditions of evolution of intermediate arc melts as closely as possible in the experiments, a pressure of 4 kbar was chosen and an elevated temperature (1000 °C), close to or above the liquidus of dacitic compositions such as the three starting rocks (e.g., Prouteau and Scaillet, 2003), was adopted. Hydrous conditions were imposed, the liquidus temperature allowing the concentration of H2O in melt to be varied without inducing significant
crystallization of silicate phases. Control of redox state is a necessity in metal solubility studies (e.g., [O’Neill et al., 1995] and [Borisov and Palme, 1996]) and fO2 was varied from relatively reducing ( NNO−1, where NNO is the fO2 of the nickel–nickel oxide oxygen buffer at P and T), moderately oxidizing ( NNO+1.5) to highly oxidizing ( NNO+3) conditions, in a range encompassing the fO2 of arc magmas. In addition to the main experimental parameters in this study (melt composition, fO2, melt H2O concentration or
aH2O), a few experiments were performed with addition of S to explore the effect of sulfur saturation on Au solubility.
3. Experimental and analytical methods
3.1. Experimental charges
Each of the three natural samples was ground in an agate mortar, then placed in a Pt crucible and fused at 1400 °C, 1 bar, in air for 4 h. Two cycles of melting were performed to produce chemically homogeneous glasses which then were crushed. About 30 mg of glass powder was loaded in pure gold capsules (2.5 mm ID, 2.9 mm OD, 15 mm length) together with variable amounts of deionized water (between 5 and 10 wt% of the total charge), depending on the desired melt water content. Therefore, the container capsule served as the source of Au. For the S-bearing experiments, about 1 wt% of pure elemental sulfur (S) was added to the charge.
The experimental capsules were welded shut with a graphite arc-welder, and then stored in an oven at 110 °C to ensure a homogeneous water distribution.
It is worth stressing that it has previously been shown experimentally ([Chou, 1986], [Gunter et al., 1987], [Linnen et al., 1995] and [Truckenbrodt and Johannes, 1999]) that hydrogen is largely permeable through Au-capsules at temperatures exceeding 800 °C, allowing us to easily control the redox state of our experimental charges. Other recent studies ([Scaillet et al., 1992] and [Schmidt et al., 1997]) even calculated the time required to reach fH2 equilibrium between the Ar–H2 gas of a high-pressure vessel and the interior of Au-capsules (= less than 10 minutes in the case of NNO and CCO buffer assemblages), while Dall’Agnol et al. (1999) preferred to use Au-capsules at reducing conditions because Fe loss to Au is minimized and Au is sufficiently permeable to H2 above 700 °C. Moreover, several previous studies using the solid sensor technique (see below) used alternatively Pt- and Au- capsules as container for the sensor, without any difference (e.g., [Scaillet and Evans, 1999], [Martel et al., 1999],
[Pichavant et al., 2002] and [Clemente et al., 2004]). Therefore, hydrogen diffusion through Au is not a limiting factor in our experiments.
3.2. fO2 sensors
Experimental redox conditions were determined by the solid sensor technique ([Taylor et al., 1992] and [Pownceby and O’Neill, 1994]). The sensor assemblage consisted of a mixture of M + Pd metal powders in variable proportions, plus metal-oxide (MO). For experiments above NNO buffer, Ni–Pd metallic alloys + NiO metal-oxide were used (i.e., M = Ni), and for experiments below NNO buffer, Co–Pd + CoO mixtures (M = Co). For each experiment, two pellets of the appropriate sensor assemblage were prepared, with respectively a high and low M/Pd ratio. These were loaded in a 20 mm length Pt capsule containing 10 mg of deionized water, lined with ZrO2 powder to prevent alloying between the pellets and the capsule walls. The sensor Pt capsule was welded shut, and stored for 24 h in an oven at 110 °C before being placed in contact with the experimental Au-capsules inside a thin alumina tube sample holder.
3.3. Experimental equipment and procedure
All experiments were performed at 400 MPa and 1000 °C in a vertical internally heated
pressure vessel (IHPV). Either a molybdenum or a kanthal double-resistance furnace was used, allowing the 4–6 cm hot spot zone to be focused at the level of the sample holder.
Temperature was measured by two sheathed chromel–alumel thermocouples, calibrated at 1 atm against the melting point of NaCl (800.5 °C), and is considered known to within ±5 °C. Total pressure was monitored by a factory-calibrated Heise gauge, accurate to within 20 bar. Redox conditions were imposed and controlled by the fH2 prevailing in the pressure vessel. The IHPV was pressurized with either pure Ar gas or a mixture of Ar and H2 gases. In the case of pure Ar pressure medium, the intrinsic fH2 of the vessel is extremely low and imposes a very high fO2 (log fO2 NNO+3.4) when calculated under water-saturated conditions (i.e.,
aH2O = 1). To impose more reducing experimental conditions, Ar–H2 mixtures generated by sequential loading of H2 and Ar were used (see Scaillet et al., 1995, for additional details). Experimental redox conditions corresponding to log fO2 of the order of NNO+1 and NNO−1 were obtained by loading respectively about 1.5 and 15 bar of H2 gas in the vessel before Ar pressurization and heating (i.e., at ambient P and T). The fH2 values mentioned in Table 2 and Table 3 correspond to experimental hydrogen pressures calculated from the fO2 of the final products. The experiments were rapidly-quenched by electrically melting the Pt wire that suspended the sample holder in the vessel hot spot zone ([Roux and Lefèvre, 1992] and [Di
Carlo et al., 2006]). This caused the sample holder to drop to the cold end of the vessel with quench rates of the order of 300 °C/s. The duration of the runs was generally between 100 and 120 h. We show below that such durations are sufficient to produce experimental glasses with homogeneous equilibrated Au concentrations.
3.4. Analytical methods
After each experiment, the capsules were checked for leaks by weighing, then opened, and the experimental products were prepared for analysis.
3.4.1. Major and minor elements
Glass fragments were mounted in epoxy, polished successively to a final diamond grit of 1 μm, and coated with a 0.03 μm carbon film by using a standard thermal evaporation technique. Experimental glasses were analyzed for major elements with a Cameca SX50 electron microprobe (BRGM-CNRS facility, Orléans) equipped with five spectrometers. All data were obtained using 15 kV acceleration voltage, 6 nA beam current, a defocused electron beam (10 μm diameter) and peak counting times of 10 s. Multiple measurements were made for each sample ( 10 analyses) to increase analytical accuracy and check for the chemical homogeneity of the glasses. Natural reference minerals (albite, anhydrite and hematite) were used as standards. To minimize the effect of migration of the alkalis (Na, K) in these hydrated glasses, the measured concentrations were adjusted by applying correction factors for
volatilization determined from the analysis of the anhydrous starting glasses, taken as
reference. Given that peak counting times and analytical conditions were kept the same for all charges (including starting materials), the correction factors were calculated as a function of the glass H2O content for a given melt composition. The composition of silicate mineral phases present in some experimental charges (mostly clinopyroxene) was determined as above and using a focused electron beam ( 1 μm diameter).
The major element composition of oxide (magnetite) and sulfide (pyrrhotite) mineral phases was determined using 15 kV acceleration voltage, 20 nA beam current, a focused electron beam ( 1 μm diameter) and peak counting times of 10 s. Hematite, pyrrhotite, anhydrite and pure metals were used as standards. We also tried to detect Au as a minor component in those oxides and sulfides. A counting time of 30 s and a beam current as high as 250 nA were tested to reduce the limit of detection for Au. Although a detection limit as low as 330 ppm
(calculations after Ancey et al., 1978) was obtained, no trace of Au was found. Attempts were also made to analyze the Au-nuggets (see below). However, due to their small size, only partial analyses were obtained, confirming the presence of Au in major amounts.
Sulfur in starting materials (double-melting glasses) was measured by EPMA (JEOL JXA-8500F) in Taipei, Taiwan (IES-AS facility). Sulfur contents were always found to be below the detection limit (Table 1), even by using 15 kV acceleration voltage, 50 nA beam current, defocused electron beam (10 μm diameter) and peak counting times as long as 500 s. Such analytical parameters lower the limit of detection to less than 30 ppm S (calculated as three times the standard deviation of replicate measurements). Pyrite was used for calibration. Sulfur in experimental glasses was analyzed with a Cameca Camebax electron microprobe (BRGM-CNRS facility, Orléans) equipped with four spectrometers. This equipment, contrary to the SX50 probe, allows us to determine the concentration of a given element with each of the four spectrometers, simultaneously, leading to more accurate results. The data were
obtained using 15 kV acceleration voltage, 50 nA beam current, a defocused electron beam (10 μm diameter) and peak counting times of 10 s. The detection limit corresponding to such analytical parameters is of the order of 80 ppm S (Clemente et al., 2004). The S-added experiments were all conducted at reducing redox conditions (log fO2 NNO−1), and the resulting charges all show sulfide (pyrrhotite) crystals at equilibrium. Therefore, the
proportion of sulfur occurring as SO4 is believed to be negligible. Thus, since the position of the Kα line is dependent on the valency of S, only the position corresponding to S2− was chosen. Three standard glasses were used for calibration, with respective sulfur contents of 750, 1400 and 1900 ppm S. The analysis of these glass standards during each analytical session allowed calibration of the sulfur concentration as a function of the measured X-ray counts.
The Cameca Camebax electron microprobe was also used for determining the composition of the solid sensors. The metals analyzed were Ni, Co and Pd, together with Pt, Fe and S to control the absence of any contamination from the capsule. The data were obtained using 15 kV acceleration voltage, 21.5 nA beam current, a defocused electron beam (10 μm diameter) and peak counting times of 10 s. Pyrrhotite and pure metals were used for calibration.
3.4.2. H2O concentrations in experimental glasses
H2O contents of experimental glasses were determined by a Karl-Fischer coulometric titration method (Westrich, 1987). The apparatus employed was a Mettler Toledo KF DL 32
coulometer. For each experimental charge, multiple (at least 3) measurements were made successively; their average and the corresponding standard deviation (±2σ) are reported in Table 2 and Table 3. For each measurement, a 5–10 mg fragment of silicate glass was placed in a Pt crucible before being melted at 1300 °C in 5 minutes by an induction furnace. The amount of water vapour released from the silicate melt was then measured in the titration cell of the coulometer. The analytical error of this method, even for very low water contents, is of the order of ±0.1 wt% ([Westrich, 1987], [Holtz et al., 1992], [Holtz et al., 1995], [Behrens, 1995] and [Behrens et al., 1996]). For crystal-bearing charges, the glass H2O concentration was calculated from the measured bulk value by substracting the amount of crystals present, estimated by mass balance (see below).
3.4.3. Gold concentrations
Gold contents in experimental glasses were determined using laser ablation ICP-MS system at the Research School of Earth Sciences (RSES) of the Australian National University (ANU, Canberra). This system consists of a Lambda Physik LPX 1201 pulsed ArF excimer laser coupled to a Agilent 7500 ICP-MS (Sun et al., 2003). NIST 612 was used as the external standard and the isotope 29 of Si (29Si) was used as an internal standard.
A representative LA-ICP-MS signal is shown in Fig. 2a. Each signal is constituted of a first part corresponding to the background (laser off), then a second part corresponding to the actual measurement (laser on). The ablation was performed by drilling; thus the hole drilled becomes progressively deeper with time. The data were obtained using 22 kV acceleration potential, 120 mJ energy and a variable laser power from 0.6 to 1.3 W. The diameter of the laser beam and the pulsation frequency were optimized to 40 μm and 5 Hz, respectively, during 60 s, leading to a 20–25 μm depth hole. A background time half of the ablation time (i.e., 20 or 30 s) was chosen. At least three analyses were made for each experimental charge
to check for homogeneity. NIST 612 standard (Au = 4.58 ppm; Sun et al., 2004) was used for calibration and the calculation of Au concentrations. Besides gold and other noble metals, tantalum (Ta) was analyzed because this element may interfere with Au, following:
This interference was corrected based on the Ta concentrations; nevertheless, the difference between uncorrected and corrected results ranges from −1% (some uncorrected values lying slightly below the corresponding corrected concentration) to 10%, within the analytical errors (see supplementary information in Sun et al., 2004).
The limits of detection (LOD) for Au are shown in Tables 2 and 3 for each experimental charge. Each analytical point of every charge has its own LOD, although all analyses were conducted with the same laser beam diameter (40 μm). Here, the detection limits were calculated as three times the standard deviation of three replicate measurements of the background noise (consistently representative of the analytical blank). Therefore, for a given analytical point, LOD may vary conversely to the width of the ablation signal used for the calculation of Au concentrations (see Fig. 2), relative to both standards and background. However, LOD are always significantly lower than measured glass gold concentrations. The LOD/[Au] value ([Au] being the gold concentration in the glass) is up to 76% for one analytical point in charge C2K. However, most charges have LOD/[Au] in the range 0.02– 35%. Moreover, the σ/[Au] values (σ being the standard deviation of n replicate
measurements of glass gold content in one charge) are generally low, most of the
experimental charges showing σ/[Au] values lower than or equal to 10%. This demonstrates the high sensitivity of our gold concentration measurements and implies that gold is
homogeneously distributed in our experimental glasses, a condition necessary for the attainment of equilibrium in the experiments. In run no. 11, σ/[Au] values are higher (up to 32%, charge C4K), probably a consequence of the very low Au contents measured in those glasses (33 ppb in C2K; 50 ppb in charges C3K to C6K).
Fig. 2a shows stable metal counts (major elements other than Fe are not shown) which are easily converted to concentrations in melt. Another common type of LA-ICP-MS signal (Fig. 2b) is characterized by the presence of several metal concentration spikes (including Fe, but S was not monitored). Depending on which metals were involved in the spikes, signals of this type were interpreted to occur when the laser beam meets sulfides (as in Fig. 2b) or Au-rich metal (mainly Pt, Cr, Ni) alloys (called Au-nuggets throughout this study) during drilling. Only flat parts of the ablation signals were considered to be representative of Au dissolved in glass and used for the calculation of melt Au concentrations.
3.4.4. Analytical data processing
For each charge, water activity (aH2O) was calculated from the H2O content and the major element (excluding S) composition of glass, using the model of Burnham (1979). Oxygen fugacity (fO2, referenced to the NNO equilibrium, Pownceby and O’Neill, 1994) was calculated from both experimental fH2 and fH2O (the latter obtained from aH2O), following the water dissociation equilibrium:
(2)fO2=(Kw·fH2O/fH2)2with Kw taken from Robie et al. (1978). Experimental fH2 was determined from the sensor capsule since fO2 is known from the composition of the alloy
phase ([Taylor et al., 1992] and [Pownceby and O’Neill, 1994]) and H2O is present in excess (hence fH2O = fH2O°). The fO2 is known to better than 0.25 log units ([Scaillet et al., 1995] and [Martel et al., 1999]). For S-bearing charges, fS2 was calculated from the composition of pyrrhotite (Froese and Gunter, 1976) and fSO2 and fH2S by using the equilibrium constants of Ohmoto and Kerrick (1977).
The crystallinity of experimental charges was determined by mass balance, using the electron microprobe compositions of the starting glass and of all condensed phases present. The calculations were performed using a least-squares technique adapted from Albarède (1995) based on eight major oxides, excluding MnO and H2O. Phase proportions were calculated together with bulk composition, and Fe loss was obtained from the difference between calculated and starting compositions.
4. Results
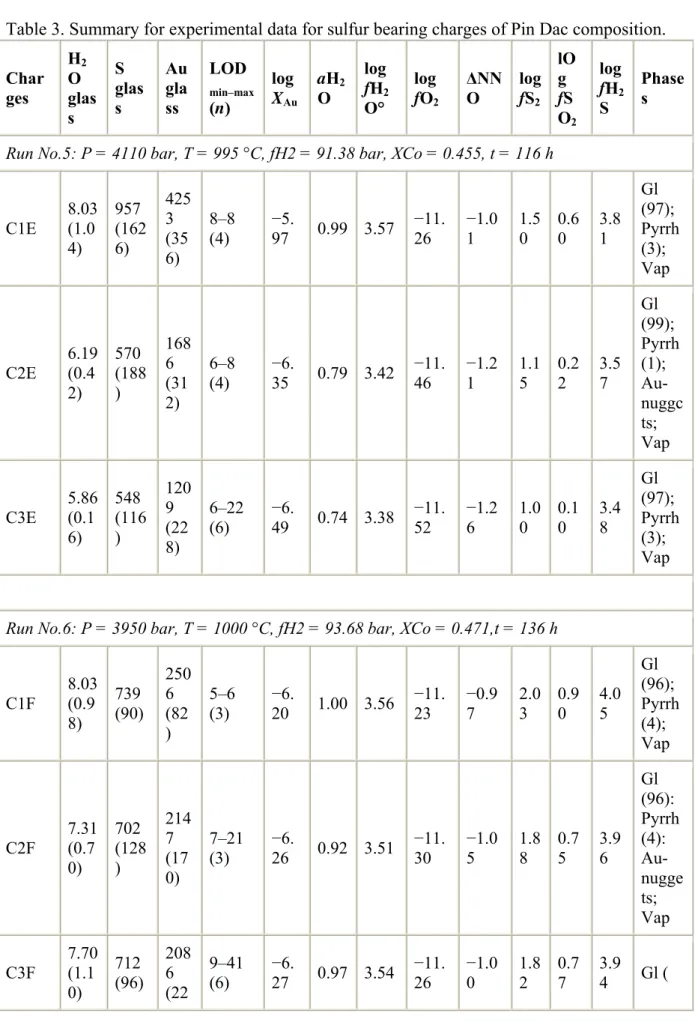
Results for a total of 27 charges, including 21 S-free and 6 S-added are reported. Experimental conditions and results for the sulfur-free and sulfur-added charges are summarized in Table 2 and Table 3, respectively.
4.1. Experimental parameters (aH
2O, fO
2, fS
2)
H2O contents in S-free experimental glass range from 4.13 to 9.22 wt% (Table 2), with corresponding aH2O values ranging from 0.49 to saturation (i.e., aH2O = 1), the latter condition being attained in only a few charges (6 on 21). Melt H2O concentrations at saturation are close to 8 wt% (bracketed by charges C1B: 8.28 wt% and C6K: 7.60 wt%). They differ little between the three investigated melts, in agreement with their similar major element compositions (Table 1). In the S-added charges, performed only with the Pin Dac composition, the H2O contents range between 5.86 to 8.03 wt% (Table 3). The latter concentration is identical to the water saturation found in S-free experiments on the same composition (compare charges C1E and C1F, Table 2 and Table 3). Thus, for the Pin Dac composition, maximum H2O concentrations in glasses are not significantly different in the sulphur-free and sulphur-added experiments.
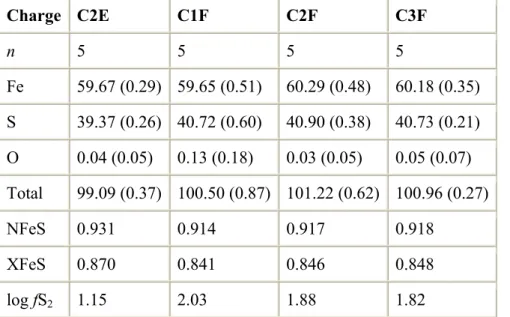
Oxygen fugacity values in our S-free experimental glasses range from NNO−1.62 to NNO+2.62 (Table 2). A wide fO2 range has thus been investigated, encompassing different redox conditions: reducing (run 11) and moderately to highly oxidizing (runs 1, 2 and 10). The S-added experiments were all conducted in a reducing environment, leading to very homogeneous fO2 values (from NNO−1.26 to NNO−0.97, Table 3), and enabling comparison with the S-free experiment at nearly the same fO2. The calculated sulfur fugacity values (see Table 6) vary by more than one order of magnitude (1.00 < log fS2 < 2.03), while melt sulphur concentrations range from 548 to 957 ppm. Note that fS2 in both charges C1E and C3E were estimated from their glass S concentrations, because pyrrhotite crystals large enough to be satisfactorily analyzed by electron microprobe were not found.
4.2. Experimental products and compositions
Charges in both sulfur-free and sulfur-added experiments comprise silicate glass and a small proportion – generally less than 5 wt% – of crystalline phases (silicates, oxides, sulfides, rare metallic phases, Table 2 and Table 3; see Fig. 3a for a texture typical of most of our run products). A vapour phase is considered to be present for H2O-saturated charges, i.e., for
charges with aH2O = 1 (Table 2). In the S-added experiments, a free fluid phase is also considered to be systematically present (i.e., the system at equilibrium is fluid-saturated), even if the melt is strictly-speaking H2O-undersaturated (aH2O < 1) in the experimental conditions: this is because S is relatively insoluble in silicate melts and systematically induces the formation of a S-rich vapour phase (containing mainly H2S + SO2 + S2 + H2O) at
equilibrium, whatever the aH2O calculated in the corresponding S-free system (from Burnham, 1979; see Section 3.4.4) may be. Then, the presence of a vapour phase leads to significant partitioning of all components from liquid to vapour, notably gold (e.g., [Ulrich et al., 1999], [Sun et al., 2004] and [Simon et al., 2007]). Given the amounts of H2O initially loaded in the capsules, this vapour phase is present in very low amounts (<2–3 wt% of the total charge). Besides, the major part of the exsolved fluid phase was as a whole free out of the melt, i.e., not trapped into bubbles or fluid inclusions. Therefore, the gold concentrations obtained by ablating the melt quenched to glass are believed to truly reflect that in the melt, not the combined total of melt + fluid gold contents. It follows that the determination of gold in the fluid phase turned out to be technically difficult due to this quasi-absence of bubbles in our experimental products. This is one reason why we did not examine here the partitioning of gold between melt and fluid. Yet, we aim to stress that the main goal of the present study was not to examine the process controlling gold partitioning during volatile exsolution at the hydrothermal stage, which has already been much investigated ([Bezmen et al., 1994], [Fleet et al., 1996], [Fleet et al., 1999], [Crocket et al., 1997], [Jugo et al., 1999], [Frank et al., 2002], [Simon et al., 2003], [Simon et al., 2005] and [Simon et al., 2007]), but to focus on the
solubility and transport of gold in melt at the magmatic stage.
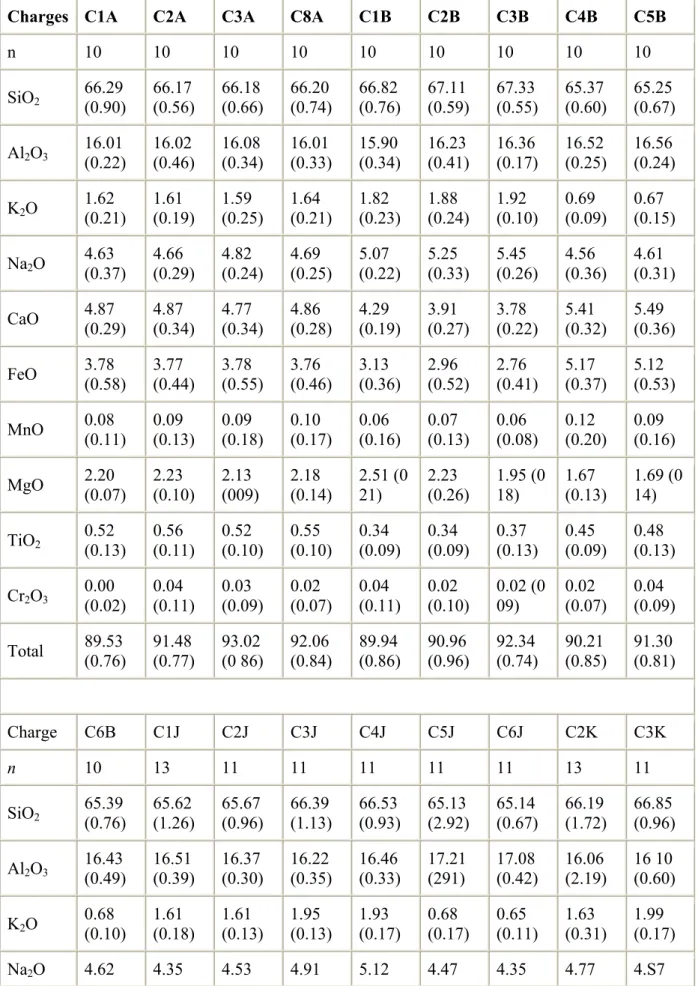
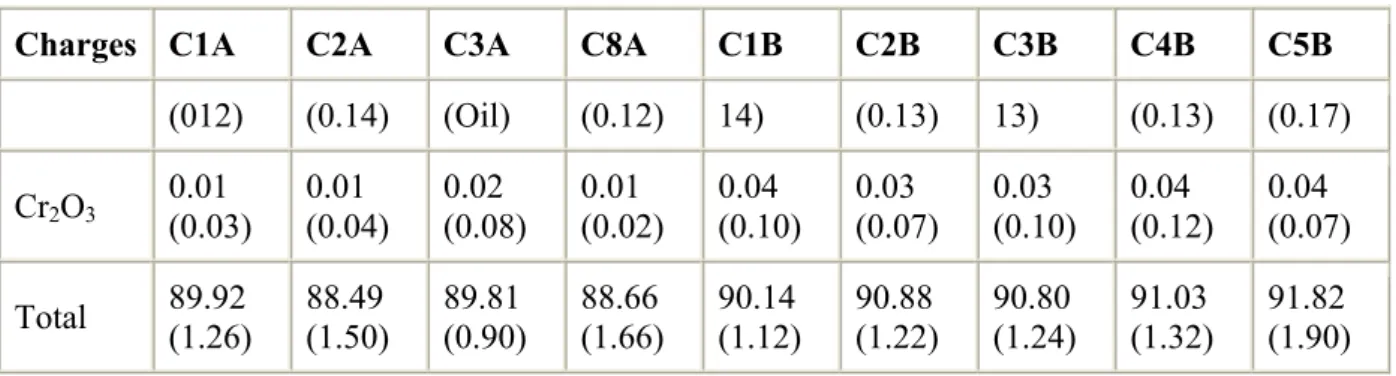
Major element compositions of experimental glasses are given in Table 4. They are quite similar to their respective starting glass compositions, since the proportion of condensed phases is always very small in the run products. However, significant depletions in CaO, FeO, MgO and, to a lesser extent, TiO2, associated with enrichments in Na2O, occur in some
glasses, such as C3A (low Ca, Mg; high Na) and C4K (low Ca, Mg, Ti) when compared to the respective starting compositions (see Table 1). These chemical changes are consistent with fractionation of clinopyroxene (Cpx), as clearly shown for example by the correlation
between the mass fraction of Cpx in charges C1B to C3B (run 2, composition Bal2, Table 2) and the magnitude of the depletions in the above oxides. Depletions in FeO in S-free glasses are also observed without any association with Cpx fractionation (e.g., charges C5J–C6J, run 10, Table 2), and can be related to the crystallization of magnetite. Finally, charges of
experiments 1, 2 and 11 are characterized by systematic Fe losses (7.8–8.9% in run 1; 2.2– 9.3% in run 2; 19.3–31.8% in run 11; see ΔFeO values in Table 2 for details). Since these iron losses were determined by mass balance calculations between the starting compositions and our final experimental charges (glass + crystals), they indicate Fe alloying with Au from the capsule. The highest Fe losses are found in run 11 which is the most reduced. ΔFeO values were not calculated for S-added charges since most of available Fe partitions from the melt to pyrrhotite crystals, preventing significant Fe alloying with capsule walls.
Silicate crystals present in both S-free and S-added experiments are diopside-rich
clinopyroxenes (Table 5), with sizes mostly less than 20 μm (Fig. 3a and b). Oxides are found only in the most oxidizing S-free experiment (run 10, Table 2); most have a size from <1 to a few μm. Satisfactory electron microprobe analyses were obtained only for oxides from charge C6J (Fig. 3c; Table 2) and demonstrate that these oxide phases are magnetites (Table 5). Sulfides have similar Fe/S atomic ratios, close to 1, implying that these sulfides are pyrrhotites (Fe1− xS, with 0 < x < 0.2; see Table 6). No evidence was found (from the
composition of sulfides) for the presence of an immiscible Fe–S–O sulfide liquid under our experimental conditions.
Tiny spherical gold blebs (generally about 1 μm in size, hereafter designated as gold nuggets) were commonly found spatially associated with magnetite in three charges of the most
oxidizing experiment (run 10). Some Au-nuggets slightly larger in size were also found in close textural association with pyrrhotite (Table 3; Fig. 3d). Despite their common spherical shape, these gold particles are not thought to have passed by a liquid state during the
experiment, since the melting point of Au at 1 bar is close to 1060 °C. Simon et al. (2007) also reported the presence of Au-nuggets in their experimental charges from the analysis of their LA-ICP-MS ablation signals. However, the inferred particles were not directly
observable, probably due to their sub-micron size, and Simon et al. (2007) considered these Au-nuggets to be quench phases. In contrast, our SEM observations (see Fig. 3d) suggest that the nuggets in this study are phases stable at our experimental P and T. Indeed, the Au-nuggets are systematically associated with magnetite and pyrrhotite crystals, suggesting that their appearance is related to the oxide/sulfide crystallization mechanism. In addition, as illustrated by Fig. 3d, Au-nuggets in our experimental products can be as large as 10 μm in diameter when in spatial association with sulphide crystals. Such grain sizes are unlikely for quench phases, especially considering the characteristics of the quench in this study (isobaric and very fast, lasting <5 s). Therefore, we interpret the nuggets as having formed at
experimental P and T from a locally Au-saturated melt boundary layer generated during growth of oxides and sulfides. This interpretation provides the justification for not considering the Au spikes in the ICP-MS ablation signals for the calculation of the gold melt
concentrations (see above, Fig. 2 and Section 3.4.3) since the nuggets were not formed during quench.
4.3. Au concentrations in glasses
Gold contents of sulfur-free and sulfur-added experimental glasses are presented in Table 2 and Table 3, respectively. Concentrations have been recalculated as mole fractions of Au dissolved in glass (XAu) by using glass major element concentrations and water contents from Table 2, Table 3 and Table 4.
The distribution of the gold contents as a function of fO2 is shown in Fig. 4 for the S-free charges. Globally, the data show that Au concentrations increase with increasing fO2. For example, for Bal2, Au concentrations range from 50 ppb under reducing conditions to
236 ppb under oxidizing conditions (Fig. 4). In the same way, 50–55 ppb Au are dissolved in PhM5 at NNO−1.35, reaching 240 ppb at around NNO+2.5. The evolution of Pin Dac gold contents is similar, with 33 ppb Au for reducing conditions, steeply increasing to 237 ppb at around NNO+2.5. Overall, it is worth stressing that the increase in the gold concentration along the entire experimental fO2 range (which covers more than 4 log units) is smaller than one order of magnitude. In comparison to the effect of fO2, there is no systematic influence of
aH2O on the Au concentrations in glasses from the S-free charges.
All three investigated samples show a maximum of gold solubility around 240 ppb Au (Fig. 4) for the highest fO2. In contrast, at lower fO2, differences appear between the three starting compositions. In the middle of the fO2 range, Au concentrations for the Pin Dac melt
composition are lower than for PhM5, these latter being lower than for Bal2. At low fO2, the composition with the lowest Au concentration is also Pin Dac. However, the Pin Dac
experiment was carried out under lower fO2 (Fig. 4). Therefore, this minor difference in Au concentrations may be related to fO2.
The Au concentration data for the S-added charges with the Pin Dac sample are shown plotted on Fig. 5. Au concentrations are much higher in the S-added than in the S-free charges,
ranging from 1200 to 4250 ppb. This corresponds to an increase of Au concentrations in glasses by factors of 25–85 in comparison with the S-free glasses in the same range of fO2. Thus, there is a dramatic increase (of more than one order of magnitude) of the concentration of gold in glasses when S is added at nearly constant fO2 (around NNO−1 to −1.5). In detail, the Au concentrations for the S-added charges are strongly positively correlated with fO2 (Fig. 5), despite the narrow fO2 range (ΔNNO varies only from −0.97 to −1.26, Table 3). However, it is worth noting that, in these S-added charges, the fO2 variation is obtained by changing the melt H2O content (or aH2O, see Table 3). Therefore, in contrast with the S-free charges, the S-added charges exhibit a clear positive correlation between their Au concentrations and their
aH2O which simply reflects the fact that aH2O and fO2 are correlated in our experiments.
5. Discussion
5.1. Attainment of equilibrium
Electron microprobe analyses of experimental glasses and clinopyroxenes have standard deviations in most cases lower than analytical uncertainties (Table 4 and Table 5), indicating that these phases are homogeneous in terms of their major elements. Glasses in the S-added charges also have homogeneous sulphur concentrations. For gold, the statistics of the Au analyses, detailed above, imply that gold is homogeneously distributed in our experimental glasses. The ability of the melt to homogenize with respect to Au can be tested by considering the amount of time required for Au to diffuse through the melt at run conditions. Calculation of the diffusion distance of gold can be performed by assuming that the diffusivity of Au (taken as Au1+) is intermediate between that of the univalent metals Na and Cs (Simon et al., 2007). Thus, at 1000 °C and for 6 wt% H2O in the melt, a gold diffusivity of 10−10 m2/s is obtained from Watson (1994). This yields a diffusion distance of 6 mm for experimental durations of 100 h. Therefore, our experimental conditions (durations, temperature and melt H2O contents) and capsule geometries (see above) effectively enabled gold to be
homogeneously distributed within the melts, even though a significant proportion of Au3+ is to be considered in the calculation. In addition, the attainment of equilibrium in our charges is strongly supported by the results of time-series runs performed by Bezmen et al. (1994) that show that gold equilibrates between sulfide and mafic/intermediate silicate melts after 30 h at 1250 °C and 4 kbar, for a silicate charge of 6 mm in diameter and 6 mm in height, weighing 300–350 mg (i.e., more than 10 times the weight of our silicate charges). For H2O in glasses, only bulk analytical data are available. However, multiple Karl-Fischer measurements were performed on each glass sample; standard deviations (±2σ) are generally <1%, indicating homogeneity. Considering that glass powders were used as starting materials, the
experimental durations in this study (>100 h) and the diffusivity data for of H2O in silicate melts of intermediate composition (Liu et al., 2004), water is certainly distributed
homogeneously in the experimental glasses. Therefore, we conclude that our experimental phases are chemically homogeneous, a condition necessary for equilibrium.
Nevertheless, it is worth emphasizing that all experimental glasses in this study attained their final gold concentrations from the low concentration side since gold concentrations in starting materials are lower than in experimental glasses. Gold solubility was in no case approached
from the high concentration side. Thus, our Au concentration data have not been reversed. Yet, various lines of evidence, detailed below, suggest that the Au concentrations measured in the glasses can be considered as equilibrium solubilities at high P and T. (1) Gold concentrations in the experimental glasses from this study vary by more than two orders of magnitude, ranging from 33 to 4253 ppb (Table 2 and Table 3). Gold concentrations in glasses correlate with the experimental parameters and with melt composition (Fig. 4), so that the variations in gold concentrations between samples can be ascribed to differences either in fO2,
presence/absence of S or melt composition. This would be unexpected if Au concentrations in glasses were influenced by kinetic factors. Nevertheless, it is true that those parameters (fO2,
fS2, composition) are also often incorporated into the equilibrium constant and then, they may potentially exert a control on the kinetics of reactions. There are no data in the literature which constrain the effect of such parameters on the diffusion rate of gold; however – for example – Watson (1994) reports a relatively small fO2 effect on the diffusion rate of sulfur, implying that the diffusing species and/or diffusion mechanism is relatively independent of
fO2. In fact, it can be assumed that those parameters might have a significant effect on the diffusion rate of gold during the first few hours of an experiment – i.e., well before the attainment of equilibrium – but they are very unlikely to be the cause of the observed correlations after more than 100 h. (2) Duplicate experiments were performed to check for reproducibility. Run no. 6 is a duplicate of run no. 5 (Table 3). Gold solubilities in these two experiments are mutually consistent and the results stress the direct dependence of gold solubilities with glass S concentrations (the high standard deviation of the S measurements in glass C1E is due to an unusually slow quench of the run no. 5, see Table 3). (3) In this study, a fast quench device was used systematically. The Au-nuggets present in some charges correspond to stable phases present at experimental P–T conditions and not to phases precipitated during quench. Therefore, the gold concentration of the melt did not suffer any modification during quench, implying that the Au concentration data reported unambiguously concern gold concentrations in the melts at high P and T.
5.2. Influence of fO
2on the solubility of gold
5.2.1. Thermodynamic analysis of the solubility of Au in silicate melts
The dissolution of a given trace metal, here Au, in a silicate liquid can be expressed by the following equilibrium (e.g., O’Neill et al., 1995):
where AuOx/2(melt) stands for the metal species dissolved in the silicate melt, and x represents the effective valence of the dissolved metal species. The value of x is not necessarily an integer, since the metal dissolution mechanism may imply several metal species with different valences. A special case not usually considered, but which might become important for gold, is if x = 0, i.e., gold dissolves as a neutral species. The equilibrium constant (KAu)
where and are the mole fraction and the activity coefficient of Au in the metal phase and the mole fraction and activity coefficient of the Au species
dissolved in the melt. In our experiments, melts were equilibrated with pure gold metal. Therefore, the activity and the mole fraction of gold in the metal can be taken equal to unity. Note that this assumption does not necessarily apply in the case of the most reduced charges where alloying of Fe with Au from the capsule takes place. However, in this study, no correction has been introduced to account for the reduction of the concentration of Au in the metal phase that results from alloying with Fe. Thus it follows that:
At given temperature T and pressure P, log KAu is constant. If we assume that log is independent of the concentration of metal dissolved in the melt, and of ƒO2 and T (but not necessarily of the melt composition), it follows that:
where C = −log KAu − log (thus C is constant for a given melt composition). Eq. (6) is the basic relation used in this study for the interpretation of the experimental results. Note that the hypothesis of log( ) being independent of the metal concentration in the melt is equivalent to assuming that metal dissolution follows Henry’s law for our investigated ranges of metal concentration, T and fO2.
5.2.2. Gold solubility mechanism
Eq. (6) implies that, at a given temperature, metal solubility is linearly related to ƒO2, with a slope equal to x/4. Thus, the valence of a metal dissolved in a silicate melt (x) may be
determined from the slope of the dependence of log with log ƒO2. For S-free charges, in the oxidizing part of the diagram (above NNO+1.5 in Fig. 6a), linear fits to the solubility data (all compositions taken together) yield a slope of 0.374. This value lies between 0.25 and 0.75, which are slopes shown for reference to indicate, respectively, gold dissolution as Au2O (e.g., [Borisov and Palme, 1996] and Borisov and Palme, 2000 A. Borisov and H. Palme,
Solubilities of noble metals in containing silicate melts as derived from experiments in Fe-free systems, Am. Mineral. 85 (2000), pp. 1665–1673. [Borisov and Palme, 2000]) and Au2O3, both Au1+ and Au3+ species being stable forms of gold commonly found in natural systems (e.g., Cotton, 1997). Therefore, gold dissolution in this fO2 range for our intermediate composition melts must involve the oxidized species Au3+. At first sight, a slope of 0.374 strongly suggests the contribution of Au3+ and Au0 (metal) in equivalent proportions. Another important point is that the data in the more reducing part of the diagram (Fig. 6a) do not lie on extensions of the slopes defined in the oxidized fO2 range. This is interpreted to suggest important changes in the dominant Au species with fO2. The observed slope of 0.045 along the reduced range may be the result of a gold solubility mechanism based mainly on the involvement of Au metal, with a minor contribution of Au1+. We conclude, therefore, that the Au solubility data cannot be satisfactorily fitted with a unique Au species in the entire fO2 range considered. Nevertheless, the data for the 3 intermediate compositions investigated consistently indicate a mechanism of Au solubility implying, at least in the oxidizing fO2
range, a more oxidized Au species (i.e., Au2O3) than found for the haplobasaltic system ([Borisov and Palme, 1996] and [Borisov and Palme, 2000]).
Concerning the S-added charges, it is worth stressing that fH2O, but also fS2, vary along with
fO2 so that the changes in Au solubility represented in Fig. 6b can not be attributed to the influence of fO2 alone. Therefore, the effect of fS2 on gold solubility has to be considered in detail in forthcoming studies.
5.2.3. Constraints on gold speciation
Data from this study have been analyzed in greater detail by assuming the existence of multiple dissolved Au species. It is worth stressing here that there is presently no direct spectroscopic evidence on the nature of Au species dissolved in silicate melts such as those presented here. Our analysis does not claim to substitute for such data and should be viewed as nothing more than a fit of our solubility measurements.
The measured gold solubility ( ) is the sum of all dissolved Au species present in the silicate melt, as:
where n is the number of different dissolved Au species and corresponds to
dissolved gold species i. For each , we can write a dissolution equation such as Eq. (3). The main difference is that xi (the valence of the dissolved gold species i) is now an integer 0. From Eq. (6), for each dissolved species we can write:
With C(i) = −log KAu(i) − log where KAu(i) and are respectively the equilibrium constant of the dissolution equation and the activity coefficient corresponding to the dissolved gold species i. As above, is assumed to be constant for each of the three silicate
compositions investigated, which implies that C(i) is a constant at fixed P and T. By replacing the concentrations with their respective values, we obtain:
Eq. (9) has been used to fit our experimental gold solubility data. The constants C(i) were determined by multiple linear regression from our solubility data at different ƒO2, i.e., their respective values were estimated by least-square minimization of the difference between measured and calculated (e.g., Albarède, 1995). Once the constants are determined, the concentration of each dissolved gold species can be calculated from Eq. (8).
Results with this approach are illustrated in Fig. 7, using experimental data obtained with the Bal2 composition. Several models involving combinations of two and three dissolved Au species were tested. The best model (the one minimizing the differences between measured
and calculated Au concentrations) was obtained for a combination of three dissolved Au species (Au0, Au1+ and Au3+, Fig. 7). Au concentrations in glasses calculated with this model are compared with experimental results on Fig. 7a. The agreement is shown to be excellent, providing an a posteriori validation of the model and, in particular, of the hypothesis of log
being constant with gold concentration for a given melt composition. Results with combinations of two species proved to be less satisfactory, significant differences being noted between computed and measured Au concentrations (Fig. 7b). The evolution of the relative proportions of the dissolved Au species with ƒO2 (Fig. 7c) shows a symmetrical variation for the metallic (Au0) and the most oxidized species (Au3+). Thus, Au0 decreases drastically when ƒO2 increases: it still represents 50% of gold dissolved in melt at ƒO2 around NNO+1.6, but drops to 20% at NNO+2.6. For the most oxidizing conditions, about 70% of gold is present as Au3+. The proportion of the Au1+ species remains low (<20%), showing little variation across the entire ƒO2 range (Fig. 7c). It is worth stressing that the species (Au1+ and Au3+) used in the modelling of the Bal2 gold concentration data are considered as the two most stable and common forms of gold in nature (e.g., Cotton, 1997).
For the two other compositions, the measured gold concentrations were not satisfactorily reproduced by a combination of two or three species among Au0, Au1+ and Au3+. The best fits were “virtually” obtained with the involvement of other oxidized species, i.e., Au4+ for PhM5 and Au5+ for Pin Dac. However, neither AuO2 nor Au2O5 are reputedly stable gold oxides in natural systems, and especially in silicate melts at magmatic conditions (as opposed to hydrothermal conditions). Therefore, such species cannot be considered as acceptable alternatives. Neither can S-complexing with Au in the melt be considered as a possibility for the steepness of the line instead of more oxidized Au species, since starting materials sulfur contents are lower than 30 ppm (Table 1). We have actually a small number of experiments to draw the line to evaluate the gold species in melt, so data interpretation must be made with caution. Nevertheless, although our modelling of Pin Dac and PhM5 gold speciation does not accurately reproduce the measured compositions by using a combination of Au0, Au1+ and Au3+, the gold dissolution mechanism appears qualitatively similar for the three hydrous intermediate composition melts investigated.
Our thermodynamic analysis requires that a neutral Au species is involved: for all
compositions, at least 95% of gold is dissolved as Au0 at NNO−1.5 (see Bal2; Fig. 7c). This dissolution mechanism is not very effective for Au to be incorporated in melts as shown by the low gold contents of all reduced charges, irrespective of the starting composition ( 50 ppb Au). Upon increasing fO2 above NNO, oxidized Au species are involved whose stoichiometries are in detail dependent on the silicate melt base composition. For the three compositions, a minimum of gold solubility for a log ƒO2 comprised between −10 and −10.75 (−0.50 < ΔNNO < +0.25) is found from the modelling (Fig. 7a). This minimum, which has been previously observed in a number of studies for precious metals (PGE, Borisov and Palme, 1996) as well as for some volatile elements, notably sulfur ([Scaillet and Pichavant, 2003], [Clemente et al., 2004] and [Scaillet and MacDonald, 2006]), also occurs in the same range as the change of iron speciation (Fe2+/Fe3+) in silicate melts (Gaillard et al., 2001). It is here interpreted as reflecting the change in the gold dissolution mechanism from a Au0 -dominated fO2 domain to an oxidized Au species-dominated fO2 domain.
5.3. Influence of sulfur on the solubility of gold
The gold dissolution data obtained with the Pin Dac composition in presence of sulfur under reducing conditions (fO2 NNO−1) show that the solubility of gold in silicate melts is
dramatically enhanced (by 25–85 times) in comparison with S-free glasses at the same fO2 (Fig. 5). These results provide the first quantification of the dramatic influence of sulfur on the solubility of gold at fO2 < NNO. They confirm the highly chalcophile behavior of gold in hydrous melts previously noted in several studies ([Jugo et al., 1999], [Jugo et al., 2005] and [Simon et al., 2007]). Although the data presented in this study are too scarce to firmly constrain the dissolution mechanism of gold in presence of sulfur, oxidized gold species should be present in minor amounts at the fO2 of the S-added experiments. Dissolution of gold as neutral Au species is also unlikely since this would not account for the nearly two orders of magnitude increase of the solubility of gold when S is present (Fig. 5). Therefore, complexing between Au and S dissolved in the melt (as S2− at fO2 < NNO; e.g., Clemente et al., 2004) most probably occurs, as shown by the correlation between the gold and sulfur concentrations in the melt (Fig. 8) and, for a given run, by the correlation between log XAu and log fS2 (Table 3), compatible with a Au–S complex of stoichiometry Au2S.
5.4. Influence of silicate melt composition on the solubility of gold
The results presented above demonstrate that gold solubility in hydrous intermediate composition melts (1) is very sensitive to variations in fO2 but relatively insensitive to variation in aH2O (at constant fO2), (2) increases with fO2, implying a mechanism of
dissolution involving at least one oxidized Au species and (3) is dramatically increased in the presence of sulfur. Below, we focus on the influence of the silicate composition on gold solubility.
Leaving the sulfur-added charges aside since they concern only one starting composition (Pin Dac), the maximum measured gold solubility values are identical for the three melt
compositions studied ( 240 ppb), and occur at sub-equal fO2 ( NNO+2.6, Fig. 4). This observation runs counter to the starting hypothesis that adakitic magmas may incorporate more gold than typical calc-alkaline magmas. Yet, significant differences in Au
concentrations are observed between the three melts. At fO2 less oxidizing than NNO+2.6, the intermediate adakite (Pin Dac) is less gold-enriched than the typical calc-alkaline magma (PhM5), the latter showing lower gold solubility values than the genuine adakite (Bal2). For conditions below NNO, the difference between the calc-alkaline and the adakite vanishes, but the intermediate adakite composition is still less enriched in gold (Fig. 4). It is worth
emphasizing that these differences do not correlate with the respective degree of adakitic imprint of the melts in terms of trace elements contents and ratios (e.g., Sr/Y and Y). Therefore, the various degrees of adakitic imprint of the three starting compositions are not responsible for the observed differences in gold solubility. Such differences most likely arise because of the influence of other compositional factors, i.e., variations in major elements (typically in silica, alkalis and iron) between the three melts. These compositional factors do not come into play in the distinction between adakitic and non-adakitic magmatism (e.g., [Defant and Drummond, 1990], [Sen and Dunn, 1994], [Martin, 1999], [Defant et al., 2002] and [Martin et al., 2005]) and are, therefore, disconnected from any adakitic signature.
5.5. Comparison with previous solubility data
Most of previous studies focused on the determination of the partitioning of gold ([Bezmen et al., 1994], [Fleet et al., 1996], [Fleet et al., 1999], [Crocket et al., 1997], [Jugo et al., 1999], [Frank et al., 2002], [Simon et al., 2003], [Simon et al., 2005] and [Simon et al., 2007]) rather than carefully looking at its solubility in melt. Besides, the experimental conditions or melt compositions of the few studies reporting gold solubility data always differ from ours, making
difficult any comparison. For instance, the solubility of gold in haplogranitic S-free melt at 800 °C and 1–1.5 kbar – in presence of NaCl–KCl–HCl-bearing fluids – is estimated at 500 ppb ([Simon et al., 2003] and [Simon et al., 2005]) and 2.5 ppm (Simon et al., 2007) around NNO, and 1 ppm at very reducing conditions ( NNO−3.5; Frank et al., 2002). Despite a significant heterogeneity, all these values are much higher than our S-free data along the fO2 range investigated, but they do fit quite well with our results in presence of sulfur (see Fig. 5), probably because of the influence of high-salinity dissolved fluids. Borisov and Palme (1996) report gold solubility values from 300 to 1000 ppb in anhydrous
haplobasaltic S-free melt at ambient pressure and 1300–1400 °C, along the same fO2 range than ours. Those values still are significantly higher (by almost one order of magnitude) than our S-free data, most likely due to the very high experimental temperatures.
Concerning previous results in presence of sulfur, Simon et al. (2007) report a gold solubility of about 600 ppb at NNO (same experimental conditions and melt composition than their S-free runs; see above) and Jugo et al. (2005) give evidence for a solubility on the order of 500 ppb in anhydrous basaltic melt (1300 °C, 10 kbar) in reducing conditions, while a solubility value of 800 ppb is reported by Bezmen et al. (1994) in the Bushweld Complex melt ( 56 wt% SiO2) saturated with H–C–O–S fluids (1300 °C, 4 kbar, NNO). Those three solubility values are noticeably lower than our own results at NNO−1, albeit comparable to the lowest value of our S-added dataset ( 1200 ppb). On the other hand, Jugo et al. (1999) report a gold solubility of about 4 ± 2 ppm in hydrous haplogranitic melt (850 °C, 1 kbar) in reducing conditions that fits very well with our highest solubility value ( 4200 ppb).
6. Implications for ore-forming processes
6.1. Importance of intensive parameters and magma source
From the preceding discussion, it may be concluded that adakitic magmas are not more specialized with respect to gold incorporation and transport than other non-adakitic intermediate magmas. In fact, the variations in gold concentration that arise from
compositional factors in this study are rather restricted, being much less than one order of magnitude (Fig. 5). In comparison, the range of gold concentrations in melts that results from experimental fO2 changes between NNO−1 to NNO+3 and, more markedly, from the addition of S to the system, is wider, exceeding one order of magnitude. Therefore – provided that gold is present in sufficient amount in the magma source(s) to potentially lead to the formation of economic deposits – what really matters to evaluate the ability of a given magma to incorporate and transport gold is the knowledge of the intensive magmatic parameters, mainly fO2 and fS2.
Then, the testing of the starting hypothesis that adakitic magmas are specialized with respect to gold is equivalent to enquiring the fO2 and fS2 of adakitic magmas. But, there is no
indication in the literature about a systematic higher fO2 or sulfur-enrichment in adakites compared to typical calc-alkaline magmas. On the contrary, Wang et al. (2007), for instance, suggest a fO2 reduction by slab melts below South America. Then it might be suggested that some of the preferential associations observed between certain adakitic magmas and major gold deposits (e.g., [Baldwin and Pearce, 1982], [Thiéblemont et al., 1997], [Sajona and Maury, 1998], [Gonzalez-Partida et al., 2003], [Levresse et al., 2004] and [Rae et al., 2004]) may be related to a greater availability of gold in the magma source(s).
6.2. Slab melting as source of metals?
Adakitic magmas mainly differ from normal subduction-linked calc-alkaline magmas by their typical trace element signatures (see Section 2.1) that led most authors to admit a predominant role of garnet fractionation during adakite petrogenesis. However, many hypotheses regarding the origin of adakites are still debated (see Richards and Kerrich (2007) for a recent synthesis). This includes notably the hydrous partial melting of subducted garnet-bearing metabasalts (original proposal of Kay, 1978 and Defant and Drummond, 1990, supported by many later authors including [Sajona et al., 1993], [Sajona et al., 1994], [Sajona et al., 2000a] and [Sajona et al., 2000b], and Stern and Kilian, 1996).
Concerning the gold (and sulfur) budget of adakitic magmas, the petrogenetic models involving slab partial melting may potentially lead to an enrichment of Au and S in melt compared to normal calc-alkaline magmas. According to this hypothesis, the subducted metabasalts would act both as protolith and source of metals. In the other models of adakite petrogenesis, as well as in the case of calc-alkaline magma genesis, sources of gold and other metals are mainly mantle protoliths from the wedge (Mungall, 2002), the latter containing on average up to 1.5 ppb Au (e.g., [Mitchell and Keays, 1981], [Lorand et al., 1999], [McInnes et al., 1999] and [Borisov and Palme, 2000]). In comparison, amphibolitic rocks (i.e., archean greentones and modern oceanic metabasalts) generally contain <2 ppb Au ([Greenough and Fryer, 1990] and [Togashi and Terashima, 1997]). Borisova et al. (2006) estimated that a bulk slab composed of 90 wt% fresh MORB + 5 wt% altered MORB + 5 wt% sediment has Au concentrations up to 5 ppb Au. Nevertheless, it is worth stressing that an average subducting oceanic crust is likely to be as well composed of at least several wt% of polymetallic massive sulfides deposits. Herzig and Hannington (1995) report that gold concentrations are locally high in mid-ocean ridge deposits (up to 6.7 ppm Au, with an overall average of >1.2 ppm Au), and may reach concentrations of more than 50 ppm Au in massive sulfides from particular areas, like immature back-arc rifts. Thus, assuming an average amount of 5 wt% massive sulfides (with an average gold concentration of 1.2 ppm) in the subducting slab, 5–20% partial melting of the bulk slab may lead to a sulfur-rich slab melt gold content ranging between 300 and 1200 ppb, provided that residual sulfide is minimal (i.e., most of sulfides dissolve into the partial melt; Mungall and Naldrett, 2008) and Au behaves as a highly
incompatible element (Borisova et al., 2006). Therefore, and although the calculations need to be refined especially by taking into account the mobilities of Au and S in slab-dehydration fluids which are presently virtually unknown, the subducted slab clearly represents a potentially favourable protolith for the genesis of magmas specialized with respect to gold. This assumption is supported by the recent experimental work of Spandler et al. (2007) which shows that simple slab-dehydration models may be unable to account for trace element
transfer from the slab to arc magmas.
7. Conclusions
The data presented here show that in a sulfur-free system the solubility of gold is similar in typical calc-alkaline and adakitic magmas with comparable silica content. For a given fO2 range, the gold concentrations appear very similar in the three compositions studied. The slight differences which can be noted between the three samples in the moderately oxidizing
fO2 range are not correlated to an adakitic signature (the latter being linked essentially to the trace elements contents), but rather is controlled by compositional differences concerning the major elements, such as alkalinity and the iron content of the melt. The maximum gold solubility value reached in our S-free experiments ( 240 ppb Au at fO2 NNO+2.6) is