HAL Id: hal-00305644
https://hal.archives-ouvertes.fr/hal-00305644
Submitted on 17 Jan 2007HAL is a multi-disciplinary open access archive for the deposit and dissemination of sci-entific research documents, whether they are pub-lished or not. The documents may come from teaching and research institutions in France or abroad, or from public or private research centers.
L’archive ouverte pluridisciplinaire HAL, est destinée au dépôt et à la diffusion de documents scientifiques de niveau recherche, publiés ou non, émanant des établissements d’enseignement et de recherche français ou étrangers, des laboratoires publics ou privés.
Integrated Nitrogen CAtchment model (INCA) applied
to a tropical catchment in the Atlantic Forest, São
Paulo, Brazil
M. Ranzini, M. C. Forti, P. G. Whitehead, F. C. S. Arcova, V. de Cicco, A. J.
Wade
To cite this version:
M. Ranzini, M. C. Forti, P. G. Whitehead, F. C. S. Arcova, V. de Cicco, et al.. Integrated Nitrogen CAtchment model (INCA) applied to a tropical catchment in the Atlantic Forest, São Paulo, Brazil. Hydrology and Earth System Sciences Discussions, European Geosciences Union, 2007, 11 (1), pp.614-622. �hal-00305644�
© Author(s) 2007. This work is licensed under a Creative Commons License.
Integrated Nitrogen CAtchment model (INCA) applied to a
tropical catchment in the Atlantic Forest, São Paulo, Brazil
M. Ranzini
1,2, M.C. Forti
2,3, P.G. Whitehead
4, F.C.S. Arcova
1, V. de Cicco
1and A.J. Wade
41Instituto Florestal, P.O.Box 1322, 01059-970, São Paulo, Brazil
2Instituto Nacional de Pesquisas Espaciais INPE, P.O.Box 515, 12245-970, S.J.dos Campos, Brazil
3Núcleo de Pesquisa em Geoquímica e Geofísica da Litosfera, University of São Paulo, P.O. Box 9, 13418-900, Piracicaba, Brazil 4Aquatic Environments Research Centre, School of Human and Environmental Sciences, University of Reading, Reading, RG6 6AB, UK
Email for corresponding author: [email protected]
Abstract
Stream-water flows and in-stream nitrate and ammonium concentrations in a small (36.7 ha) Atlantic Forest catchment were simulated using the Integrated Nitrogen in CAtchments (INCA) model version 1.9.4. The catchment, at Cunha, is in the Serra do Mar State Park, SE Brazil and is nearly pristine because the nearest major conurbations, São Paulo and Rio, are some 450 km distant. However, intensive farming may increase nitrogen (N) deposition and there are growing pressures for urbanisation. The mean-monthly discharges and NO3-N concentration
dynamics were simulated adequately for the calibration and validation periods with (simulated) loss rates of 6.55 kg.ha1yr1 for NO 3-N and
3.85 kg.ha1yr1 for NH
4-N. To investigate the effects of elevated levels of N deposition in the future, various scenarios for atmospheric
deposition were simulated; the highest value corresponded to that in a highly polluted area of Atlantic Forest in Sao Paulo City. It was found that doubling the atmospheric deposition generated a 25% increase in the N leaching rate, while at levels approaching the highly polluted São Paulo deposition rate, five times higher than the current rate, leaching increased by 240%, which would create highly eutrophic conditions, detrimental to downstream water quality. The results indicate that the INCA model can be useful for estimating N concentration and fluxes for different atmospheric deposition rates and hydrological conditions.
Keywords: Atlantic Forest, tropics, N-modelling, hydrology, nitrogen dynamics, INCA, atmospheric deposition, Cunha
Introduction
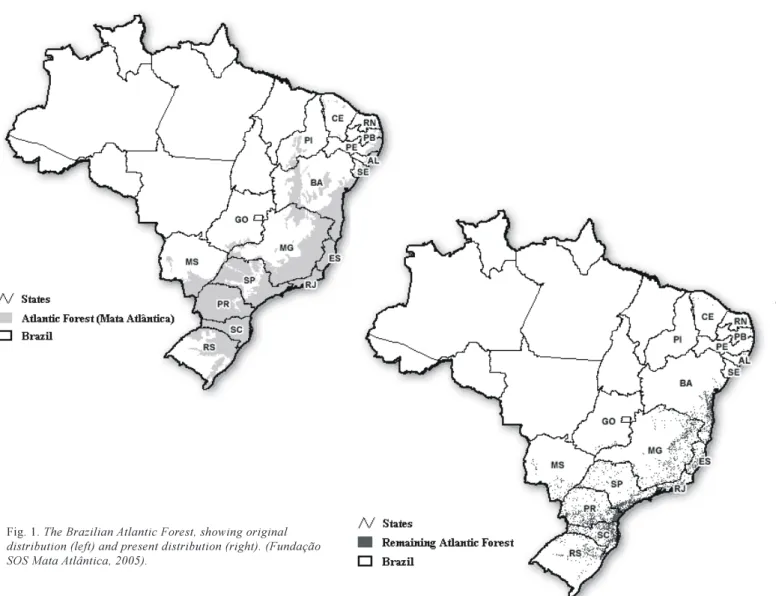
The Atlantic Forest (Mata Atlântica) is a montane rainforest along the Brazilian Atlantic Coast. The forest lies parallel to the eastern coast of Brazil from 25oS (Santa Catarina state)
to 5oS (Rio Grande do Norte state), with an altitude range
from 8001500 m. Formerly the Mata Atlântica occupied 15% of the country, but the biome has suffered from human modifications, beginning in the 16th Century (Fundação SOS Mata Atlântica, 2005). Figure 1a and b shows the original and the present territorial distributions of the Atlantic Forest. The rainforest is characterised by a hot, humid climate with dense and diverse vegetation. Following the colonisation of Brazil, less than 4% of the original total area of the Atlantic Forest now remains because of wood extraction and urbanisation, including the Metropolitan Area of São Paulo (19 million inhabitants) (Emplasa, 2005). In
São Paulo State, the remnant is only 15% of the original area (Fundação SOS Mata Atlântica, 2005).
The desire to conserve and manage the remainder of the Atlantic Forest in a sustainable way requires a better understanding of the hydrogeochemical fluxes, particularly those for nitrogen (N) since it is a key nutrient. Moreover, given the likely continuation of urbanisation and agricultural expansion in the region, the effects of increased inputs of pollutants from atmospheric deposition on the N budget must be quantified. The N cycle is complex and its processes are not well known in tropical areas. Although N is not limiting for vegetation nutrition in this region, it is important to control the trophic level of water bodies (Neal, 2002); managing N inputs to catchments is, therefore, a key requirement. Concentrations of nitrate in rivers reflect the integration of diverse sources within the catchment above
Integrated Nitrogen CAtchment model (INCA) applied to a tropical catchment in the Atlantic Forest, São Paulo, Brazil
Fig. 1. The Brazilian Atlantic Forest, showing original
distribution (left) and present distribution (right). (Fundação SOS Mata Atlântica, 2005).
the background inputs (the mineralisation and nitrification of organic N in the soils). These additional sources include fertiliser inputs, atmospheric deposition and sewage. The fluxes of nitrogen through catchments will be influenced by climatic and seasonal factors (e.g. drought and temperature), and by land use and management practices such as afforestation, clear-felling, liming, ploughing and grazing. The modifications that result from anthropogenic activity can interfere with hydrogeochemical processes and, potentially, threaten water resources.
The complexity of the processes involved requires models to predict how atmospheric deposition, soil use, ecosystem management and climate change all affect N concentrations and loads in rivers. In particular, with representative field measurements, models can help understanding of how nitrogen is cycled and transported and how the key factors and processes that control its dynamics can be determined. Moreover, for environmental management, models are needed to provide quantitative estimates of how a system will respond to changes in pollutant inputs.
A new version of the process-based INCA model (Whitehead et al., 1998a, b; Wade et al., 2002) was chosen for this study because it accounts for the fluxes and storages of nitrogen in both land and stream components of a system, tracking the inputs from the atmosphere and from fertiliser through catchment soils to the river. It also simulates the effects of spatial variations in the land use and hydrology of a river system. The INCA model has been tested in river systems throughout Europe and while it has been found to be applicable across a wide range of spatial and temporal scales (Neal, 2002; Wade et al., 2002), it has yet to be applied in tropical or subtropical regions, so the present study pioneers the application of an established model of river-system N dynamics to a different ecoriver-system. The objectives of this study are (1) to use the model as a learning tool to understand the hydro-geochemical processes controlling the nitrogen dynamics of a small tropical forest catchment and (2) to use the calibrated model to quantify the likely response of the catchment to predicted changes in N deposition, a potential threat to water quality in the Atlantic Forest region.
Material and methods
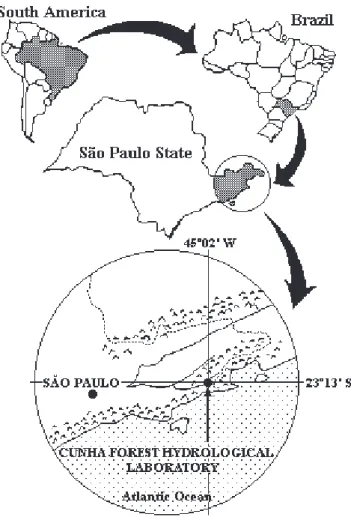
The small (36.7 ha) Cunha catchment, in the Serra do Mar State Park, is some 15 km from the Atlantic Ocean in south-east Brazil, (lat. 23º13´S, long. 45º02´ W), and lies at elevations between 10001200 m.a.s.l. (Fig. 2). The mean annual air temperature is 16.5°C and the mean annual total precipitation is 2205 mm (Cicco, 2004). The bedrock is gneiss and crystalline schist of Precambrian age. Oxysols (FAO-System) comprise the dominant soil coverage, with Gleyic Cambisols close to the creeks (Furian and Pfeifer, 1986).
The INCA model is a process-based model of the nitrogen cycle in plant/soil and in-stream systems. The study catchment was considered as a single reach. The driving data for the INCA model, soil moisture deficit, hydrologically effective rainfall (the fraction of precipitation that contributes directly to the runoff) and air temperature were compiled from April 01 2000 to March 31 2004 and daily potential evapotranspiration was estimated using Camargos method (1971). Meteorological measurements
of air temperature, air humidity, solar radiation and wind speed have been made since January 1998 at a weather station 2 km from the catchment while, since October 1986, daily precipitation has been measured with tipping-bucket rain-gauges installed in three clearings. The hydrologically effective rainfall was calculated as the real precipitation minus the evapotranspiration, taking into account the water retention by the soils (Fujieda et al., 1997; Ranzini, 2002). Since October 1986, discharge from the catchment has been measured with a 90° sharp crested weir with a stilling pond and a continuous record of stage is available. The rating curve for the weir determined by current metering under contrasting flow conditions (Arcova, 1996). Weekly stream water samples were taken from May 2000 to February 2004 at the outlet of the catchment. Bulk and wet-only rainfall water samples were collected during the same period. However, after rainfall collectors had been exposed for 15 days, if insufficient water had accumulated, the collection funnel and bottles were replaced by clean ones to minimise the influence of dry deposition on the sample. A wet-only collector (MTX-Italy) was deployed simultaneously with the bulk collectors and the two sets of measurements were used to estimate the effect of dry deposition on the rainfall chemistry (Forti et al., 2005).
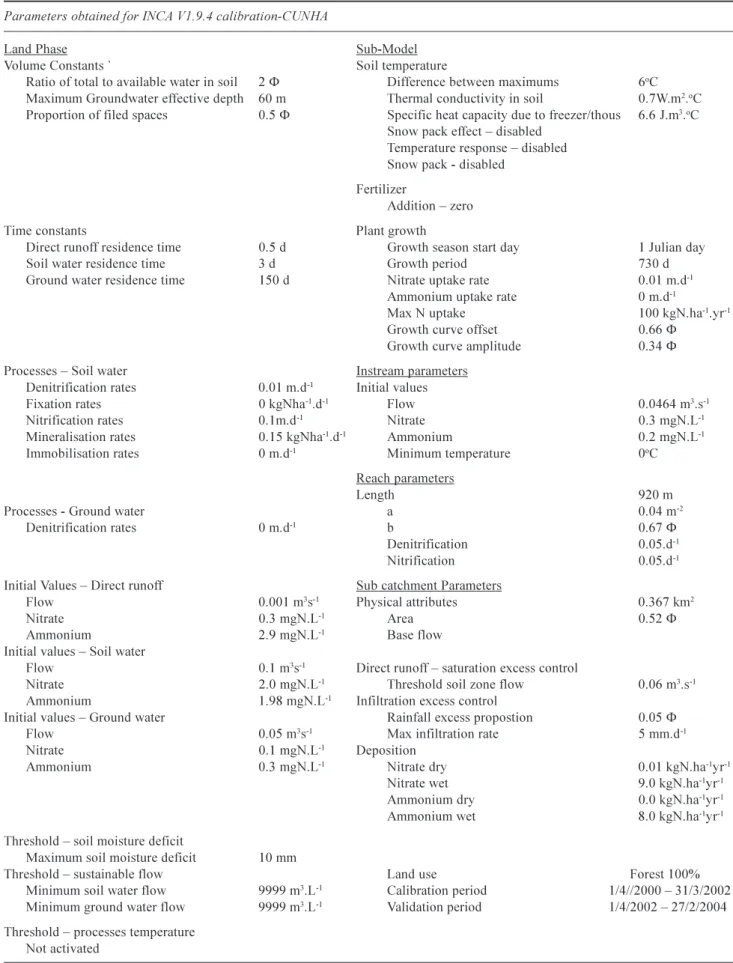
The parameters used in the INCA model are shown in Table 1. Because the forest under study is natural and mature, the parameters related to fertilisation are set to zero in the model. The maximum soil moisture deficit, the initial soil water flow and the drainage volume were determined empirically from another catchment (D) located in the same area (Ranzini et al., 2004). Other parameters associated with soil reactive zone, groundwater zone, initial surface flow and initial sub-surface flow, and the base flow index, were either calculated from analyses of the continuous stage record or measured directly. Parameters relating to the velocity flow relationship in the stream were adjusted during the calibration process.
The initial values of the parameters relating to denitri-fication, nitrogen fixation, nitridenitri-fication, N-mineralisation, immobilisation, and in-stream denitrification and nitrification rates were obtained from an application of INCA to forested catchments in Germany (Langusch and Matzner, 2002). These values were used because there was no comparable information for the present study area. After an initial calibration procedure, the parameters were adjusted to fit the observed nitrogen dynamics as closely as possible. The dry and wet deposition rates for nitrate and ammonium were obtained from observations (Forti et al., 2005).
Integrated Nitrogen CAtchment model (INCA) applied to a tropical catchment in the Atlantic Forest, São Paulo, Brazil
Table 1. Parameters of the INCA model used for the modelling. Parameters obtained for INCA V1.9.4 calibration-CUNHA
Land Phase Sub-Model
Volume Constants ` Soil temperature
Ratio of total to available water in soil 2 F Difference between maximums 6oC
Maximum Groundwater effective depth 60 m Thermal conductivity in soil 0.7W.m2.oC
Proportion of filed spaces 0.5 F Specific heat capacity due to freezer/thous 6.6 J.m3.oC
Snow pack effect disabled Temperature response disabled Snow pack - disabled
Fertilizer
Addition zero Time constants Plant growth
Direct runoff residence time 0.5 d Growth season start day 1 Julian day Soil water residence time 3 d Growth period 730 d Ground water residence time 150 d Nitrate uptake rate 0.01 m.d-1
Ammonium uptake rate 0 m.d-1
Max N uptake 100 kgN.ha-1.yr-1
Growth curve offset 0.66 F Growth curve amplitude 0.34 F Processes Soil water Instream parameters
Denitrification rates 0.01 m.d-1 Initial values
Fixation rates 0 kgNha-1.d-1 Flow 0.0464 m3.s-1
Nitrification rates 0.1m.d-1 Nitrate 0.3 mgN.L-1
Mineralisation rates 0.15 kgNha-1.d-1 Ammonium 0.2 mgN.L-1
Immobilisation rates 0 m.d-1 Minimum temperature 0oC
Reach parameters
Length 920 m
Processes - Ground water a 0.04 m-2
Denitrification rates 0 m.d-1 b 0.67 F
Denitrification 0.05.d-1
Nitrification 0.05.d-1
Initial Values Direct runoff Sub catchment Parameters
Flow 0.001 m3s-1 Physical attributes 0.367 km2
Nitrate 0.3 mgN.L-1 Area 0.52 F
Ammonium 2.9 mgN.L-1 Base flow
Initial values Soil water
Flow 0.1 m3s-1 Direct runoff saturation excess control
Nitrate 2.0 mgN.L-1 Threshold soil zone flow 0.06 m3.s-1
Ammonium 1.98 mgN.L-1 Infiltration excess control
Initial values Ground water Rainfall excess propostion 0.05 F Flow 0.05 m3s-1 Max infiltration rate 5 mm.d-1
Nitrate 0.1 mgN.L-1 Deposition
Ammonium 0.3 mgN.L-1 Nitrate dry 0.01 kgN.ha-1yr-1
Nitrate wet 9.0 kgN.ha-1yr-1
Ammonium dry 0.0 kgN.ha-1yr-1
Ammonium wet 8.0 kgN.ha-1yr-1
Threshold soil moisture deficit
Maximum soil moisture deficit 10 mm
Threshold sustainable flow Land use Forest 100% Minimum soil water flow 9999 m3.L-1 Calibration period 1/4//2000 31/3/2002
Minimum ground water flow 9999 m3.L-1 Validation period 1/4/2002 27/2/2004
Threshold processes temperature Not activated
Model calibration
Four years of discharge and NO3-N concentration
measurements were available and a split sample test used data for April 2000 to March 2002 for calibration and for April 2002 to March 2004 for validation of the model. The model calibration followed three steps following Jarvie et
al. (2002):
1. Hydrology. To simulate the correct dilution of the nitrogen mass in the stream and the timing of the inputs from the land to the stream, it is important to simulate the hydrology accurately. The water residence time constants in the unsaturated and saturated zones were taken from the work of Fujieda et al. (1997).
2. Initial conditions. The second step in the calibration procedure was the adjustment of the NO3-N and
NH4-N initial concentrations in the soil, groundwater
and in-stream components, so that the initial flow NO3-N concentrations matched observed in-stream
concentrations.
3. Processes rates. Parameters relating to soil nitrogen processes (rates of NH4-N immobilisation, NH4-N
nitrification, NO3-N denitrification, NH4-N
mineralisation, and plant NH4-N and NO3-N uptake) as
well as in-stream rates of denitrification and NH4-N
nitrification were adjusted so that the simulated N annual fluxes and leaching and within-catchment processes had
values comparable with those in the literature, and the simulated daily NO3-N concentrations matched those
actually observed.
The calibrated parameters, shown in Table 1, are consistent with those found in other studies with the INCA model.
Results
CALIBRATION
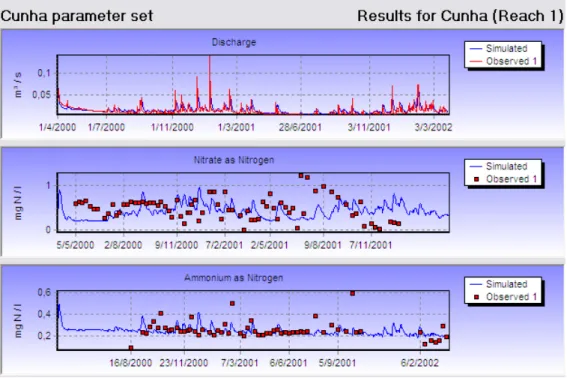
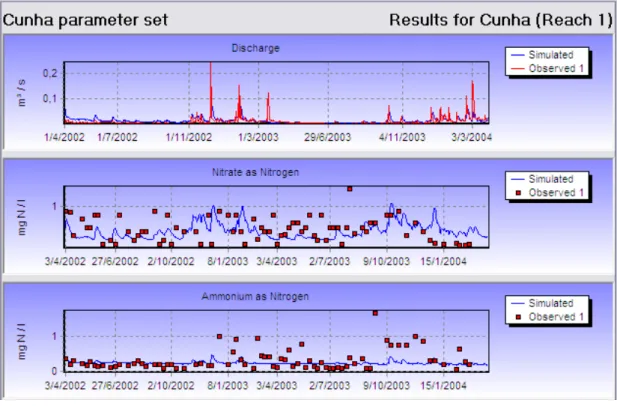
The observed and simulated monthly mean discharges (April 2000 to March 2004) were similar (Fig. 3a, b): the simulated mean value of 82 mm approximated the observed mean of 87 mm, the coefficient of determination of the correlation was r2 = 0.74 and the efficiency (Nash and Sutcliffe, 1970)
was 0.72.
Rainfall in the region is seasonal: a relatively dry period with low temperatures from June to August corresponds to the winter months and high rainfall and higher temperatures between December and March correspond to the summer season. For most of the year, the soil moisture deficit is less than 4 mm; in an adjacent catchment, after a period of 20 days without rain, the soil moisture profile was approximately the field capacity of the soil (Ranzini, 2002). The seasonal soil moisture deficit pattern differed markedly from the pronounced seasonal differences found in forested catchments in temperate regions modelled previously with
Fig. 3a. Observed and simulated mean monthly flow (m3.s-1), and nitrate and ammonium stream water concentrations (mg.L-1) for the
Integrated Nitrogen CAtchment model (INCA) applied to a tropical catchment in the Atlantic Forest, São Paulo, Brazil
INCA (Langush and Matzner, 2002; Bastrup-Birk and Gundersen, 2004). The pattern in temperate regions results from the combination of high temperatures and low rainfall during the summer (Whitehead et al., 1998b, 2002).
The dynamics of the in-stream concentrations of NO3-N
and NH4-N were well explained by the model (Fig. 3a,b).
Mean concentrations of NO3-N and NH4-N, 0.43 mg L1 and
0.23 mg L1 respectively were consistent with modelled
mean values of 0.50 mg L1 and 0.24 mg L1 respectively.
Leaching of NH4-N, overestimated with the present
parametersation (Table 2), may be attributed to a sampling bias as most values were determined during periods of base-flow. Nevertheless, the NH4-N and NO3-N concentrations
are normal for a forested catchment (Langusch and Matzner, 2002) and are consistent with values of 0.14 mg L1 and
0.66 mg l1 for NH
4-N and NO3-N, respectively, found in
the Amazon basin by Forti et al. (2000).
The NO3-N and NH4-N modelled leaching rates of
6.5 kg N ha1yr1 and 3.85 kg ha1yr11 respectively, are 20%
and 40% higher than those observed (Table 2). These differences may be due to the sampling procedure as well as to a lack of good data for the nitrogen processes (Fig. 3a, b). Mineralisation and nitrification rates obtained from the modelling, 10.5 kg ha1yr1 and 15.8 kg ha1yr1, are lower
than those observed for a soil chronosequence (assuming a mean density of 1.3 g cm3 and 1.8 m depth) for the Amazon
(Neill et al., 1997) where values of mineralisation were from 17.9 kg ha1yr1 to 53.3 kg ha1yr1 and of nitrification from
20.2 and 55.1 kg ha1yr1.
MODEL VALIDATION
To validate the model, the parameters determined in the INCA calibration for the period from April 2000 to March 2002 were used to simulate results for the period from April 2002 to March 2004. In this way, the modelled hydrology and NO3-N and NH4-N fluxes and concentrations could be
tested using a different data set by comparing the simulated and observed values of the daily discharge and daily NO3-N and NH4-N concentrations for the validation period.
There was a good match between the simulated and observed discharge, as well as of nitrate and ammonium dynamics (Fig. 3a,b). As in the calibration mode, in the rainy period when peak discharges occur, NO3-N and NH4-N
concentrations also peak, thus reproducing the observed seasonality.
ENVIRONMENTAL CHANGES SIMULATION WITH DIFFERENT ATMOSPHERIC DEPOSITION
SCENARIOS
Although the catchment under study lies within a
Fig. 3b. Observed and simulated mean monthly flow (m3.s-1), and nitrate and ammonium stream water concentrations (mg.L-1) for the validation
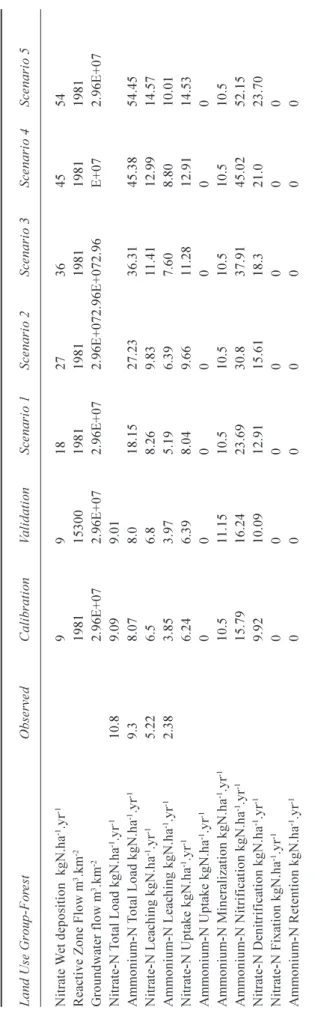
Table 2. Annual load data for the dif ferent parameters for the observed data and the INCA simulations. Land Use Gr oup-For es t Observed Calibration Validation Scenario 1 Scenario 2 Scenario 3 Scenario 4 Scenario 5 Nitrate W et deposition kgN.ha -1.yr -1 9 9 18 27 36 45 54 Reactive Zone Flow m 3.km -2 1981 15300 1981 1981 1981 1981 1981 Groundwater flow m 3.km -2 2.96E+07 2.96E+07 2.96E+07 2.96E+072.96E+072.96 E+07 2.96E+07 Nitrate-N T otal Load kgN.ha -1.yr -1 10.8 9.09 9.01 Ammonium-N
Total Load kgN.ha
-1.yr -1 9.3 8.07 8.0 18.15 27.23 36.31 45.38 54.45 Nitrate-N Leaching kgN.ha -1.yr -1 5.22 6.5 6.8 8.26 9.83 11.41 12.99 14.57 Ammonium-N Leaching kgN.ha -1.yr -1 2.38 3.85 3.97 5.19 6.39 7.60 8.80 10.01 Nitrate-N Uptake kgN.ha -1.yr -1 6.24 6.39 8.04 9.66 11.28 12.91 14.53 Ammonium-N Uptake kgN.ha -1.yr -1 00 0 0 0 0 0 Ammonium-N Mineralization kgN.ha -1.yr -1 10.5 11.15 10.5 10.5 10.5 10.5 10.5 Ammonium-N Nitrification kgN.ha -1.yr -1 15.79 16.24 23.69 30.8 37.91 45.02 52.15 Nitrate-N Denitrification kgN.ha -1.yr -1 9.92 10.09 12.91 15.61 18.3 21.0 23.70 Nitrate-N Fixation kgN.ha -1.yr -1 00 0 0 0 0 0 Ammonium-N Retention kgN.ha -1.yr -1 00 0 0 0 0 0
conservation unit (State Park of Serra do Mar), it is potentially vulnerable to changes in N emissions from the surrounding regions, particularly from intensive cattle ranching and increasing industrial development in the Paraíba do Sul river valley, with a corresponding increase in human population. To simulate these changes, a range of scenarios was chosen: 100 to 500% increase in total N deposition above present baseline levels for Cunha. The highest values correspond to the deposition in a highly impacted part of the Atlantic Forest: the Fontes do Ipiranga State Park PEFI, a forested area of 526.4 ha surrounded by the metropolitan region of São Paulo with a mean N deposition rate of 50.8 kg ha1yr1 (Forti et al., 2005), around
six times the NO3-N wet deposition value used for calibration.
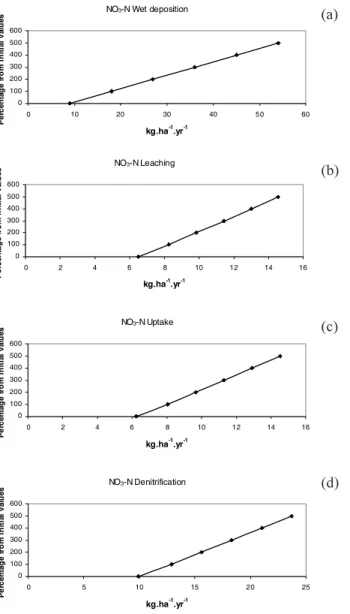
Table 2 and Fig. 4(a g) present the results of each output flux in percentage terms. The model indicates that the increased N deposition increases the leaching of nitrate and ammonium from the catchment. The modelled results fit well with actual measurements for the PEFI catchment (Bicudo et al., 2002), which endorses the value and appropriateness of the modelling. Nevertheless, the increased leaching does not account for all of the N deposition and so the catchment compensates for the increasing deposition in other ways. For example, the denitrification rates increase significantly, as might well be expected given the wet soils, warm temperatures and the sudden availability of excess N. Further, the nitrification processes also increase and so the excess ammonia is converted into nitrate. The analysis shows that nitrogen storage increases significantly (Table 3). This increase means that a larger pool of nitrogen is available in the catchment, increasing N concentration in the groundwater and this is available for future leaching.
Discussion and conclusions
This paper provides the first application of INCA to the South Americas and to the ecologically important area of the Atlantic Forest and it is hoped that the study will encourage new modelling initiatives in the region. The study raises important issues to be addressed; these include:
l The major need for high quality data in South American
catchments to bring the level of understanding up to that known elsewhere (Neal and Heathwaite, 2005) and to take the science even further. Detailed information is generally sporadic and incomplete for the Americas. Process rates for nitrogen transformation are needed for model parameterisation to avoid using data from other parts of the world and calibration procedures rather than real measurements.
Integrated Nitrogen CAtchment model (INCA) applied to a tropical catchment in the Atlantic Forest, São Paulo, Brazil NO3-N Wet deposition 0 100 200 300 400 500 600 0 10 20 30 40 50 60 kg.ha-1 .yr-1 P e rc en ta ge f ro m ini tia l va lu es NO3-N Leaching 0 100 200 300 400 500 600 0 2 4 6 8 10 12 14 16 kg.ha-1 .yr-1 P e rc en ta ge f rom in it ia l va lu es NO3-N Uptake 0 100 200 300 400 500 600 0 2 4 6 8 10 12 14 16 kg.ha-1 .yr-1 P e rc en ta ge f rom ini tia l v al u es NO3-N Denitrification 0 100 200 300 400 500 600 0 5 10 15 20 25 kg.ha-1 .yr-1 P e rc en ta ge f rom ini tia l v al u es NH4-N Total load 0 100 200 300 400 500 600 0 10 20 30 40 50 60 kg.ha-1.yr-1 P e rc en ta ge f rom in it ia l v al u es NH4-N Leaching 0 100 200 300 400 500 600 0 2 4 6 8 10 12 kg.ha-1 .yr-1 P e rc en ta ge f rom in it ia l va lu es NH4-N Leaching 0 100 200 300 400 500 600 0 2 4 6 8 10 12 kg.ha-1.yr-1 P e rc en ta ge f rom ini tia l v al u es
Fig. 4. Simulated parameter values variation for the different NO3-N
Wet deposition (a), NO3-N Leaching (b), NO3-N Uptake (c), NO3-N
denitrification (d), NH4-N Total Load (e), NH4-N Leaching (f), NH4
-N -Nitrification (g) in kg.ha-1.y (a) (b) (c) (d) (e) (f) (g)
Table 3. Simulated, observed and N fluxes for increasing N deposition (kg N.ha-1.yr-1).
Parameter 0% 100% 200% 300% 400% 500% NO3-N deposition simulated 9.09 18.0 27 36.0 45.0 54.0 NH4-N deposition simulated 8.07 18.15 27.2 36.3 45.38 54.45 NO3-N leaching simulated 6.5 8.26 9.83 11.41 12.99 14.57 observed 5.22 - - - - -NH4-N leaching simulated 3.85 5.19 6.39 7.60 8.80 10.01 observed 2.38 - - - -
-NH4-N nitrification simulated 15.79 (pool) 23.69 30.8 37.91 45.02 52.15
NO3-N denitrification simulated 9.92 12.91 15.61 18.3 21.0 27.70
D Store simulated 3.11 9.79 22.4 35.3 47.6 56.2
l Intensive catchment studies such as those in temperate
regions of the world, in the UK at Plynlimon (Neal, 1997, 2002) and in the USA at Hubbard Brook (Likens and Bormann, 1995), need to be established and maintained in tropical environments to provide baseline
data for environmental change studies.
l The McIntyre et al. (2005) sensitivity analysis using
INCA-N showed the importance of investigating semi-distributed model uncertainties prior to model application. This work should be repeated for tropical
applications of INCA where process rates and interactions may differ from those in temperate regions. Application of INCA facilitates analysis of the patterns of NO3-N concentrations in discharge over the year and
under varying hydrological conditions. It is a valuable tool for estimating NO3-N concentrations and fluxes under
diverse deposition backgrounds and hydrological regimes, as well as for water resources management. However, its usefulness needs to be tested in broader tropical regions with different soil uses and over a longer period of observations.
Acknowledgements
One author (Ranzini) thanks CNPq for a post-doctoral grant - Nº150.350/03-1. The dataset were from FAPESP project Nº99/05204-4. The authors thank J.B.A. dos Santos (Forestry Institute of São Paulo State) for his long-lasting help in field sampling and FAPESP Process No. 99/5204-4 for financial support on the hydrogeochemistry.
References
Arcova, F.C.S., 1996. Balanço hídrico, características do deflúvio
e calibragem de duas microbacias hidrográficas na Serra do Mar, SP [in Portuguese, with English abstract]. Msc Dissertation.
Universidade de São Paulo. 155pp.
Bastrup-Birk, A. and Gundersen, P., 2004. Water quality improvements from afforestation in an agricultural catchment in Denmark illustrated with the INCA model. Hydrol. Earth
Syst. Sci., 8, 764777.
Bicudo, D.C., Forti, M.C., Carmo, C.F., Bourotte, C., Bicudo, C.E.M., Melfi, A. J. and Lucas, Y., 2002. A atmosfera, as águas superficiais e os reservatórios do PEFI. In: Parque Estadual
das Fontes do Ipiranga (PEFI): uma unidade de conservação ameaçada pela urbanização de São Paulo, D.C. Bicudo, M.C.
Forti and C.E.M. Bicudo (Eds). [in Portuguese] Ed. da Secretaria do Meio Ambiente do Estado de São Paulo, Cap 10:161200. Camargo, A.P., 1971. Balanço hídrico no Estado de São Paulo [in
Portuguese]. Bol. Tecn. IAC, 116. 24pp.
Cicco, V., 2004. Análise de séries temporais hidrológicas em
microbacia com cobertura vegetal natural de mata atlântica, Cunha SP. [in Portuguese, with English abstract]. MSc
Dissertation. Universidade de São Paulo. 124pp.
Emplasa (Empresa Paulista de Planejamento Metropolitano), 2005.
População Metropolitana Estimada em Tempo Real [in
Portuguese]. http://www.emplasa.sp.gov.br.
Forti, M.C., Boulet, R., Melfi, A.J. and Neal, C., 2000. Hydrogeochemistry of a small catchment in north eastern Amazonia: a comparison between natural with deforested parts of the catchment (Serra do Navio, Amapá State, Brazil). Water
Air Soil Pollut., 118, 263279.
Forti, M.C., Bicudo, D.C., Bourotte, C., Cicco, V. and Arcova, F.C.S., 2005. Rainfall and throughfall chemistry in the Atlantic Forest: a comparison between urban and natural areas (São Paulo State, Brazil). Hydrol. Earth Syst. Sci., 9, 570585.
Fujieda, F., Kudoh, T., Cicco, V. and Carvalho, J.L., 1997. Hydrological processes at two subtropical forest catchments: the Serra do Mar, São Paulo, Brazil. J. Hydrol., 196, 2646.
Fundação SOS Mata Atlântica, 2005. Atlas dos remanescentes
florestais da Mata Atlântica: período de 1995-2000. Relatório
Final. http://201.6.118.168/sos/download/relatorio_atlas-1995a2000.pdf. 143
Furian, S.M. and Pfeifer, R.M., 1986. Levantamento de reconhecimento do meio físico do Núcleo Cunha, SP [in Portuguese]. Bol. Tecn. IF, 40, 183193.
Jarvie, H.P., Wade, A.J., Butterfield, D., Whitehead, P.G., Tindall, C.I., Virtue, W.A., Dryburgh, W. and McGraw, A., 2002. Modelling nitrogen dynamics and distributions in the River Tweed, Scotland: an application of the INCA model. Hydrol.
Earth Syst. Sci., 6, 433453.
Langusch, J-J. and Matzner, E. N., 2002. Fluxes in two nitrogen saturated forested catchments in Germany: Dynamics and modelling with INCA. Hydrol. Earth Syst. Sci., 6, 383394. Likens, G.E. and Borman, F.H., 1995. Biogeochemistry of a
Forested Ecosystem. Springer, New York, 2nd Edn. 159pp.
McIntyre, N., Jackson, B., Wade, A.J., Butterfield, D. and Wheater, H.S., 2005. Sensitivity analysis of a catchment-scale nitrogen model. J. Hydrol., 315, 7192.
Nash, J.E. and Sutcliffe, J.V., 1970. River flow forecasting through conceptual models, 1. A discussion of principles. J. Hydrol.,
10, 282290.
Neal, C., 1997. A view of water quality from the Plynlimon watershed. Hydrol. Earth Syst. Sci., 1, 743753.
Neal, C., 2002. Nutrient concentrations and fluxes for podzolic and gley soils at Plynlimon, mid-Wales: implications for modelling inorganic nitrogen and phosphorus in upland UK environments. Hydrol. Earth Syst. Sci., 6, 403420.
Neill, C., Piccolo, M.C., Cerri, C.C., Stender, P.A., Melillo, J.M. and Britto, M., 1997. Net nitrogen mineralization and net nitrification rates in soils following deforestation for pasture across south western Brazilian Amazon landscape. Oecologia,
110, 243252.
Ranzini, M., 2002. Modelagem hidrológica de uma microbacia
florestada da serra do mar, SP, com o modelo TOPMODEL simulação do comportamento hidrológico em função do corte raso [in Portuguese, with English abstract]. Doctoral Thesis.
Universidade de São Paulo. 116pp.
Ranzini, M., Righetto, A.M., Lima, W.P., Guandique, M.E.G., Arcova, F.C.S. and Cicco, V., 2004. Processos hidrológicos de uma microbacia com Mata Atlântica, na região da Serra do Mar, SP [in Portuguese, with English abstract]. Sci. forestalis, 66, 108119.
Wade, A.J., Durand, P., Beaujouan, V., Wessel, W.W., Raat, K.J., Whitehead, P.G., Butterfield, D., Rankinen, K. and Lepisto, A., 2002. A nitrogen model for European catchments: INCA, new model structure and equations. Hydrol. Earth Syst. Sci., 6, 559 582.
Whitehead, P.G., Wilson, E.J. and Butterfield, D., 1998a. A semi-distributed integrated nitrogen model for multiple source assessment in catchments (INCA): part I model structure and process equations. Sci. Total Envir., 210/211, 547558. Whitehead, P.G., Wilson, E.J., Butterfield, D. and Seed, K., 1998b.
A semi-distributed integrated flow and nitrogen model for multiple source assessment in catchments (INCA): part II application to large river basins in south Wales and eastern England. Sci. Total Envir., 210/211, 559583.
Whitehead, P.G., Lapworth, D.J., Skeffington, R.A. and Wade, A., 2002. Excess nitrogen leaching and C/N decline in the Tillingbourne catchment, southern England: INCA process modelling for current and historic time series. Hydrol. Earth