HAL Id: hal-00004620
https://hal.archives-ouvertes.fr/hal-00004620
Submitted on 1 Apr 2005
HAL is a multi-disciplinary open access
archive for the deposit and dissemination of
sci-entific research documents, whether they are
pub-lished or not. The documents may come from
teaching and research institutions in France or
abroad, or from public or private research centers.
L’archive ouverte pluridisciplinaire HAL, est
destinée au dépôt et à la diffusion de documents
scientifiques de niveau recherche, publiés ou non,
émanant des établissements d’enseignement et de
recherche français ou étrangers, des laboratoires
publics ou privés.
Sub-arcsec imaging of the AB Aur molecular disk and
envelope at millimeter wavelengths: a non Keplerian
disk
Vincent Piétu, S. Guilloteau, Anne Dutrey
To cite this version:
Vincent Piétu, S. Guilloteau, Anne Dutrey. Sub-arcsec imaging of the AB Aur molecular disk and
envelope at millimeter wavelengths: a non Keplerian disk. Astronomy and Astrophysics - A&A, EDP
Sciences, 2005, 443, pp.945-954. �10.1051/0004-6361:20042050�. �hal-00004620�
ccsd-00004620, version 1 - 1 Apr 2005
Astronomy & Astrophysicsmanuscript no. 2050.hyper7663 April 1, 2005 (DOI: will be inserted by hand later)
Sub-arcsec imaging of the AB Aur molecular disk and envelope at
millimeter wavelengths: a non Keplerian disk.
⋆
Vincent Pi´etu,
1, St´ephane Guilloteau
2, and Anne Dutrey
2 1 LAOG, Observatoire de Grenoble, BP 53, F-38041 Grenoble Cedex 9, France2 L3AB, Observatoire de Bordeaux, 2 rue de l’Observatoire, BP 89, F-33270 Floirac, France
Received 23 September 2004 / Accepted 31 March 2005
Abstract. We present sub-arcsecond images of AB Auriga obtained with the IRAM Plateau de Bure interferometer in the isotopologues of CO, and in continuum at 3 and 1.3 mm. These observations allow us to trace the structure of the circumstellar material of AB Aur in regions where optical and IR imaging is impossible because of the emission from the star. These images reveal that the environment of AB Aur is widely different from the proto-planetary disks that surround T Tauri stars like DM Tau and LkCa15 or HAeBe stars like MWC 480, in several aspects. Instead of being centrally peaked, the continuum emission is dominated by a bright, asymmetric (spiral-like) feature at about 140 AU from the central star. Little emission is associated with the star itself. The molecular emission shows that AB Aur is surrounded by a very extended flattened structure (“disk”), which is rotating around the star. Bright molecular emission is also found towards the continuum “spiral”. The large scale molecular structure suggests the AB Aur disk is inclined between 23 and 43 degrees, but the strong asymmetry of the continuum and molecular emission prevents an accurate determination of the inclination of the inner parts. Analysis of the emission in terms of a Keplerian disk provides a reasonable fit to the data, but fails to give a consistent picture because the inclinations determined from12
CO J=2→1,13
CO J=2→1,13
CO J=1→0 and C18
O J=1→0 do not agree. The mass predicted for the central star in such Keplerian models is in the range 0.9 to 1.2 M⊙, much smaller than the expected 2.2 M⊙from the spectral type of AB Aur. Better and more consistent fits to the13
CO J=2→1,13
CO J=1→0 data are obtained by relaxing the Keplerian hypothesis. We find significant non-Keplerian motion, with a best fit exponent for the rotation velocity law of 0.41 ± 0.01, but no evidence for radial motions. The disk has an inner hole about 70 AU in radius. The disk is warm and shows no evidence of depletion of CO. The dust properties suggest the dust is less evolved than in typical T Tauri disks. Both the spiral-like feature and the departure from purely Keplerian motions indicates the AB Aur disk is not in quasi-equilibrium. Disk self-gravity is insufficient to create the perturbation. This behavior may be related either to an early phase of star formation in which the Keplerian regime is not yet fully established and/or to a disturbance of yet unknown origin. An alternate, but unproven, possibility is that of a low mass companion located about 40 AU from AB Aur.
Key words. Stars: circumstellar matter – planetary systems: protoplanetary disks – individual: AB Aur – Radio-lines: stars
1. Introduction
The existence of disks around Herbig Ae/Be stars is now widely accepted but the physical properties of these disks are poorly known. Contrary to TTauri disks, there are only a few examples of large Keplerian disks around Herbig Ae stars: the A4 star MWC480 (Mannings et al. 1997; Simon et al. 2000), and the A0 star HD 34282 (Pi´etu et al. 2003).
AB Auriga is one of the nearest, brightest and best studied Herbig Ae stars. It has a spectral type A0-A1 (Hern´andez et al. 2004) and is located at a distance D = 144±2317 pc following
Send offprint requests to: S.Guilloteau, e-mail: guilloteau@obs.u-bordeaux1.fr
⋆ Based on observations carried out with the IRAM Plateau de Bure
Interferometer. IRAM is supported by INSU/CNRS (France), MPG (Germany) and IGN (Spain).
Hipparcos measurements (van den Ancker et al. 1998). NIR imaging with the HST-STIS (Grady et al. 1999) reveal a large envelope surrounding the star and scattering the stellar light. This flattened reflection nebulae is seen close to pole-on, up to
r ∼ 1300 AU from the star. New NIR observations, performed
with the Subaru telescope using the Coronographic Imager and Adaptive Optics systems (Fukagawa et al. 2004), show that the circumstellar matter presents a spiral structure. AB Auriga has been also observed in MID-IR spectroscopy with ISO (Meeus et al. 2001; Bouwman et al. 2000). These data constrain the dust content several tens of AUs from the star. The modelling of the SED in this frequency range also shows that the star be-longs to the Group I (Meeus et al. 2001). In the classification of Herbig Ae circumstellar matter, stars of Group I are surrounded by a flaring disk responsible for the bump in the MID-IR. The disk was imaged at 11 and 18µm by Chen & Jura (2003), us-ing the Keck I telescope. They found the disk is resolved at 18.7µm with an approximate diameter of ∼ 1.2′′ or 170 AU.
the first quantitative studies of the very inner disks. Monnier & Millan-Gabet (2002) have shown that in such objects, the very inner dust disk is truncated by sublimation of the dust at temperature around ∼ 1500 K. For AB Auriga which is a star of Teff≃ 10 000K, this happens at rin∼ 0.2 − 0.3 AU. Finally, the surrounding material was also observed at millimeter wave-lengths by Mannings & Sargent (1997) with OVRO, but the de-rived inclination (≃ 75◦) is much larger than that found from
all other (optical or IR) tracers (≃ 20 − 30◦).
Following our successful study of DM Tau in CO isotopo-logues (Dartois et al. 2003), we decided to perform a similar study of the AB Auriga environment. Therefore, we observed AB Auriga with the IRAM interferometer in 12CO J=2→1, 13
CO J=1→0 and J=2→1, and C18O J=1→0. We report here the results of this multi-line, CO isotope analysis. Our goals are double: we want to 1) characterize the physical structure of the circumstellar matter (vertical temperature gradient, density, kinematics) and 2) compare quantitatively the large scale mm properties with those of TTauri disks. The observations and the results are described in Sections 2 & 3, respectively. Section 4 presents the best model and we discuss in Section 5, the physi-cal implications.
2. Observations and Results
2.1. PdBI data
The12CO observations used 5 antennas and were carried out in winter 2001/2002 in D and C2 configurations. Baselines up to 170 m provided 2.00 × 1.60′′ resolution at PA 92◦ for the
1.3 mm continuum data. We observed simultaneously at 89.2 GHz (HCO+
J=1→0, which will be discussed in a forthcom-ing paper) and 230.5 GHz (12CO J=2→1). At 1.3 mm, the tun-ing was double-side-band (DSB) while at 3.4 mm, the tuntun-ing was purely single-side band (LSB). The backend was a cor-relator with one band of 10 MHz (spectral resolution 0.23 km.s−1) centered on the HCO+ J=1→0 line, one band of 20 MHz (0.18 km.s−1 resolution) centered on the12CO J=2→1 line, and 2 bands of 160 MHz for the 1.3 mm and 3.4 mm continuum, respectively. The phase and flux calibrators were 0415+379 and 0528+134. The rms phase noise was 8◦to 25◦
and 15◦to 50◦at 3.4 mm and 1.3 mm, respectively, which
intro-duced position errors of ≤ 0.1′′, and a seeing better than 0.3′′.
The observation time was shared with other sources: MWC480 and LkCa15 or CQ Tau and MWC758, AB Aur using only a small fraction of the transit time. The total on source inte-gration time is ∼ 10 hours. As a consequence, the amplitude and phase calibration of these sources is homogenous and the flux density of all sources were estimated simultaneously. This allows us to make accurate comparisons of the spectral in-dex of the continuum emission. In all cases, the flux density scale was referred to MWC349, for which we used a flux of
S (ν) = 0.95Jy(ν/100 GHz)0.6.
The C18
O J=1→0,13
CO J=1→0 and J=2→1 observations were performed between 2001 and 2004. Configurations D, C2, B1 (5 antennas) and A (6 antennas) were used, and pro-vided baselines up to 400 m. This provides angular resolu-tion of 0.80 × 0.55′′ at PA 39◦ at 220 GHz, with a residual
seeing < 0.2′′ and position errors ≤ 0.05′′ after calibration. The correlator provided a spectral resolution of 0.09 km.s−1 for 13CO J=2→1 and 0.18 km.s−1 for the 13CO J=1→0 and C18O J=1→0 lines. The same phase and flux calibrators were used. The total integration time is around 30 hours, half of which was spent on the long baseline (A configuration) obser-vations.
We used the GILDAS software package to reduce the data. Images are presented at different angular resolutions, obtained by applying a taper and re-weighting the data when needed. However, the natural weights were used in the disk modelling.
2.2. 30-m data
In 2000, we also obtained a single-dish spectrum of 13
CO J=2→1 at the 30-m telescope, which when compared to the PdB measurements indicates at most 20 % of the flux was missed by the interferometer. Accordingly, it is unlikely that the 13CO measurements are significantly affected by missing flux, specially within the inner 10 to 20′′. However, the12
CO J=2→1 line is much brighter and most likely hampered by structures within a more extended region.
3. Results
Figure 1 is a montage displaying high resolutions images of the continuum emission at 2.8 mm and 1.4 mm, and of the integrated line emission of 12
CO J=2→1 13
CO J=2→1 and 13
CO J=1→0 transitions. The 1.4 mm emission was obtained by merging the 220 and 230 GHz data in together to improve signal to noise; the flux was scaled to a reference frequency of 220 GHz assuming a spectral index of 3.0 for the emission. The (lower resolution) emission at 110 GHz is also presented. The total continuum flux at 1.4 mm is 85 ± 5 mJy, and at 2.8 mm, 11 ± 2 mJy.
Figure 2 presents the channels maps of the12
CO J=2→1, 13
CO J=2→1 and13
CO J=1→0 transitions. The13
CO J=2→1 data has been smoothed to about 1′′resolution to help the
com-parison with the J=1→0 transition.
In Figure 3, the continuum emission is super-imposed on the STIS image from Grady et al. (1999). No position ad-justment has been made in doing so: the absolute astromet-ric accuracy of the PdB measurement is better than ≃ 0.05′′.
The best fit position of the centroid of the13CO emission is
α = 04:55:45.843, δ = 30:33:04.21 only 0.03′′from the
extrap-olated Hipparcos position. The HST STIS image (which was centered on the Hipparcos coordinates for 1999) was shifted southward by 0.08′′ to correct for the proper motion of AB Aur (taken from the Hipparcos catalog) between the epochs of the two observations (1999 and 2003). The emission is clearly concentrated in an arc-like structure about 1′′from the central
star. The flux density measured at 1.4 mm in the direction of the central star is ≃ 5 ± 1 mJy, but this should be considered as an upper limit because of contamination from the arc-like structure due to the limited angular resolution.
In Figure 1, the line emission was integrated between 3.8 and 8.2 km.s−1. This interval contains most of the line pro-file, but weak emission in the line wings is still detectable 2
Pi´etu, Guilloteau & Dutrey: Sub-arcsecond images of AB Auriga 3
Fig. 1. Line emission (integrated over the [3.8,8.2] km.s−1velocity range, and continuum emission towards AB Aur. The synthe-sized beam is indicated in each panel. The cross indicates the direction of the major and minor axis of the AB Aur disk, as derived from the analysis of the line data, but using an inclination of 30◦for the aspect ratio of the cross. Top row, left: Integrated intensity of the12
CO J=2→1 line. The angular resolution is 2.0 × 1.6′′at PA 92◦and the contour spacing is 0.85 Jy/beam km.s−1or 12 σ.
Middle: Integrated intensity of the13
CO J=2→1 line. The angular resolution is 0.72 × 0.63′′at PA 29◦and the contour spacing
is 85 mJy/beam km.s−1or 2.2 σ. Right: Integrated intensity of the13
CO J=1→0 line. The angular resolution is 1.37 × 1.05′′at
PA 25◦and the contour spacing is 34 mJy/beam km.s−1or 2.3 σ. Bottom row, left: continuum emission at 2.8 mm. The angular
resolution is 1.37 × 1.07′′ at PA 27◦and the contour spacing is 0.4 mJy/beam, 28 mK, or 2.0 σ. Middle: continuum emission
at 1.4 mm. The angular resolution is 0.85 × 0.59′′at PA 18◦ and the contour spacing is 1 mJy/beam, 51 mK, or 2.7 σ. Right:
Integrated intensity of the C18
O J=1→0 line. The angular resolution is 1.37 × 1.05′′ at PA 25◦ and the contour spacing is 25
mJy/beam km.s−1or 2.1 σ. Coordinates are J2000.0 Right Ascension and Declination.
km.s−1away (specially in12CO). The integrated line emission maps reveal a clear inner hole in the distribution of the emis-sion from the CO isotopes, as well as enhanced emisemis-sion at the location of the continuum ring. Note in particular that, while the 2.8 mm continuum hardly shows the central depression, the 13CO and C18
O J=1→0 line emissions obtained at the same angular resolution clearly show the ring.
3.1. Analysis Method
To better quantify the properties of the AB Aur circumstellar material, we used an approach similar to that applied to DM Tau by Dartois et al. (2003). The analysis is based on a new radiative transfer code, with non-LTE capabilities, which will be presented in a forthcoming paper (Pi´etu et al. 2005). Apart from discretization details, the LTE part (which was used ex-clusively here) is however equivalent to the code described in Dutrey et al. (1994). As in Guilloteau & Dutrey (1998), the
comparison between models and data and the minimization is done inside the UV plane, using natural weighting. The physi-cal model is that of a rotating, flared disk in hydrostatic equilib-rium, with power law distributions for the density, temperature, rotation velocity and scale height as function of radius. Since the AB Aur disk is relatively extended, we have applied pri-mary beam attenuation to the model images before computing the model visibilities. We have also improved the minimization technique by searching the minimum of the χ2with the help of a Levenberg-Marquard method, instead of a simple grid search previously. The two methods were intensively compared, the new one improving the convergence speed by a factor ∼ 20−30 on typical data, and providing more accurate estimate of the error bars since it takes into account the correlation between parameters. Table 1 summarizes the parameters found for the best models for the various lines and the continuum.
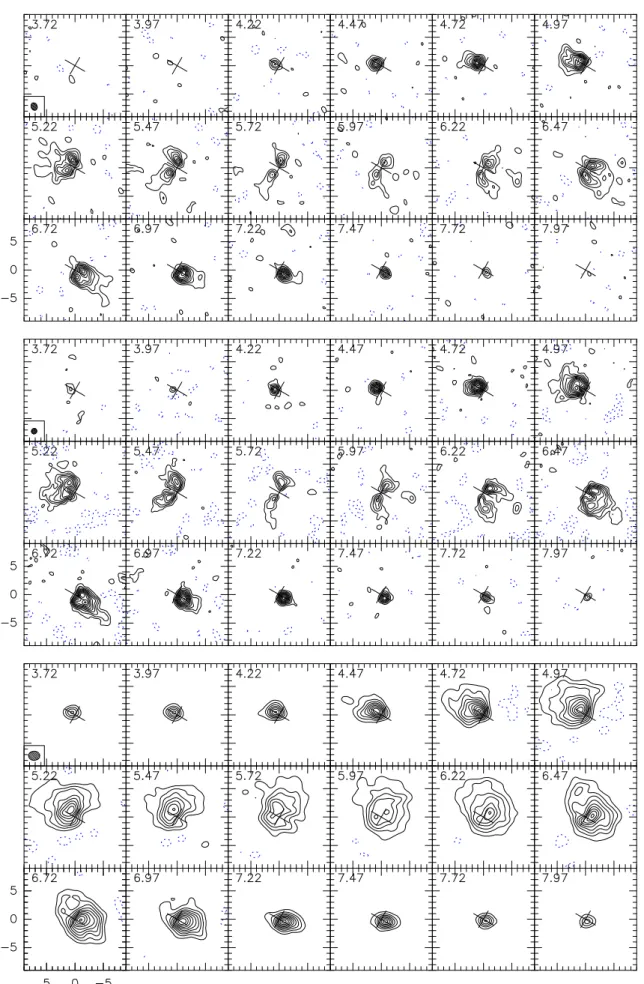
Fig. 2. Channel maps of the CO isotopologues in AB Aur. The LSR velocity, in km.s−1, is indicated in the upper left corner of
each panel. Coordinates are in arsec from the star position. All data have been smoothed to the same spectral resolution, 0.25 km.s−1. Top:13
CO J=1→0 line, spatial resolution 1.37 × 1.05′′ at PA 28◦, contour spacing 30 mJy/beam, or 2.1 K, or 2.2 σ.
Middle:13
CO J=2→1 line, spatial resolution 1.00 × 0.95′′at PA 168◦, contour spacing 0.1 Jy/beam, or 2.6 K, or 2.6 σ. Bottom:
12
CO J=2→1 line, spatial resolution 2.0 × 1.6′′at PA 92◦, contour spacing 0.5 Jy/beam, or 3.6 K, or 7 σ. Negative contours are dashed, and the zero contour is omitted.
Pi´etu, Guilloteau & Dutrey: Sub-arcsecond images of AB Auriga 5
Fig. 3. 1.4 mm continuum data (in contours) superimposed on the HST image from Grady et al. (1999), in grey scale. The an-gular resolution is 0.85 × 0.59′′at PA 18◦. The contour spacing
is 0.9 mJy/beam, corresponding to 45 mK, or 2.4 σ, with the zero contour omitted. The cross is as in Fig.1
3.2. Continuum Emission: a spiral pattern?
The continuum emission from AB Aur is quite peculiar. While most other T Tauri stars and HAeBe stars observed at high an-gular resolution show a centrally peaked emission, the emission from AB Aur is reminiscent from that of GG Tau, except for the angular scale which is a factor of 2 smaller here. The emission peaks accurately coincide with bright features observed in the STIS image of Grady et al. (1999), but our observations allows to trace the regions which are occulted by coronagraphic mask or by the telescope spider in the HST observations.
No reliable estimate of the inclination of the structure can be obtained from the 1.4 mm image only, because of the highly asymmetric nature of the emission. We have deprojected the emission assuming at position angle −31◦, as derived from our
analysis of the 13CO data, and an inclination of 23◦. These
values are also in agreement with the numbers quoted by Fukagawa et al. (2004) from the scattered light in H-band. The result is presented in Fig.4: the asymmetry seen in continuum may follow inwards the spiral-like features detected in scat-tered light by Fukagawa et al. (2004). By extension, we shall refer to this structure as “the spiral”.
Although the spiral near 160 AU is the most striking fea-ture in the continuum, weak extended emission is also found at larger distances from the star. When interpreted in terms of a truncated disk, the best fit requires a disk with an inner ra-dius of ≃ 110 AU, an outer rara-dius ≃ 350 AU, and a power law distribution for the surface density of p ≃ 2.3 (see Table 1). This outer radius is within 2σ of the 280 AU ring detected at 20.5 µm by Pantin et al. (2005). Negligible emission arise from beyond 350 AU, as shown by the lower resolution, higher brightness sensitivity images displayed in Fig.5. A larger inner
Fig. 4. Deprojected image (from an inclination of 23◦) of the
continuum emission of AB Aur at 1.4 mm. The black curves indicate the approximate location of the spiral arms detected by Fukagawa et al. (2004). The white curve is a possible in-ward spiral arm revealed by this observation. The outer ring, at 350 AU, indicates the measured outer radius of the contin-uum emission. The inner ring, at 280 AU, is the location of the feature observed by Pantin et al. (2005) at 20.5 µm.
Fig. 5. Images of the continuum 2.8 and 1.4 mm emission of AB Aur at 1.4 mm. 1.4 mm image: resolution 1.3′′, contour
spacing 1.3 mJy/beam (22 mK, 2 σ) 2.8 mm image: resolution 2.0′′, contour spacing 0.6 mJy/beam (16 mK, 2 σ) The ellipse,
at 350 AU, indicates the measured outer radius of the contin-uum emission.
radius is found at 1.4 mm than in the CO lines (see Table 1). This is presumably due to a combination of the smaller dust opacity with a progressive fall of the surface density inside the ring. When modelled with a sharp edge, this naturally results in the most optically thin tracer, namely the dust emission, having the largest apparent inner radius.
A simultaneous fit of the 2.7 and 1.4 mm continuum data allows to derive the spectral index of the dust emis-sivity, β = 1.4 ± 0.2, assuming the emissivity κ(ν) =
3.3. Line Emission: the Disk
The double peak profiles, combined with the strong velocity gradient along the major axis of the emission which is found in all transitions, suggest that the material around AB Aur is dominated by a circumstellar disk in Keplerian rotation.
We thus attempted to model the emission by a simple Keplerian disk model, in hydrostatic equilibrium, as performed successfully for T Tauri stars like DM Tau (Guilloteau & Dutrey 1998), GM Aur (Dutrey et al. 1998) and other PMS stars including the Herbig Ae star MWC 480 (Simon et al. 2000). We modelled the circumstellar matter, gas and dust, us-ing the same strategy than those applied in Dartois et al. (2003) for the DM Tau disk. The12
CO J=2→1 transition traces the CO surface of the disk while the13
CO J=1→0 & J=2→1 lines trace material closer to the mid-plane.
Clearly, AB Aur is surrounded by a very large disk. All 4 spectral lines give a consistent value for the orientation of the disk axis, −30◦± 1◦ East from North. The outer radius is of
order 1000 AU, except for C18
O J=1→0 which is significantly smaller (600 AU). Note that the J=2→1 transitions, specially from12CO may underestimate the true radius because of a lack of sufficient short spacings.
Both13CO transitions give a consistent value for the rota-tion velocity at 100 AU, v sin(i) = 1.60 ± 0.05 km.s−1, and a slightly different value from12CO. When attempting to fit the data with a simple Keplerian disk model, the derived inclina-tions are different (34, 36 and 43◦), and the derived stellar mass
(0.9 – 1.2 M⊙) far from the expected value for an A0 star. From Table 1, it is clear that a simple Keplerian disk model fails to fit properly all observed transitions, even if account is taken of a possible vertical temperature gradient in the disk as has been observed in DM Tau by Dartois et al. (2003). The most sig-nificant result is that the velocity law deviates from Keplerian motions. From13CO J=2→1, the exponent is v = 0.42 ± 0.01, instead of v = 0.50 for Keplerian motions, and the J=1→0 gives a consistent result. The law deduced from12CO is much steeper, with an exponent of order 0.8.
It is of course conceivable that the 12CO J=2→1 data be discarded in such an analysis, because of the confusion with the surrounding molecular cloud. Indeed, the fit by emission from a disk leaves significant residual, and cannot represent for example the excess emission in the N-E which is seen in CO at velocities between 4.7 and 6.8 km.s−1. The large turbulent width found in this analysis is just a result of attempting to fit non-symmetric features with a pure rotating disk. Despite these caveats, an important result from the CO data is the high temperature (T100≃ 65 − 70 K) required in the inner 100 AU.
The two transitions of the 13CO isotopologues yield rea-sonably consistent results. Some of the differences can be at-tributed to the importance of the emission coming from the continuum spiral in the13
CO J=2→1 data. This bright emis-sion dominates the total flux, and biases the derived inclina-tion towards higher value, because the spiral curves inwards towards the North-West. If the aspect ratio of the13
CO J=2→1 integrated emission is taken as a measure of the inclination of a simple disk, as did Mannings & Sargent (1997), quite high val-ues are found (≃ 70◦). Significantly lower values are obtained
when the constraints from the kinematics of a rotating disk is incorporated, but the result on the inclination is still biased be-cause of the emission from the spiral. The 13CO J=1→0 line being observed with lower angular resolution is less sensitive to the spiral feature, and yields an inclination i = 39 ±2◦. Given the departure from circular symmetry, lower values (e.g. down to 25◦) cannot be excluded. We note also that it is necessary to
introduce an inner radius of about 70 AU to best reproduce the 13CO emission (see Table). This inner gap is clearly visible in the integrated intensity maps of Fig.1.
The most clear result from the 13CO analysis is that the best fit to the velocity law is obtained with an exponent v = 0.41 ±0.01. This is a very robust result: we checked that the de-rived exponent is independent of the assumed inclination over a range from 20◦ up to 50◦. This robustness also applies to most other parameters (column density law, inner and outer radii, temperature law, turbulent width). Using a stellar mass
M∗ = 2.2 M⊙ for AB Aur, the Keplerian speed at 100 AU is ≃ 4.4 km.s−1. Accordingly, for the nominal inclination of 39◦, the orbital velocities are sub-Keplerian (v(r) < √GM
∗/r)
out to the disk edge. However, if the inclination is lower than
≃ 22◦, the orbital velocities are super-Keplerian outwards of ≃ 100 − 150 AU.
C18
O J=1→0 data, although more noisy, also give a i ≃ 39◦
inclination. This result is important, since C18
O J=1→0 is the most optically thin of all observed transitions, and thus the less likely to be affected by an extended envelope. The velocity exponent found from C18O v = 0.47 ± 0.04 (which still re-mains compatible with the 13CO results at 2σ), is essentially Keplerian, but the projected velocity at 100 AU is much smaller than expected from an A0 star, as in the case of other transi-tions. To reconcile the velocities with the expected stellar mass would require an inclination of ≃ 23◦. Note also that, because
of its optical thinness, this transition mostly samples the inner radii with little contribution from the outer parts of the disk (r > 300 AU) and the envelope. Also, an independent con-straint on the surface density and the temperature laws is no longer possible; for an optically thin J=1-0 line, the data only constrain the ratio Σ/T and the value of p − q (Dartois et al. 2003).
For all transitions, we have also checked whether adding a radial velocity component would provide a better fit to the kine-matic pattern. For13CO and C18O , the upper limit on a radial velocity is below 0.05 km.s−1. For12CO , a slightly better fit is found by adding outward motions of order 0.2 km.s−1. The significance of this result should not be overestimated, since the excess emission towards the North near VLSR= 6.5 km.s−1 (see Fig.2) may bias the result. Note that we can discriminate between inward and outward motions only because we know the full 3-D orientation of the AB Aur disk (the Southern part being towards us, in agreement with Fukagawa et al. (2004)).
4. Discussion
The observations presented above bring new information about the circumstellar environment of AB Aur, which appears to be very different from other proto-planetary disks.
Pi´etu, Guilloteau & Dutrey: Sub-arcsecond images of AB Auriga 7
Table 1. Best parameters for the AB Aurigae disk derived from χ2minimization in the UV plane.
Assumed Distance D (pc) = 140 Lines 12 CO J=2→1 † 13 CO J=2→1 ‡ 13 CO J=1→0 ‡ C18 O J=1→0 ♯ Systemic velocity VLSR(km.s−1) = 5.89 ± 0.01 5.84 ± 0.01 5.87 ± 0.03 5.84 ±0.02 Orientation PA (◦) = -27.5 ±0.5 -31.3 ±0.3 -30 ±1 -29 ±1 Inclination i (◦) = 33 ±1 42 ±1 39 ±2 36 ±3
Inner radius Rin(AU) = 45 ±3 72 ± 5 77 ±5 67 ±6 Outer radius Rout(AU) = 1050 ± 10 890 ± 10 1300 ±100 600 ±60 Turbulent linewidth ∆v (km.s−1) = 0.38 ± 0.02 0.22 ±0.02 0.26 ±0.02 0.18 ±0.05
Molecular Column density law: Σ(r) = Σ100(100AUr )−p
Column Density at 100 AU Σ100(cm−2) = (1.4 1019) 2.3 1017 ±0.3 1017 3.2 1017 ±0.8 1017 9.5 1016 ±1.3 1016 exponent p = (2.5) 2.4 ±0.1 2.5 ±0.3 3 ♯ Temperature law: T (r) = T100( r 100 AU)−q Temperature at 100 AU T100(K) = 68 ±1 38 ± 2 34 ±2 20 ±3 exponent q = 0.77 ±0.02 0.16 ±0.03 0.10 ±0.14 -0.6 ±0.2 Velocity law: V(r) = V100(100 AUr )−v Velocity at 100 AU V100(km.s−1) = 3.06 ±0.06 2.54 ±0.03 2.73 ±0.12 2.75 ±0.13 Velocity exponent v = 0.82 ±0.02 0.42 ±0.01 0.37 ±0.02 0.47 ±0.04 Continuum Results * Dust: κν=κo× (1012νHz) β Absorption law κo(cm2/g) = (0.1) Dust exponent β = 1.4 ± 0.2 Surface Density law: Σ(r) = Σ100(100 AUr )−p
Surface Density Σ100(H2cm−2) = 6.3 1023 ±0.8 1023
at 100 AU Σ100(g.cm−2) = 2.7 ±0.3
exponent p = 2.3 ±0.2
Inner radius Ri(AU) = 115 ±5
Outer radius Rd(AU) = 350 ±30
Mass Md( M⊙) = 1.6 10−2 ±0.2 10−2
‡ ) For the13CO lines, the error bars are derived from the 1σ formal
errors from the χ2 fit. We checked that all parameters (except of course V100) are essentially independent of the inclinations over the 25 − 45◦
range (see Section 3.3).
† ) For12CO, multiple minima exist. We have selected a solution in
which the scale height is determined from the13CO results: h
100= 12 AU, h = −1.40. The error bars, when mentioned, represent the typical (1
σ) variations of the parameters obtained when varying all other ones. Numbers in parenthesis represent assumed (fixed) values.
♯) For the C18
O, only p − q is actually constrained: p − q = 3.6 ± 0.2. See text for details.
* ) For the continuum data, the temperature was taken as 35 K at 100 AU
with an exponent of q = 0.3. The surface densities and mass (and their errors) are given for β = 1.4. An additional 30 % uncertainty should be added for these quantities, because of the error on β.
4.1. The “spiral”
First, the sub-arcsecond image of the continuum emission at 1.4 mm extends inwards the spiral structure detected in the near IR by Fukagawa et al. (2004). Considering the sense of rotation, the new portion of the spiral is trailing, as the pre-vious arms. Dust emission at long wavelengths being propor-tional to κνΣT , this enhanced brightness could be due to 3
ef-fects: 1) a column density, 2) a change in dust properties, with larger grains in the spiral, or 3) a larger temperature. However, grain growth cannot explain the enhanced molecular emission which is also seen in the spiral. It is not straightforward to dis-entangle between the two remaining effects from the present data only. Taken at face value, the analysis of13CO lines seem to indicate a flat (or even rising) temperature throughout the
disk. However, this result is to be taken with care, since the 13CO lines are optically thick only in the inner spiral, whose structure is not adequately fitted by the disk model. A better insight is given by the fact that the C18
O J=1→0 line emission is proportional to Σ/T (Dartois et al. 2003), rather than ΣT for optically thin dust emission. Since the brightness contrast in C18
O J=1→0 is similar to that in the 1.4 mm continuum, it thus suggests the enhanced brightness is a column density ef-fect.
The difference between the apparent inner radius in dust (110 AU) and in CO (≃ 70 AU from all lines) indicates that the structure of the inner region is much more complex than a simple hole, in sharp contrast with the case of GG Tau (Dutrey et al. 1994; Guilloteau et al. 1999), but its detailed structure is beyond the resolving power of these observations.
4.2. The Inclination Problem and non-Keplerian Velocities
By revealing non circular structures, these observations offer some explanation for the widely different inclinations which were derived in the past from mm tracers and optical images. High inclinations are ruled out by our data. Although an incli-nation of ≃ 38◦seems adequate to represent most of the
sion, it is certainly biased by the non-circularity of the emis-sion. Given the uncertainties, inclinations as low as 23◦cannot
be excluded.
On the other end, we note that the inclinations derived for the inner disk (< 2 AU) through near-IR interferometry by Eisner et al. (2003) could be biased towards low values by non-circular structure, if the “spiral” pattern persists at such dis-tances from the star.
In any case, the orbital velocities significantly differ from the Keplerian speed. In addition, the turbulence (see Table 1) appears somewhat larger in AB Aur (0.2 km.s−1if we exclude 12CO) than in other sources like e.g. DM Tau. Unfortunately, the exact value of the inclination plays a major role in the un-derstanding of the environment, because depending on the as-sumption about projection effects, the orbital velocities of the material surrounding AB Aur can be sub-Keplerian or super-Keplerian throughout most of the disk.
4.3. Kinetic Temperature
In this respect, the AB Auriga disk behaves like those around other T Tauri stars. There is a clear evidence for a kinetic tem-perature gradient from the disk mid-plane to the disk surface and envelope, with the disk plane being cooler (around 30 K, as traced by13CO and C18
O) than the envelope (∼ 70 K at 100 AU, as traced by 12CO, see Table 1), as expected from heat-ing by the central star. The temperature remains high (≃ 30 K) throughout the disk, as expected from the much higher lumi-nosity of AB Aur compared to typical T Tauri stars. However, the temperature derived from 12CO falls below that derived from13CO lines beyond a radius about 400 – 500 AU. This could be due to self-absorption by the (colder) envelope.
4.4. Molecular Abundances and Disk Mass
The derived outer radius of the dust disk is much smaller (≃ 400 AU) than that the molecular disk (≃ 1300 AU). At 200 AU, the ratios of the molecular column densities and H2 sur-face density derived from the dust indicate a molecular abun-dance [13CO/H2] ≃ 5 10−7, similar to that of the Taurus cloud (10−6, Frerking et al. (1982). The value of the dust opacity
in-dex β = 1.4 ± 0.2 (giving κ220GHz = 0.012 cm2/g), is at the high end of the values found in circumstellar disks (and in par-ticular of those observed simultaneously with AB Aur, which share the same flux calibration, see Section 2.1). Dutrey et al. (1996) indicate a mean value of β = 0.95 ± 0.11 from an en-semble of disks. This suggests that the disk around AB Aur may be younger than average, and that dust grains have not evolved as much as in disks around T Tauri stars. The relatively high temperatures (above 30 K) prevent condensation on dust
grains, and probably explain why CO is not significantly de-pleted, contrary to most other circumstellar disks (e.g. Dutrey et al. (1996)).
The lack of detectable dust emission beyond 350 AU could indicate that the dust opacity drops there. Since the molecular content only changes smoothly with radius, this suggest that the dust absorption coefficient at 1.4 mm is smaller beyond 350 AU than inside, i.e. that the dust is significantly less evolved out-side. Another alternative is a steepening of the surface density distribution beyond ≃ 300 AU, since the values derived from the dust (p = 2.3) is slightly lower than that derived from the CO molecules (p = 2.7). The latter possibility is however not supported by the C18O data, which are only sensitive to the in-ner regions. It is tempting to relate the change of dust properties near 350 AU to the bright 20 µm ring detected by Bouwman & Pantin (2003) at 280 AU.
Both the high β value, and the possible dust opacity drop beyond 350 AU suggest that the dust in AB Aur is less evolved than in other T Tauri disks.
5. Origin of the disturbances
The AB Aur environment, although dominated by a rotat-ing disk, is clearly highly disturbed and far from the quasi-equilibrium Keplerian stage encountered around other young stars. We discuss here some mechanisms which could lead to these peculiarities.
5.1. Multiplicity ?
Ring-like structures are easily formed by tidal truncations in bi-nary systems, as illustrated by the case of GG Tau (Dutrey et al. 1994; Guilloteau et al. 1999). AB Aur has never been reported as having a companion. Limits on any companion mass can be derived from the literature. For example, using the bright-ness profile published by (Fukagawa et al. 2004) in the H band, and the evolution models from Baraffe et al. (1998, 2002), we find a (conservative, especially at large radii) upper limit on any coeval companion of less than 0.02 M⊙in the field of view of the Subaru image. This upper limit on the mass holds for 120 < r < 1500 AU. For closer objects, the limits are more difficult to quantify. Pirzkal et al. (1997) give an upper limit of 0.25 M⊙down to 0.4′′(60 AU). A stronger limit can be derived from Leinert et al. (1994) in the range 0.07 − 1.0′′ (10 to 140
AU), as their speckle observations show that the flux of any companion in K band could not exceed 1 to 3 % of the flux of AB Aur, for this range of separations. This gives an upper limit of about 5.2 – 6 to the K magnitude of a possible companion, which translates into a mass limit of 0.05 – 0.3 M⊙for ages between 1 and 10 Myr. Unfortunately, a companion of mass
Mc ≪ M∗ on an orbit with semi-major axis a could create a
gap of half-width w a few times the Hill’s radius
w ≃ Far M3 3Mc
∗
(1) where F is an empirical factor of order 2 – 3 (Morbidelli 2002). If viscosity is not negligible, the conditions for gap creation
Pi´etu, Guilloteau & Dutrey: Sub-arcsecond images of AB Auriga 9
and the resulting gap width are different. Using an α prescrip-tion for the viscosity, Takeuchi et al. (1996) indicate a gap half width
w ≃ 1.3aA1/3 (2)
where A is the ratio of strength of tidal effects to viscous effects
A = Mc
M∗
!2
1
3α(h/r)2 (3)
Using h/r ≃ 0.1 as derived from our measurements, and
α = 0.01, we find A > 1, for Mc > 0.05 M⊙. Hence,
viscos-ity is unlikely to affect our conclusions. Accordingly, even a 0.05 M⊙companion orbiting AB Aur around 40 AU could con-ceivably evacuate the inner hole. Whether it could sustain the non Keplerian velocities requires detailed studies. Higher sen-sitivity optical observations are required to setup more stringent limits on the existence of any companion.
5.2. A gravitationally unstable disk ?
Table 1 shows that the total mass of the system made by the disk and the envelope is not important enough to be self-gravitating. This can be better assessed using Toomre’s Q criterium:
Q = csΩ
πGΣ < 1 (4)
where cs is the sound speed, and Ω the angular momentum. With our power laws, Q is also a power law of the radius Q(r) =
Q0(r/R0)−twith Q0 = 1 πG r k m √ T0v0 Σ0R0 (5) t = 1 + q/2 + v − p (6)
Using the values from Table 1, we find Q0 ≃ 11 at 100 AU and t = −0.7 ± 0.2, well above the stability limit. To have the disk massive enough for instability would only be possi-ble if the CO depletion was high (> 20) and the dust opacity 10 times lower than we assumed. Both possibilities are highly unlikely as discussed in Section 4.4. For example, lowering the dust opacity by a factor 10 would require a value of β = 3.9, as-suming the absorption coefficient at 1012Hz remains constant. Furthermore, t being negative, the stability increases with dis-tance from the star.
5.3. Possible encounters
Another possible explanation is a past encounter with a star. We have been looking in the SIMBAD database for all stars in a radius of 30 arc-minutes centered around AB Aur. Of a total of 31 stars referenced, 16 of them possess proper motion mea-surements. 9 come from the survey of Jones & Herbig (1979). 4 come from the Tycho Reference Catalog (Roeser & Bastian 1988), and 3 Hipparcos measurements were available (4 all to-gether with AB Aur) - (Perryman et al. 1997). A very simple analysis shows that at least 2 of them could have encountered AB Aurigae in the past. JH433 could have encountered AB Aur at any time older than 35 000 years, whereas there could have
been an encounter between AB Aur and RW Aur, some 500 000 years ago. We should also mention that according to the early measurement of Jones and Herbig, SU Aur could have met AB Aur is a close past, but that Hipparcos measurements rule out this possibility.
5.4. A young disk ?
Rather than being affected by multiplicity, the situation may suggest instead that AB Aur is surrounded by a young circum-stellar disk which has not yet relaxed to the Keplerian stage.
In the formation of a star + disk from the collapse of a ro-tating interstellar cloud, the low specific angular momentum directly accretes to form the star, but the higher angular mo-mentum accretes through a disk. Cassen & Moosman (1981) have pointed out that, because of the projection of the mo-mentum along the disk axis, the accreting material always have lower angular momentum than the Keplerian value where the accreting material trajectories cross the disk. However, when a complete history of the accretion is incorporated, Stahler et al. (1994) have shown that the disk evolution, which occurs be-cause of the drag force induced by the accreting material, re-sults in a semi-steady state situation in which the outer disk is super Keplerian. Both studies conclude that a massive ring should be formed. Stahler et al. (1994) show that this ring ac-cumulates mass, and acts as a temporary storage for the excess angular momentum brought by the accreting gas.
It is tempting to identify this ring with the enhanced density region which is seen in continuum and line at about 150 AU from the star. If the inclination of the disk is low, ≃ 23◦, the measured rotation velocities exceed the Keplerian speed at all distances above 100 AU from the star (our measurements are insensitive to the exponent of the rotation velocity within the inner 100 AU). The apparent spiral arms could be the result of instabilities which necessarily occur in such a situation, since the ring is a transient phenomenon. A possible difficulty in this interpretation resides in the timescales over which the ring and supra-Keplerian velocities persist. Accretion on the disk only occurs over the infall timescale, which remains to first order similar to the free-fall time tff, i.e. a few 104years at most. The
age of AB Aur, tAB Aur is estimated to range between 1 and 4 Myr. 4 Myr is cited by DeWarf et al. (2003), on the basis of a coevality with the nearby star SU Aur, which has similar high proper motions to AB Aur. Lower ages are usually quoted by other authors, AB Aur being among the youngest known HAeBe star. However, AB Aur is already relatively hot, being of spectral type A0 V, so that an extremely young age, a few 105 years, appears to be ruled out from the currently available evo-lutionary tracks. The main accretion phase on the disk should thus likely be finished.
However, the longest timescale over which the circumstel-lar disk evolves is the viscous timescale,
tvis(r) ≈ r2 νturb = r 2 αcsH(r) (7) in the α prescription of the turbulence. We find
tvis=
rv(r)µ
αkT (r) = tvis(100 AU)(r/100 AU)
Using α = 0.01, and the temperature and velocity from Table 1, we find tvis ≃ 106yr at 100 AU, which is comparable to the estimated age of AB Aur. It is thus conceivable that the AB Aur disk has not relaxed to a purely Keplerian stage and stills exhibit a disturbed kinematic and density pattern. However, it is important to mention that the viscous timescale strongly de-pends on the assumed viscosity parameter α, but little on the stellar properties. As a consequence, the above value is also applicable to T Tauri disks which exhibit clear Keplerian signa-tures, like those around DM Tau, LkCa 15 or GM Aur. Unless the viscosity is different in both type of objects, this suggests that AB Aur is younger.
6. Summary
We have shown from observations of dust and 4 lines from the CO isotopologues that AB Aur is surrounded by a flattened, non-circularly symmetric disk, in rotation around the star. As expected from the high stellar luminosity, the disk is warm, and CO is not significantly depleted. The determination of the disk inclination is biased by the non-circularity of the brightness distribution, but the rotation has clear non Keplerian character-istics. No completely satisfactory explanation exists for these unusual characteristics. The disk does not appear to be massive enough to be self-gravitating. Upper limits on any companion are not stringent enough to conclude. No evidence for infall motions could be detected. It is tempting to see AB Aur as an example of a very young object in which traces of the accre-tion from a rotating envelope onto the disk surface have not yet been erased by the dynamical and viscous evolution of the disk. An independent indication of youth comes from the dust prop-erties, since the β index may indicate that dust grains have not evolved in the AB Aur disk as much as in other proto-planetary disks.
Acknowledgements. We acknowledge all the Plateau de Bure IRAM
staff for performing the observations. We thank J.M.Hur´e and H.Beust for fruitful discussions on the physics of disks. The HST image was kindly provided by C.Grady. This research has made use of the SIMBAD database, operated at CDS, Strasbourg, France. We acknowledge financial support from the “Programme National de Physique Chimie du Milieu Interstellaire” PCMI coordinated by INSU/CNRS.
References
Baraffe, I., Chabrier, G., Allard, F., & Hauschildt, P. H. 1998, A&A, 337, 403
Baraffe, I., Chabrier, G., Allard, F., & Hauschildt, P. H. 2002, A&A, 382, 563
Bouwman, J., de Koter, A., van den Ancker, M. E., & Waters, L. B. F. M. 2000, A&A, 360, 213
Bouwman, J. & Pantin, E. 2003, in Astrophysics of Dust Cassen, P. & Moosman, A. 1981, Icarus, 48, 353 Chen, C. H. & Jura, M. 2003, ApJ, 591, 267
Dartois, E., Dutrey, A., & Guilloteau, S. 2003, A&A, 399, 773 DeWarf, L. E., Sepinsky, J. F., Guinan, E. F., Ribas, I., &
Nadalin, I. 2003, ApJ, 590, 357
Dutrey, A., Guilloteau, S., Duvert, G., et al. 1996, A&A, 309, 493
Dutrey, A., Guilloteau, S., Prato, L., et al. 1998, A&A, 338, L63
Dutrey, A., Guilloteau, S., & Simon, M. 1994, A&A, 286, 149 Eisner, J. A., Lane, B. F., Akeson, R. L., Hillenbrand, L. A., &
Sargent, A. I. 2003, ApJ, 588, 360
Frerking, M. A., Langer, W. D., & Wilson, R. W. 1982, ApJ, 262, 590
Fukagawa, M., Hayashi, M., Tamura, M., et al. 2004, ApJ, 605, L53
Grady, C. A., Woodgate, B., Bruhweiler, F. C., et al. 1999, ApJ, 523, L151
Guilloteau, S. & Dutrey, A. 1998, A&A, 339, 467
Guilloteau, S., Dutrey, A., & Simon, M. 1999, A&A, 348, 570 Hern´andez, J., Calvet, N., Brice˜no, C., Hartmann, L., &
Berlind, P. 2004, AJ, 127, 1682
Jones, B. F. & Herbig, G. H. 1979, AJ, 84, 1872
Leinert, C., Richichi, A., Weitzel, N., & Haas, M. 1994, in Astronomical Society of the Pacific Conference Series, 155–
+
Mannings, V., Koerner, D. W., & Sargent, A. I. 1997, Nature, 388, 555
Mannings, V. & Sargent, A. I. 1997, ApJ, 490, 792
Meeus, G., Waters, L. B. F. M., Bouwman, J., et al. 2001, A&A, 365, 476
Monnier, J. D. & Millan-Gabet, R. 2002, ApJ, 579, 694 Morbidelli, A. 2002, Modern celestial mechanics : aspects of
solar system dynamics (London: Taylor and Francis, 2002, ISBN 0415279399)
Pantin, E., Bouwman, J., & Lagage, P. 2005, A&A, in press Perryman, M. A. C., Lindegren, L., Kovalevsky, J., et al. 1997,
A&A, 323, L49
Pi´etu, V., Dutrey, A., & Guilloteau, S. 2005, in preparation Pi´etu, V., Dutrey, A., & Kahane, C. 2003, A&A, 398, 565 Pirzkal, N., Spillar, E. J., & Dyck, H. M. 1997, ApJ, 481, 392 Roeser, S. & Bastian, U. 1988, A&AS, 74, 449
Simon, M., Dutrey, A., & Guilloteau, S. 2000, ApJ, 545, 1034 Stahler, S. W., Korycansky, D. G., Brothers, M. J., & Touma,
J. 1994, ApJ, 431, 341
Takeuchi, T., Miyama, S. M., & Lin, D. N. C. 1996, ApJ, 460, 832
van den Ancker, M. E., de Winter, D., & Tjin A Djie, H. R. E. 1998, A&A, 330, 145
![Fig. 1. Line emission (integrated over the [3.8,8.2] km.s − 1 velocity range, and continuum emission towards AB Aur](https://thumb-eu.123doks.com/thumbv2/123doknet/14792870.602218/4.892.62.829.132.621/fig-line-emission-integrated-velocity-range-continuum-emission.webp)