HAL Id: hal-02163470
https://hal.uca.fr/hal-02163470
Submitted on 9 Dec 2019
HAL is a multi-disciplinary open access archive for the deposit and dissemination of sci-entific research documents, whether they are pub-lished or not. The documents may come from teaching and research institutions in France or abroad, or from public or private research centers.
L’archive ouverte pluridisciplinaire HAL, est destinée au dépôt et à la diffusion de documents scientifiques de niveau recherche, publiés ou non, émanant des établissements d’enseignement et de recherche français ou étrangers, des laboratoires publics ou privés.
Evidence for a persistent magma reservoir with large
melt content beneath an apparently extinct volcano
Mickaël Laumonier, O. Karakas, O. Bachmann, Fabrice Gaillard, R. Lukacs,
I. Seghedi, Thierry Menand, S. Harangi
To cite this version:
Mickaël Laumonier, O. Karakas, O. Bachmann, Fabrice Gaillard, R. Lukacs, et al.. Evidence for a persistent magma reservoir with large melt content beneath an apparently extinct volcano. Earth and Planetary Science Letters, Elsevier, 2019, 521, pp.79-90. �10.1016/j.epsl.2019.06.004�. �hal-02163470�
Evidence for a persistent magma reservoir with large melt content beneath an apparently extinct
1
volcano
2 3
M. Laumonier1*, O. Karakas2, O. Bachmann2, F. Gaillard3, R. Lukács4, I. Seghedi5, T. Menand1, S. 4
Harangi4,6, 5
6
1Université Clermont Auvergne, CNRS, IRD, OPGC, Laboratoire Magmas et Volcans, F-63000
7
Clermont-Ferrand, France 8
2Department of Earth Sciences, Institute of Geochemistry and Petrology, ETH Zurich, Switzerland
9
3Université d'Orléans, CNRS, BRGM, ISTO, UMR 7327, F -45071, France
10
4MTA-ELTE Volcanology Research Group, Budapest, Hungary
11
5Institute of Geodynamics, Romanian Academy, Bucharest, Romania
12
6Eötvös Loránd University, Department of Petrology and Geochemistry, Budapest, Hungary
13 14
*corresponding author: mickael.laumonier@gmail.com 15
16
Keywords
17
Seemingly inactive volcano; Magma storage; numerical simulation; mush petrology; in-situ 18
electrical-conductivity measurement; geophysical interpretation. 19
20
Highlights
21
• Petrological observations imply a trans-crustal magmatic system beneath Ciomadul 22
• Thermal evolution of such magmatic system is consistent with melt persistence 23
• Electrical measurements confirm the presence of 20-58% of hydrous melt under Ciomadul 24
• Ciomadul has a long-term subvolcanic magma storage above the solidus 25
• Volcano status must be defined based on the magmatic reservoir storage conditions 26
27
Abstract
28
Most active volcanoes display eruption frequencies of 10-1000s years but a class of volcanic systems 29
has extremely long repose-time (>10’s kyr), and are deemed as extinct. Yet, some reawaken, posing 30
a particular threat because little is known about the way they endure and stir back to life. 31
Reawakening primarily depends on the nature of the subvolcanic magma reservoir, especially the 32
presence and distribution of melt. Here, we integrate petrology, thermobarometry, 33
thermomechanical models, geophysics and in situ electrical conductivity measurements to show 34
that the magma storage beneath Ciomadul, a seemingly inactive volcano in eastern-central Europe 35
that last erupted 30 ka, may still hold 20 to 58 km3 of water-rich silicic melt, constituting up to 20-36
58 % in parts of the upper crustal crystal mush body. Such a melt volume exceeds the volume of 37
erupted lava over the entire history of the volcano. This illustrates the important longevity of a 38
magmatic reservoir at temperature above the solidus, which implies that there is still a potential for 39
rapid mush rejuvenation. That a seemingly dead volcano like Ciomadul is actually capable of 40
erupting in the future calls for renewed attention to “inactive” volcanoes worldwide and perhaps 41
for a redefinition of their activity/inactivity status. 42
1. Introduction
43
1.1. Magma storage beneath volcanoes
44
Magma reservoirs beneath volcanoes are considered to subsist dominantly at high crystallinity 45
(Annen et al., 2006; Bachmann and Huber, 2016; Cashman et al., 2017) (“crystal mush”), surviving 46
over 10’s or 100’s thousands of years (Bachmann, 2010; Cooper, 2015; Costa, 2008; Gelman et al., 47
2013) as they are episodically replenished by magma influx from below (Annen et al., 2006; Karakas 48
et al., 2017). Within these bodies, melt-dominated (> ~50% melt) regions, i.e. magma chambers, can 49
form and feed volcanic activity. However, due to difficulties in detecting and probing such molten 50
bodies at depth, the magma storage conditions are still debated based on three main hypotheses: 51
reservoirs (1) contain a significant amount of melt for long periods of time (Barboni et al., 2016), (2) 52
remain dominantly just above the solidus at relatively low melt fraction, with some small melt-rich 53
pockets periodically forming by extraction from the much larger surrounding mush zone (Cooper, 54
2019; Szymanowski et al., 2017) or (3) they are stored dominantly in subsolidus state (Cooper, 2019; 55
Rubin et al., 2017). Existence and distribution of melt in the storage zone greatly affects the 56
reactivation potential of a magma body (Huber et al., 2011) and defines the nature of a volcano, i.e. 57
whether it is still potentially active or considered extinct. In this context, the prolonged preservation 58
of significant melt fractions in the storage region has a particular importance, and its detection and 59
description is crucial to assess the level of potential volcanic hazards. 60
Ciomadul, located in eastern-central Europe (Fig. 1) is an excellent example of a seemingly inactive 61
volcano(Harangi et al., 2015a; Szakács et al., 2015), because its eruption chronology shows long 62
quiescence periods(Molnár et al., 2018) between active phases, with its last eruption occurring 63
around 30 ka (Harangi et al., 2015a; Karátson et al., 2016; Molnár et al., 2019). It consists of fairly 64
homogeneous high-K dacites, but contains complexly zoned crystals of plagioclase, amphibole and 65
biotite (Harangi et al., 2015b). Although Ciomadul has been in a seemingly inactive state for a long 66
time, several lines of evidence support a long-lived system holding a potentially active magma 67
storage (Harangi et al., 2015a, 2015b) (“PAMS” volcano): (1) significant CO2-emanations with strong 68
magmatic component (Kis et al., 2019), (2) wide range of zircon crystallization ages (from 60 ka to 69
350 ka) suggestive of a long-lived system till today(Harangi et al., 2015a) and (3) petrological 70
evidences for the presence of felsic crystal mush and open-system magmatic processes in the 71
magma storage(Harangi et al., 2015b; Kiss et al., 2014). Furthermore, (4) geophysical anomalies such 72
as low electrical resistivity and seismic wave attenuation were observed from the base of the crust 73
and may reveal the subvolcanic plumbing system(Harangi et al., 2015b; Popa et al., 2012). The 74
magnetotelluric survey evidenced a conductive body from about 5 to 27 km depth with a particularly 75
high signal between 9 and 21 km depth(Harangi et al., 2015b) (electrical resistivity < 2 ohm.m). Such 76
anomaly is consistent with the existence of a magma reservoir in the middle to upper crust, but this 77
shallow conductor makes it difficult to resolve potential underlying features (Bedrosian, 2007). From 78
geophysics, it is thus uncertain whether there is a continuous mushy zone down to the lower crustal 79
hot zone or not. The status of Ciomadul’s plumbing system, i.e. the existence and amount of melt, 80
cannot be elucidated solely from geophysical observations; petrological data could also help to 81
reveal the trans-crustal magmatic system(Cashman et al., 2017) beneath Ciomadul, as it has been 82
suggested for other magma storage systems around the world(Bachmann and Huber, 2016; 83
Christopher et al., 2015). 84
In order to better constrain the current state of Ciomadul volcano, we propose a direct modelling 85
of the geophysical signal of its plumbing system: a petrological analysis is used to build numerical 86
simulations of the thermal evolution of the magmatic reservoir that is converted into electrical 87
conductivity distribution. The integration of this modelling with geophysical observations indicates 88
that a significant amount of water-rich silicic melt (at minima 15%) must still be present in the upper 89
crust beneath the volcano, implying that the reservoir is likely to have been kept in warm enough 90
conditions to preserve sizeable domains in near-eruptible state. This calls for attention about long-91
dormant volcanoes and questions the definition of potentially active, dormant and extinct 92
volcanoes (Szakács, 1994), since their plumbing systems may be comparable to active volcanoes. 93
94
1.2. Geological settings of Ciomadul Volcano
95
Ciomadul is located at the southern edge of the ca. 160 km long Calimani-Gurghiu-Harghita volcanic 96
chain, and represents the latest manifestation of the Neogene to Quaternary volcanism in the post-97
collisional tectonic setting of the Carpathian-Pannonian Region (Fig. 1) (Harangi and Lenkey, 2007; 98
Seghedi and Downes, 2011). The volcanism of Ciomadul occurred in a geodynamically still active 99
region, close to the Vrancea area, where a near-vertical lithospheric slab descending in the upper 100
mantle causes frequent deep-hypocentres (70-170 km) earthquakes (Ismail-Zadeh et al., 2012). The 101
latest eruptions for the last 1 Myr (Molnár et al., 2018) formed a volcanic dome field consisting of 102
small volume (<0.5 km3) lava domes and the massive Ciomadul volcanic complex (8-14 km3). The
103
Ciomadul volcanic complex is the amalgamation of several lava domes truncated by two explosive 104
craters developed from 160 ka to 30 ka (Harangi et al., 2015a; Karátson et al., 2016; Molnár et al., 105
2019; Szakács et al., 2015). 106
107
Figure 1: Geological context of Ciomadul volcano. (A) Location of the Ciomadul volcanic complex in the southeastern 108
Carpathian area of the Carpathian-Pannonian Region (simplified geological map after Cloetingh et al., 2004 and Martin
109
et al., 2006). CG=Călimani-Gurghiu volcanic complex, H=Harghita volcanic complex, PVF = Perşani Volcanic Field. (B) The
110
study area in Europe and in the Carpathian-Pannonian region with the surface exposures of the Miocene to Quaternary
111
calc-alkaline andesitic to dacitic volcanic areas (red colour). (C) Cross section through the Quaternary volcanic areas and
112
the Vrancea seismic zone showing conceptual model for lower lithospheric ruptures due to the downgoing vertical
113
lithospheric slab beneath the Vrancea Zone (modified after Seghedi et al., 2011; PVF = Perşani Volcanic Field; CIO =
114
Ciomadul Volcanic Complex).
115 116
2. Samples and methods
117
2.1. Starting material
118
The pumiceous dacite studied experimentally to determine the electrical conductivity belongs to 119
one of the youngest eruptions of the Ciomadul (30 ka; Bixad locality; (Harangi et al., 2015a, 2010; 120
Vinkler et al., 2007)). It represents a hot block-and-ash flow deposit formed either by fountain 121
collapse of a Vulcanian explosion event such as occurred at Soufriere Hills, Montserrat in 1997 or 122
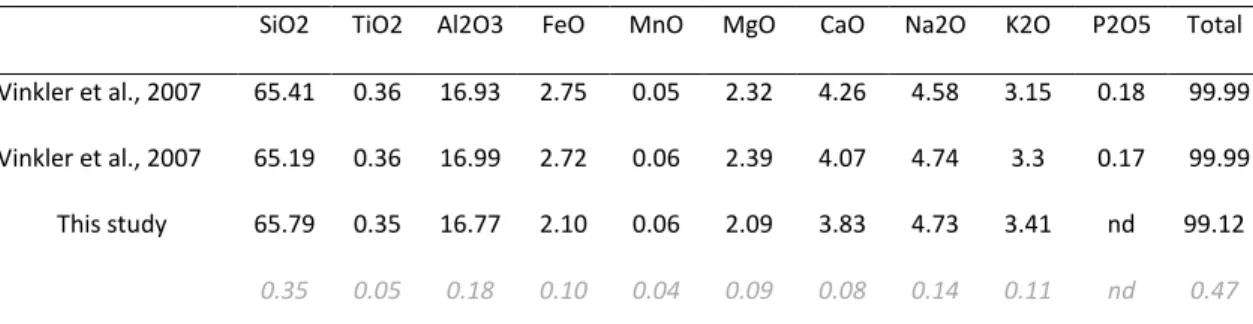
explosive destruction of a growing lava dome (Vinkler et al., 2007). The bulk composition is high-K 123
dacite typical of other volcanic products of Ciomadul (Molnár et al., 2018; Vinkler et al., 2007) (Table 124
1); it has relatively high Na2O (>4.2 wt%) and K2O (>3 wt%) contents, whereas the trace element 125
composition is characterized by abundance of Ba and Sr (both elements are above 1500 ppm), 126
depletion of Y (<10 ppm) and heavy rare earth elements (Yb <1 ppm; Lu<0.15 ppm). The dacite has 127
a vesiculated glassy groundmass with ca. 30 vol.% phenocrysts of plagioclase, amphibole and biotite 128
(see additional information in Results section). In the dome rocks, crystal clots frequently occur; 129
they are mostly felsic (plagioclase and amphiboles in addition to accessory minerals, while some of 130
them contain also quartz, K-feldspar and Fe-Ti oxides) and most of them contain interstitial vesicular 131
glass. Furthermore, the dome rocks usually contain high-Mg minerals, such as olivine, clinopyroxene 132
and orthopyroxene, both as solitary crystals and crystal clots. Their high mg-numbers (>85) indicate 133
origin from less differentiated basaltic magma (Kiss et al., 2014; Vinkler et al., 2007). The 134
monotonous chemical and petrologic natures of the erupted dacites at Ciomadul and volcanic 135
neighbours over the past 1 Myr (Molnár et al., 2018) suggest a rather uniform petrogenesis. 136
137
SiO2 TiO2 Al2O3 FeO MnO MgO CaO Na2O K2O P2O5 Total Vinkler et al., 2007 65.41 0.36 16.93 2.75 0.05 2.32 4.26 4.58 3.15 0.18 99.99 Vinkler et al., 2007 65.19 0.36 16.99 2.72 0.06 2.39 4.07 4.74 3.3 0.17 99.99 This study 65.79 0.35 16.77 2.10 0.06 2.09 3.83 4.73 3.41 nd 99.12
0.35 0.05 0.18 0.10 0.04 0.09 0.08 0.14 0.11 nd 0.47
Table 1: Bulk chemical composition (in wt%) of the Ciomadul dacite determined by ICP-MS method (Vinkler et al., 138
2007) and of the dry starting glass (30 analyses) after melting of the Ciomadul sample determined by Electronic
139
MicroProbe Analysis (standard deviation in italic font).
140 141
The chosen dacite sample as starting material (BX08 (Harangi et al., 2015b)) is regarded as 142
representative of potential magma nowadays residing in the subvolcanic system for the following 143
reasons: (i) the dacite is the dominant eruption product and it represents the latest eruption phase 144
(Harangi et al., 2015a), (ii) it contains relatively low amount of phenocrysts (< 30%), suggesting that 145
its bulk composition is close to the last melt composition before extraction from the reservoir and 146
eruption, (iii) it does not contain significant amount of felsic crystal clots representing the cold 147
crystal mush nor high-Mg mafic minerals (olivine and pyroxene) that represent fragments of mafic 148
recharge. 149
The natural sample was crushed and fused at 1450°C under atmospheric conditions for 3 hours 150
twice to ensure chemical homogeneity (Table 1). The resulting glass was crushed again and used 151
either to constitute the dry samples, or after hydration (with appropriate mass of water added) in 152
piston cylinder to produce 3.1 and 8.1 wt.% water samples. Hydration syntheses were performed in 153
welded shut gold palladium capsules at 1.5 GPa and 1300°C and held for 2 days to ensure a 154
homogeneous water content. 155
The water concentration in synthetic glass and experimental products was measured by infra-red 156
spectroscopy at ISTO (Microscope IR Continuμm coupled with a Nicolet 6700 spectrometer and a 157
MCT detector, Orleans, France) using KBr beam splitter. Each measurement consisted of 128 scans 158
with a resolution of 4 cm−1. The two hydrated syntheses and the post experimental glasses (dry and
159
hydrous) were analyzed through 4 to 17 spots to check for homogeneity of the water concentration 160
(Fig. 2). We calculated the water concentration using the Beer–Lambert law, with density and 161
extinction coefficients from the literature(Ohlhorst et al., 2001), and the peak height absorbance 162
corrected by a linear baseline. The thickness of the sample was measured by the calibrated stage of 163
the microscope with an accuracy of less than 3 micrometers. To determine the water concentration 164
of the water rich glasses (> 8 wt.%), we used the molecular water (5200 cm−1) and OH- (4500 cm−1) 165
stretching vibrations. The water content of “dry” glasses and glasses with ~3wt.% of water were 166
measured using the fundamental H2O-stretching vibration (3530 cm−1). The propagated uncertainty
167
results in a maximal error in [H2O] of 0.5 wt.%(Laumonier et al., 2017b). 168
169
170
Figure 2: Water content of dacitic glasses after hydration (Syntheses) and of experimental glasses after electrical 171
conductivity measurements (“Experiments”). Empty symbols correspond to single analyses and full symbols to the
172
average. The water variation before and after in situ electrical conductivity experiments is neglectable (lower than 5%).
173 174
2.2. Numerical simulation of the thermal evolution of Ciomadul upper reservoir
175
We used a two-dimensional thermal model modified from Karakas and Dufek (2015) and Karakas et 176
al. (2017) and quantified the magma evolution beneath Ciomadul volcanic system. The two-177
dimensional computational domain consists of a 60 km by 60 km section, where the upper 40 km 178
represents the crust according to Hauser et al. (2007) and the remaining 20 km represents the upper 179
mantle. Ciomadul volcanic system is idealized as having a 25 km upper-mid crust consisting of 180
amphibolite facies metamorphic rocks and 15 km lower crust consisting of granulite facies 181
metamorphic rocks. Initially, we assume that the crust has a steady-state geothermal gradient. The 182
temperature profile is calculated using one-dimensional steady-state heat equation using 183
radiogenic heating as a source term, where we assume that the radiogenic elements concentrate in 184
the uppermost 12 km of the crust and decay exponentially with depth. We chose a temperature of 185
0°C for the surface, and a constant heat flux at the mantle-crust boundary. After calculation of the 186
geothermal gradient, the side-boundary temperatures are kept constant during the transient 187
calculations. 188
In order to quantify the magma evolution in the crust over time, we emplace dikes and sills 189
incrementally over 105-106 yr. Intrusion of magmas increases the temperatures of the surrounding
190
crust, while the individual intrusions cool down due to heat transfer between the crust and the 191
magma. We solve for transient heat conduction equation using latent heat as the source term. We 192
follow the fully implicit finite volume scheme described by Patankar (1980) and use the iterative 193
predictor-corrector algorithm of Voller and Swaminathan (1991). We assume that the magma 194
emplacement process is stochastic and instantaneous as the dike emplacement timescales in nature 195
(days to weeks) are much faster than the timescales that we consider in the model (105-106 yr). We 196
acknowledge that the internal convection is important for the differentiation history of the crustal 197
magma bodies (i.e. (Dufek and Bachmann, 2010; Petrelli et al., 2018). However, over the time and 198
length scales that we focus in the present study, we can neglect convection effects as conduction is 199
the predominant process of heat transfer (Biot number (Bi) << 1 ; (Carrigan, 1988)). 200
The latent heat evolution of the system during melting and crystallization is calculated using the 201
phase diagrams of specific compositions from experiments and parameterized solutions from the 202
rhyolite-MELTS thermodynamic software (Gualda et al., 2012). The melt fraction-temperature 203
relationship of the metamorphic lithologies are taken from experiments of (Vielzeuf and Holloway, 204
1988). The intruded magma in the lower crust is assumed basaltic in composition (Nandedkar et al., 205
2014), and the intrusions in the upper crust are presumed dacitic (compiled from a number of 206
measurements (Gelman et al., 2013)). We follow the two-stage process described in Karakas et al., 207
(2017). The dikes and sills of basaltic composition are emplaced first in the lower crust over 1 Myr. 208
Following this lower crustal magma emplacement, heat distribution in the crust is calculated and 209
dacitic magma is then emplaced in the upper crust with intermediate to low fluxes (10-4 to 10-3 210
km3/yr) for 500 kyr between 7 and 15 km depths, and assuming constant heat flux between the 211
lower and upper crust. This allows us to calculate the thermal evolution as well as the melt evolution 212
in the upper crust and to compare our results with the electrical conductivity, petrology, and 213
magnetotelluric studies conducted in the Ciomadul Volcanic System. 214
215
2.3. In situ measurements of the electrical conductivity
216
Samples were cold pressed to form 5-mm diameter cylindrical pellets and drilled in the center 217
leaving a 1-mm diameter hole. They were then inserted in a piston cylinder assembly modified for 218
in situ electrical conductivity measurements (Laumonier et al., 2017b, 2015; Sifré et al., 2014): the
219
sample is sandwiched by alumina disks to reduce the chemical contamination and surrounded by a 220
platinum foil being the external electrode. The internal electrode is a 1-mm diameter platinum wire 221
inserted in the sample hole, in contact with the B-type thermocouple that was alternatively used to 222
read the temperature right above the sample and to measure the sample resistance. Typical MgO, 223
pyrex and talc were used to complete ¾ or ½ inch assembly according to the desired pressure. 224
225
The sample electrical resistance was measured by an impedance gain phase analyzer Solartron and 226
a 4-wire electrical set up adapted to the low resistance of hydrous silicate glasses. Resistance 227
measurements were performed during heating and cooling paths, once the temperature was stable 228
and with the thermocouple unplugged to avoid interferences with the electrical circuit. If the 229
temperature differed by more than 5°C before and after the resistance measurement, it was 230
repeated to reduce the uncertainty on the temperature. The electrical conductivity of the samples 231
was calculated from their resistance and their geometry, resulting in a typical error smaller than 0.2 232
log unit in conductivity (S/m) (Laumonier et al., 2015). The retrieved electrical conductivity is a 233
property of the melt being size-independent and that can directly be compared to the geophysical 234
estimations of electrical condutivity in the crust beneath Ciomadul volcano. 235
236
3. Results
237
3.1. Petrology of the Ciomadul dacite
238
Mineral-scale petrological studies of the erupted products of Ciomadul provide constraints on the 239
storage conditions prior to the latest eruption. Within the phenocryst assemblage, plagioclase and 240
amphibole are the dominant minerals and occur in similar relative amounts. 241
Two generations of compositionally homogeneous plagioclase are present in the youngest dacite: 242
(i) phenocryst-sized plagioclase with a spongy to sieved texture and occasional thin rim overgrowth 243
of clear plagioclase; (ii) microphenocryst-sized plagioclase without resorption feature and a clear 244
inner structure. In spite of the textural difference, both plagioclase phases have similar, relatively 245
homogeneous chemical compositions (An = 40-50 mol% and FeO = 0.2-0.3 wt%). Intergrowth of 246
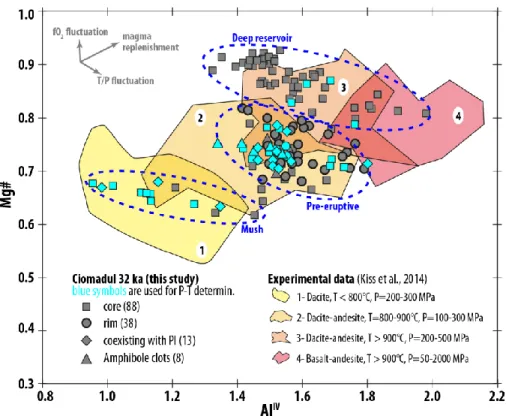
both types of plagioclases with amphibole is fairly common. Amphiboles show various zoning 247
patterns and cover a wide compositional range (Appendix A) that distinguishes three groups: low 248
Al-Mg (Aliv < 1.4, i.e. Al
2O3<10 wt%; MgO<14 wt%) hornblende, high Al-Mg (Aliv > 1.4, i.e. Al2O3>10 249
wt%; MgO>16 wt%) pargasite/Mg-hastingsite and an intermediate group (Aliv > 1.4, i.e. Al
2O3>10 250
wt%; MgO=13-16 wt%) (Fig. 3). Noteworthy, the intermediate composition amphibole occurs 251
always at the outer zone of the phenocrysts and appears to be in equilibrium with the erupted melt. 252
They are also found in amphibole crystal clots with interstitial glass. 253
255
Figure 3: Three compositional amphibole populations distinguished in the youngest dacite used in this study (symbols 256
distinguish crystal cores and rims as well as amphiboles coexisting with plagioclase; numbers of analysis are indicated
257
in parenthesis): low temperature and pressure (“mush”), high-temperature and high-pressure crystallization conditions
258
(“deep reservoir”) and, noteworthy, amphibole rim always falling into the intermediate-temperature amphibole group
259
(“pre-eruptive conditions”). P-T conditions from phase equilibrium experiments (yellow to red fields) are shown as
260
compiled by Kiss et al. (2014).
261 262
3.2. Thermobarometry
263
Pressure and temperature of the magma storage can be determined using the amphibole and 264
plagioclase compositions (Anderson et al., 2008; Holland and Blundy, 1994) on coexisting mineral 265
pairs or using single amphibole compositions (Féménias et al., 2006; Mutch et al., 2016; Ridolfi et 266
al., 2010; Ridolfi and Renzulli, 2012). However, the accuracy of these thermobarometric results is 267
heavily debated in the literature: Kiss et al. (2014) and Erdmann et al. (2014) suggested that the 268
barometric calculations introduced by Ridolfi et al. (2010) and Ridolfi and Renzulli (2012) may give 269
often erroneous result. Furthermore, the amphibole thermometer (Ridolfi et al., 2010; Ridolfi and 270
Renzulli, 2012) often yields higher temperature than that of Holland and Blundy (1994). 271
Gorini et al (2018) recommended special cares when using the Ridolfi and Renzulli’s 272
thermobarometer (Ridolfi and Renzulli, 2012), which were followed here (Appendix A). As a result, 273
less than 15% of the amphibole compositions with Al2O3>10 wt% from the studied dacite sample 274
passed the criteria and were acceptable for thermobarometric calculation (Appendix A). The 275
pressure determination is also discussed with care due to the additional effect of melt composition 276
on the amphibole chemistry (Erdmann et al., 2014; Kiss et al., 2014) (Fig. 3). For the low-Al (Al2O3<8 277
wt%) amphiboles, we used the geobarometry as proposed by Mutch et al. (2016) along with the 278
thermometer of Holland and Blundy (1994). Such amphiboles are often coexistent with plagioclase,
279
K-feldspar, quartz, biotite, apatite and Fe-Ti oxides in the dome rocks (Kiss et al., 2014), a requisite 280
for application of this barometry. On the other hand, the Ridolfi and Renzulli (2012)’s
281
thermobarometric calculation was used with the modification as suggested by Gorini et al. (2018)
282
for the high-Al (Al2O3>10 wt%) amphiboles. 283
Based on the methodology described above, we obtained temperatures above 900°C and pressure 284
from 230 to 420 MPa for the high-Al amphiboles. The low-Al amphiboles yield temperature between 285
720°C and 780°C and a pressure between 210 and 280 MPa. Noteworthy, we obtained a lower 286
temperature of 715 +/- 20°C using low-Al amphibole and plagioclase pair thermometry (Holland and 287
Blundy, 1994) for felsic clots found in lava dome rocks (Kiss et al., 2014). This is consistent with a 288
crystal mush condition with more evolved melt (represented by interstitial glasses in felsic crystal 289
clots and glass inclusions in plagioclase phenocrysts) residing at near-solidus, low-temperature 290
environment (Appendix B). The intermediate amphiboles could have crystallized at similar pressure 291
as the low-Al amphiboles, but at higher temperature (and from a slightly more mafic melt); 292
plagioclase coexisting with intermediate-Al amphibole and Fe-Ti oxide thermometry (Appendix C) 293
provide crystallization temperature of 815 +/- 20°C. We note that despite large uncertainties in the 294
accuracy of most of these thermobarometers, this is a conservative estimate. We use the 295
temperature conditions of the low Al and intermediate amphibole populations (715 and 815°C 296
respectively) to determine the water content in the melt at depth. 297
3.3. Determination of water concentration
299
Using the pre-eruption thermobarometric results, the water content of the melt was estimated 300
using the plagioclase-liquid hygrometer as calibrated by Waters and Lange (2015). Plagioclase 301
phenocrysts have fairly homogeneous composition in the studied Ciomadul dacite (An = 40-50 302
mol%; Appendix D), irrespective of their textural occurrence. Such variation in plagioclase 303
composition has a poor effect on the water content calculation (+/- 0.1 wt.%; Table 2). Similarly, the 304
pressure variation determined from petrological data (200 to 500 MPa) has a direct effect on the 305
water saturation but no significant influence on the calculated water content (+/- 0.1 wt.%; Table 306
2), whereas the temperature affects it by +/- 0.5 wt.% (Table 2; Fig. 4; Appendix E). Plagioclase 307
coexisting with intermediate-Al amphibole crystallized prior to eruption under relatively elevated 308
storage temperature (815 +/- 20°C) yields melt water contents ranging from about 4.7 to 6.3 wt% 309
assuming melt composition represented by the interstitial glass in amphibole clot and amphibole 310
glass inclusions. (Table 2; Fig. 4; Appendix E). At low temperature (i.e., ~715 +/- 20°C), the 311
crystallization of An40-50 plagioclase requires water content between 7.7 and 9.0 wt.%, when using
312
the same melt composition (Appendix A and E). However, for such near-solidus, low-temperature 313
condition, we anticipate a more evolved melt such as shown by interstitial glasses in felsic crystal 314
clots of the lava dome rocks, groundmass and glass inclusions in plagioclase from the pumiceous 315
dacite. Using the composition of the interstitial glass in felsic crystal clots, representative of a felsic 316
mush, we deduce a conservative melt water content ranging between 6.0 and 7.7 wt% (Table 2; Fig. 317
4; Appendix A and E). 318
Parameter: Temperature T Pressure P XAn in Plag melt compo (wt.% SiO2)*
XH2O in melt (wt.%)
Melt EC
(Log scale) Melt fraction
Methods: Amphibole + Fe-Ti oxyde thermobarometry thermobarometry + geophysics Microprobe analysis Microprobe analysis Plag-liq
hygrometer in situ exp.
Petrology + EC + geophysics**
COLD preferred values 715°C 400 Mpa 0.45 74.5 7.0 -0.04 0.42 +/-0.05
T-XH2O trade-off +/- 20°C 6.4 - 7.4 -0.21 to 0.09 0.28 - 0.54
P-XH2O trade-off 250 - 500 Mpa 6.9 - 7.0 -0.08 to -0.01 0.35 - 0.48
XAn-XH2O trade-off 0.40 - 0.50 6.9 - 7.0 -0.06 to -0.04 0.37 - 0.47
Cumulated uncertainties +/- 20°C 250 - 500 Mpa 0.40 - 0.50 73.3 - 75.9 6.0 - 7.7 -0.30 to 0.17 0.25 - 0.58
WARM preferred values 815°C 400 Mpa 0.45 69.9 5.6 0.02 0.35 +/-0.04
T-XH2O trade-off +/- 20°C 5.1 - 6.1 -0.12 to 0.16 0.24 - 0.51
P-XH2O trade-off 250 - 500 Mpa 5.5 - 5.6 -0.01 to 0.05 0.30 - 0.43
XAn-XH2O trade-off 0.40 - 0.50 5.5 - 5.6 0.01 to 0.02 0.32 - 0.41
Melt compo-XH2O trade-off 68.6 - 71.0 5.3 - 5.7 -0.03 to 0.04 0.31 - 0.44
Cumulated uncertainties +/- 20°C 250 - 500 Mpa 0.40 - 0.50 68.6 - 71.0 4.7 - 6.3 -0.16 to 0.22 0.20 - 0.53 Table 2: conservative determination of the melt fraction in Ciomadul magmatic reservoir
319
The “preferred values” are taken from the mean of the range of each parameter while the “cumulated uncertainties”
320
correspond to the conservative water concentration and melt fraction estimations by cumulating uncertainties. *Melt
321
composition from natural sample to assess the water content with hygrometer of Waters and Lange (2015). In the Table
322
is presented SiO2 variation only. **Considering the uncertainty +/- 0.05 log unit on the electrical anomaly and using melt
323
composition of the Ciomadul dacite. Abbrev.: Xan: Anorthite content in plagioclase; melt compo: chemical composition
324
of the melt used in the hygrometer model; XH2O: water concentration obtained by hygrometer of Waters and Lange
325
(2015) EC: electrical conductivity.
326 327
328
Figure 4: Water concentration dissolved in the melt vs. pressure estimated by the plagioclase-liquid hygrometer of 329
Waters & Lange (2015) for the “warm” and “cold” scenarios using amphibole glass inclusion and interstitial glass in
330
amphibole clots, and the average glass composition from felsic clots, groundmass and glass inclusions in plagioclase
331
respectively (Appendixes B and E). The depth of Ciomadul potential magma reservoir determined from MT observation
332
and petrological constraints is also reported, as well as the water saturation pressure in dacitic melt (Prouteau and
333
Scaillet, 2003). Among variable parameters, the temperature is the most influent on the water content as shown by the
334
thick curves with labeled temperature. Propagation of uncertainties in water content due to minor variations in
335
anorthite content (An40 to An50) and melt composition is revealed by half-transparent curves and the double arrow.
336 337
3.4. Thermal evolution of melt-bearing bodies beneath Ciomadul
338
Our numerical results are shown in Fig. 5. The evolution of the amount of magma through time is 339
presented from the initiation of intrusions in the upper crust, 500 kyr ago, to 300 kyr in the future 340
(Fig. 5A): numerical simulations show that existence of magma with high melt fraction (over 50%) is 341
unlikely. However, magma with 10 to 30% of melt may be relatively abundant, from about 16 to 40 342
km3. The calculated thermal state of the upper crustal magma storage is consistent with petrological 343
results and thermal calculations show that current temperature at the centre of the mush body still 344
reaches 700-750°C, allowing, locally, melt fractions up to 40% (Fig. 5B & C). These local high melt 345
fractions do not concentrate but are instead discretely distributed (Fig. 5 C). 346
347
In order to quantify the cooling timescale of the magma body, we simulated the system until it cools 348
down below its solidus under two cases. The first one implies intrusions from -500 to -32 kyr (Fig. 349
5A). To compare, the second case simulate intrusion from -500 to 0 kyr (i.e. till today). In both cases, 350
where we simulated different conditions (continuous intrusions vs. no intrusions) over the last 30 351
kyr, we do not observe significant differences in the temperature profile, the cooling timescale or 352
in the average melt fraction of the magma body because latent-heat buffering at high crystallinity 353
(near-eutectic conditions) maintain the system above the solidus for extended periods of time 354
(Huber et al., 2009). 355
357
Figure 5: Melt and temperature in the upper crustal magma system. (A) The upper crustal magma body grows with 358
incremental and stochastic intrusions of magma over 470 kyr, until the last 32 ka eruption of Ciomadul. The cooling
359
timescale is simulated by stopping magma emplacement at 470 kyr (marked as “last intrusion event”) and quantifying
360
the volume of magma in the reservoir over time until the entire system reaches solidus. Each broken lines shows the
361
predicted volume of magma with a certain melt fraction indicated in legend. For instance, today, numerical simulations predict about
362
100 km3 of magma above the solidus (melt fraction > 0), and about 20 km3 of magma with more than 20% of melt. (B) Temperature
363
profile after 500 kyr (today) in the upper magma body from numerical simulation. (C) Current melt fraction distribution
364
from numerical simulation.
365 366
3.5. Laboratory-based determination of the dacite electrical conductivity
367
To verify the relevance of the thermal evolution of Ciomadul’s magmatic system determined by 368
model calculation, we measured in situ the electrical conductivity of the dacite from the 32 ka 369
Ciomadul eruption that we compare with the magnetotelluric observations of Ciomadul’s 370
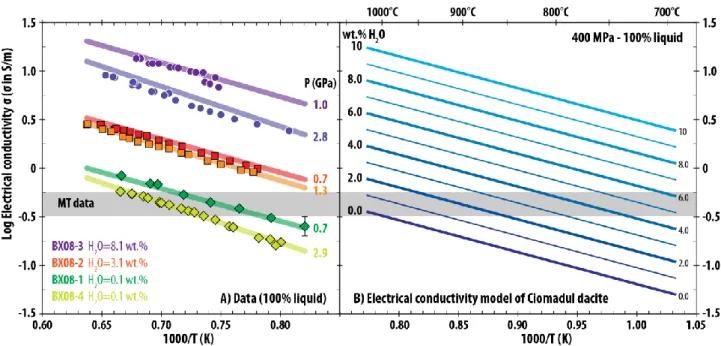
underground (Harangi et al., 2015b). Run conditions include pressures from 0.7 to 2.9 GPa, water 371
contents from 0 to 8.1 wt.% and temperatures up to 1300°C, largely covering conditions 372
encountered in the crust (Table 2). The results show a positive correlation of the electrical 373
conductivity with temperature and water content, and a negative correlation with pressure typical 374
of intermediate to felsic silicate melts (Fig. 6A). Contrary to the results found on the low Na-content 375
(2.1 wt.%) dacite from Uturuncu volcano (Laumonier et al., 2015), both activation energy and 376
volume activation are constant here, and the effect of water on the electrical conductivity 377
essentially reflects the evolution of the Arrhenius pre-exponential factor. The remaining variable 378
affecting the electrical conductivity imaged by geophysical surveys is thus the melt fraction (Φm), 379
which is discussed below (section 4.3). 380 381 Exp # duration (h:mm) H2O (wt.%) Pressure (GPa) Temperature range (°C) Activation energy (J) Preexponential factor (S/m) BX08-1 1:05 0.1 0.7 281 65807 164 BX08-2 1:51 3.1 1.3 230 66815 526 3.1 0.7 280 67617 491 BX08-3 2:13 8.1 2.8 178 76417 3639 8.1 1.1 130 66198 3021 BX08-4 0:55 0.1 2.9 247 79228 347
Table 3: Sum up of experimental conditions: duration, water content and pressure of each run as well as the 382
temperature range used for the determination of the activation energy and pre exponential factor based on equation
383
1.
384 385
386
Figure 6: Electrical conductivity data and model of the Ciomadul dacitic liquid. (A) Reciprocal temperature vs. 387
electrical conductivity (log scale) of the Ciomadul dacite at different water contents and pressures. Symbols are the
388
experimental data and compared with the general model calculated for the same conditions as each data set. The
389
grey area labeled “MT data” corresponds to the geophysical electrical conductivity anomaly identified by (Harangi et
al., 2015b). (B) Effect of water content, at a constant pressure of 400 MPa, on electrical conductivity of the Ciomadul
391
dacite liquid as a function of the reciprocal temperature.
392 393
4. Discussion
394
4.1. Magma storage conditions beneath Ciomadul
395
Figure 7 shows the interpretative anatomy of the Ciomadul plumbing systems based on the 396
petrology of the erupted products. The high-Al and high-Mg-pargasitic amphiboles are inferred to 397
derive from a relatively deep (300-550 MPa, i.e. 10-18 km depth) part of the upper crustal magma 398
storage at relatively high temperature (>900°C; Fig. 3 & 7), and were transported to the shallow 399
depth during recharge events. There are no quantitative petrologic constraints about deeper 400
crystallization conditions, i.e., above 550 MPa, although occurrence of Mg-rich minerals and crystal 401
clots involving olivine, clinopyroxene and orthopyroxene in the dome rocks suggests that less 402
differentiated basaltic magmas are also involved in the magma genesis (Kiss et al., 2014; Vinkler et 403
al., 2007). Such primitive phase assemblages could mirror magmatic processes at the crust-mantle 404
boundary or in the lower crust, akin to the MASH Zone of Hildreth and Moorbath (1988) or to the 405
hot zone of Annen et al. (2006). 406
The low-Al amphiboles (hornblendes) and plagioclases imply a relatively shallow (<300 MPa 407
pressure / 5-9 km depth), low-temperature (700-760°C) silicic mushy magma storage. The low 408
temperature conditions calculated from amphibole and plagioclase pairs are supported also by the 409
zircon and titanite temperature results, which give range from 660 to 730°C (using aTiO2 = 0.6 and
410
aSiO2 = 1 and the thermometers of Ferry and Watson (2007) and Watson et al. (2006), respectively).
411
Fragments of this near-solidus felsic crystal mush are represented by crystal clots with interstitial 412
evolved glass composition in the dome rocks. 413
The intermediate group of amphibole accompanied with plagioclase reveals similar depth as the 414
low-temperature hornblendes, but has higher crystallization temperature (815°C +/- 20). Textural 415
evidences suggest that this could represent conditions prior to the last eruption of Ciomadul. 416
Texture and the temperature of the Fe-Ti oxides imply that they could have re-equilibrated with the 417
low-T melt and their compositions preserved during the rapid magma ascent. Such features suggest 418
that within the felsic mush body, melt-rich zones with higher temperature existed, presumably after 419
recharge events potentially leading to the development of eruptible magma pockets. 420
421
Figure 7: Petrological and magnetotelluric inference for the transcrustal magma plumbing system beneath Ciomadul. 422
The presence for a lower crustal mafic magma storage is demonstrated by mafic crystal clots (4) found in erupted
423
products consisting of high-Mg olivine (Ol) and clinopyroxene (Px) and low resistivity anomaly at the periphery of the
424
upper crustal magma reservoir (see Fig. 8c in (Harangi et al., 2015b). Such mafic magmas differentiate and yield evolved
425
magmas that rise through the crust, and cool down to build up an upper crustal felsic magma reservoir. At this stage, it
426
is uncertain whether there is a continuous mushy magma storage between the lower and upper reservoirs. Locally, the
427
upper magma reservoir could contain relatively high melt fraction resulting in potential magma chambers that feed
428
volcanic eruptions. The cold mush state in the upper crustal reservoir is represented by felsic crystal clots (1) made of
429
plagioclase (Pl), quartz (Qz), K-feldspar (Kfsp), biotite (Bt) and accessory minerals as well as amphiboles (hornblende)
430
consistent with a temperature slightly above the solidus. Complex amphibole textures (2 and 3) indicate crystallization
431
at different temperature and pressure and mixing of magma batches with distinct compositions suggesting a polybaric
432
structure of the magma reservoir. The electrical anomaly identified by geophysical investigations is consistent with
433
petrological deductions for the upper crustal reservoir (Harangi et al., 2015b).
434 435
In summary, we infer a vertically extended (from ~5 km to ~18 km) felsic magma storage underlain 436
by a hot zone of mafic magma accumulation from the crust-mantle boundary (~40 km) up to ~30 437
km depth (Fig. 7). Mafic minerals such as olivines, clinopyroxenes and orthopyroxenes with high Mg-438
numbers (>0.85) call for the role of mafic recharge originating from deeper in the system (Fig. 7). 439
However, we lack so far of evidence that would constrain the connection of a potential lower crustal 440
mafic reservoir with the upper one (the latter being responsible for the observed electrical 441
conductivity anomaly). Magma batches from this root zone ascend to the upper part of the magma 442
storage and occasionally mix with the more evolved magmas. These fresh magmas locally heated 443
and partially melted the crystal assemblage and transported high-Al amphiboles (pargasites/Mg-444
hastingsites) formed at higher temperature (>900°C) and at greater depth into the shallow felsic 445
crystal mush zone. Following magma recharge, the magma condition stabilized at ~800°C, where the
446
rims of the amphiboles were formed and the Fe-Ti oxides re-equilibrated. This implies that before 447
the latest eruption, the magma storage was thermally heterogeneous, comprising both low- and 448
intermediate temperature zones that fed the eruption, as well as deeper high-temperature zones. 449
The upper part of the felsic crystal mush zone could have resided at relatively low temperature 450
(<750°C) for a prolonged (>>100 ka) period as shown by U-Th dates of zircons (Harangi et al., 2015a). 451
The depth range of the felsic upper crustal magma storage is consistent with the magnetotelluric 452
low-resistivity anomaly(Harangi et al., 2015b). Based on the monotonous chemical and petrologic 453
natures of Ciomadul dacites over the past 1 Myr (Molnár et al., 2018; 2019), one can expect similar 454
storage conditions over time. 455
456
4.2. Definition of an electrical conductivity model for the Ciomadul dacite
457
The electrical conductivity of the dacite melt follows the Arrhenius law: 458
𝜎𝑑𝑎𝑐𝑖𝑡𝑒= 𝜎0. 𝑒𝑥𝑝−(𝐸𝑎+𝑃∆𝑉) 𝑅𝑇⁄ (eq. 1) 459
where σ0 is a pre exponential factor (S.m-1), Ea the activation energy (J), P the pressure (bar), ΔV the 460
activation volume (cm3.mol-1), R the gas constant and T the temperature (K). σ
0 can be modelled by 461
4 parameters a to d in the equation established by Laumonier et al.(Laumonier et al., 2017b, 2015): 462
𝜎0 = exp {(𝑎𝑤 + 𝑏) + 𝑃 ∗ (𝑐𝑤 + 𝑑)} (eq. 2)
463 464
where w is the water concentration in wt.% and P is the pressure in bars. The fitting parameters are 465
a = 0.395 +/- 0.077; b = 4.65 +/- 0.26; c = -1.77E-06 +/- 3.04E-07 and d = 3.91E-05 +/- 1.24E-05.
466
Contrary to previous empirical model determined for intermediate magmas from Cerro Uturuncu, 467
(Laumonier et al., 2017b, 2015), activation energy and the activation volume were found to be 468
constant here (Ea = 60,000 +/- 3,000 J.mol-1; Δ𝑉 = 6.54 +/- 1.41 cm3.mol-1). The fitted values a to d, 469
Ea and Δ𝑉 returned a correlation coefficient of 0.99. The effect of temperature and water content 470
is illustrated at 400 MPa in Fig. 6B. 471
472
Under dry conditions, the activation energy of the Ciomadul dacitic melt (60 kJ) is lower than the 473
one of Uturuncu dacite (88 kJ), and better resembles the one of felsic compositions that contain 474
similar sodium content (e.g. rhyodacite(Tyburczy and Waff, 1985) with Ea = 59kJ; or a 475
rhyolite(Gaillard, 2004) Ea = 65kJ; Fig. 8). Based on the existent literature, the conductivity of dry 476
intermediate to felsic melts varies over 2 orders of magnitude whereas it extends over 0.5 log unit 477
under hydrous conditions (at 800°C, Fig. 8A). It positively correlates with temperature and water 478
content, and negatively with pressure as other intermediate to felsic silicate melts (Chen et al., 2018; 479
Gaillard, 2004; Guo et al., 2016; Laumonier et al., 2017b, 2015; Pommier et al., 2008; Tyburczy and 480
Waff, 1985)( Fig. 8). Plotted against the sodium content, the electrical conductivity of felsic dry melts 481
scatters while the one of hydrous melts defines a positive trend with increasing sodium content (Fig. 482
8B). In other words, the electrical conductivity of hydrous melts corresponding to a large number of 483
magma reservoirs in the upper to middle crust (100 and 500 MPa) strongly depends on the sodium 484
content. Therefore, we agree with the previous works concluding that sodium is the main charge 485
carrier and the key controller of the electrical behaviour of dacitic and felsic melts in general (Chen 486
et al., 2018; Gaillard, 2004; Gaillard and Marziano, 2005; Guo et al., 2016; Laumonier et al., 2015; 487
Pommier et al., 2008). 488
489
490
Figure 8: Comparison of calculated electrical conductivity of Ciomadul dacite with data from literature. (A) Electrical 491
conductivity (log scale) is plotted according to the reciprocal temperature of dry (P = 1 atm.) and hydrous (P = 500 MPa)
492
intermediate to felsic melts. Hydrous melts (dotted lines) and dry melts (continuous lines) respect the same color code
493
(Chen et al., 2018; Gaillard, 2004; Guo et al., 2016; Laumonier et al., 2017b, 2015; Pommier et al., 2008; Tyburczy and
494
Waff, 1985). (B) Electrical conductivity (log scale) at 800°C (symbols and thick curve) as a function of the sodium content
495
(same color legend as in A). The effect of temperature on the EC of the Ciomadul dacite is shown by the thin curves
496
labeled 700 and 900°C.
497 498
4.3. Determination of the melt fraction beneath Ciomadul
499
The numerical results predict the likely persistence of significant amounts of melt (up to ~40 %) 500
locally under the Ciomadul volcano and a cooling timescale of the present-day Ciomadul reservoir 501
of ~250 kyr (Fig. 5), a relatively long timescale even for a magmatic system of limited size. Such 502
prediction are confronted to the melt fraction determined from geophysical observations and the 503
electrical model: for both the relatively low-temperature crystal mush and warmer magma chamber 504
conditions, we calculated the melt fraction - water content pairs that solve the electrical 505
conductivity anomaly identified beneath Ciomadul volcano(Harangi et al., 2015b) (Log σ = -0.45). 506
The melt fraction of the magma was calculated using the modified Archie’s law(Glover et al., 2000) 507
with the electrical conductivity of the dacite determined here as conductive phase and the value 508
0.001 S.m-1 as the solid, resistive phase, corresponding to plagioclase, amphiboles or pyroxene 509
crystals(Maury, 1968) or warm silicate rocks(Hashim et al., 2013). The exponent m = 1.05 in the 510
modified Archie’s law was taken after Gaillard & Iacono-Marziano(Gaillard and Marziano, 2005). 511
Due to the relatively large amount of melt (more than few percents), the conductivity of the solid 512
phase has no significant effect, the liquid conductivity being the determinant one(Laumonier et al., 513
2017a). 514
515
We find that the melt fraction ranges from ~0.20 to 0.58 (Fig. 9A). In detail, the melt fraction inferred 516
for both warm (0.35 ±0.04) and cold (0.42 ±0.05) scenarios explain the geophysical observations 517
(Table 2), highlighting the primary effect of water on the electrical conductivity of such a magmatic 518
system; both preeruptive and long-storage conditions produce similar electrical signatures. The 519
water content (6.0-7.7 wt.%) deduced for the low-temperature crystal mush is relatively close to 520
the water saturation pressure of dacitic melts (Prouteau and Scaillet, 2003) at the depth of the 521
geophysical anomaly; this is consistent and plausible in the case of a mushy magma that partially 522
crystallized and concentrated the water in the melt. Our melt fraction estimations would be 523
underestimated if CO2 were present, because CO2 decreases the amount of water in the volatile 524
phase, and thus indirectly the electrical conductivity (Iacono-Marziano et al., 2012; Ni et al., 2011). 525
If the residual liquid had, however, a rhyolitic rather than a dacitic composition, as deduced from 526
glasses in felsic crystal clots and glass inclusions hosted by minerals equilibrated at relatively shallow 527
conditions (715°C), then, it would impact on the estimation of the melt fraction using electrical 528
conductivity. These glasses have a peraluminous composition determined from the aluminum 529
saturation index (Appendix B), which is similar to the rhyolitic melts that were electrically 530
characterized by Chen et al.(Chen et al., 2018). Under similar conditions (400 MPa, 7.0 wt.% H2O),
531
the peraluminous rhyolite is as conductive as the dacite and the pervasive melt fraction would be 532
the same (0.34 to 0.44) to explain the geophysical anomaly (Log σ = -0.4 to -0.5; Fig. 9B). 533
534
535
Figure 9: Melt fraction beneath Ciomadul volcano. (A) The melt fraction and water content respecting the electrical 536
anomaly (Log electrical conductivity -0.45) observed by magnetotelluric survey (Harangi et al., 2015b) for both reservoir
537
and mush cases. The curves are truncated according to the possible range of water content constrained by the petrology
of the Ciomadul dacite, providing the likely range of melt fraction in the upper crust reservoir. Diamond symbols show
539
the “preferred values” presented in Table 2. The “eruptible magma” field corresponds to melt fraction higher than 0.45
540
resulting in remobilisable magma (Cooper & Kent, 2014). (B) Electrical conductivity vs. melt fraction of the Ciomadul
541
dacite and a peraluminous rhyolite (Chen et al., 2018) similar to the glass observed in Ciomadul felsic crystal clots.
542 543
Melt fractions deduced from numerical simulations are lower than the values determined from 544
electrical conductivity measurements: the calculated average melt fraction (0.14) of the magma 545
body corresponds to electrical conductivities about Log -0.6. Such average melt fraction pervasively 546
distributed cannot explain the current electrical anomaly (Harangi et al., 2015b). However, the 547
heterogeneous melt distribution predicted by the numerical model (Fig. 5) with regions with higher 548
melt fraction (up to 0.40) distributed in the magma body is a plausible explanation for the electrical 549
anomaly as deduced experimentally. Whatever the configuration, both numerical and experimental 550
approaches consistently show that a reservoir with significant content of hydrous melt could still 551
exist beneath Ciomadul volcano, despite its long dormancy and its moderate reservoir size. 552
553
4.4. Extinct, long-dormant and potentially active volcanoes
554
By combining petrologic observations, geophysical results, experimental conductivity data of its last 555
volcanic products and thermal modelling for the development of its magma storage, we are able to 556
decipher the present-day nature of the subvolcanic magmatic plumbing system beneath the long-557
dormant Ciomadul volcano. Although it is generally considered as extinct (last eruption is ca. 30 ka), 558
the significant average melt fraction determined in the upper crustal magma storage makes the 559
volcano still potentially active. This conclusion is supported also by CO2 degassing (over 10,000 560
tonnes/year emission flux) with isotopic composition implying a strong magmatic component (Kis 561
et al., 2019). Based on magnetotelluric reconstruction (Harangi et al., 2015b) of the current upper 562
crustal magma reservoir, the thermal evolution of the system and experimental constraints from 563
electrical conductivity measurements, the total volume of the upper crustal melt-bearing mush 564
beneath Ciomadul nowadays could be of the order of 100 km3, with a melt volume from ~15 up to 565
58 km3 based on numerical and experimental determinations. Such volume exceeds the estimated
566
volume of magma involved during the development of the entire volcanic complex (Szakács et al., 567
2015) (8-14 km3), meaning that most of magma transferred to the upper crust has not erupted. The
568
likely persistence of melt and the existence of local high melt fractions within a relatively cold mush 569
support the theory of magma storage for prolonged (> 10’s kyr) periods above the solidus 570
(Szymanowski et al., 2017) Such condition could characterize not only the active and potentially 571
active volcanoes, but also other seemingly inactive volcanoes, worldwide. 572
Although (1) a volcano is generally considered as extinct when its quiescence period exceeds 10 kyr 573
and (2) we cannot predict an upcoming eruption at Ciomadul, we show that determining the state 574
of a volcano and evaluating the associated potential hazard is critical, and must be performed 575
primarily by characterizing the nature of the subvolcanic magma storage condition. Ciomadul is not 576
a unique case; the development of remote observation techniques permits the detection of 577
geophysical anomalies beneath emblematic long-dormant volcanoes. The best example is the 578
Yellowstone, where the last eruption occurred 70 ka, yet it lies above a massive magma reservoir 579
with significant amount of melt (Huang et al., 2015). The Cerro Uturuncu in Bolivia erupted last time 580
270 ka (Sparks et al., 2008), but recent uplift and seismicity imply an active subvolcanic magma 581
storage, which was detected also by geophysical methods (Comeau et al., 2016). A slow 582
rejuvenation of the magma system beneath Colli Albani in Italy was also proposed(Iacono Marziano 583
et al., 2007), despite its last eruption occurred around 20-36 ka. The presence of significant melt 584
fraction beneath Ciomadul and other long-dormant volcanoes does not imply imminent eruption, 585
but shows that these volcanoes pose a potential and underrated threat to the population unaware 586
of the volcanic risk close by. The term, volcanoes with potential active magma storage (PAMS 587
volcano) could emphasize their importance. 588
5. Conclusions
590
With a multidisciplinary approach, we characterize the magmatic system of Ciomadul, a seemingly 591
inactive volcano at eastern-central Europe. Petrology and thermobarometry on amphiboles from a 592
32 ka lava dome dacite (one of the latest eruption products) reveals three main conditions of 593
crystallization: (1) low pressure and temperature (~715°C) corresponding to a mushy upper crust 594
reservoir, (2) relatively warm (>900°) and deep conditions that we attribute to the deeper part of 595
the mushy reservoir and (3) intermediate conditions (~815°C) typical of all amphibole rims that we 596
attribute to pre-eruptive conditions at the shallow level. This dominantly felsic upper crustal mushy 597
magma storage is underlain by a hot lower crustal zone with mafic magma accumulation. Such 598
features demonstrate the transcrustal magmatic system beneath Ciomadul and were used to run 599
numerical simulation about its the thermal evolution. The simulations predict the slow cooling of 600
the upper reservoir and the persistence of at least 15% of melt (locally reaching up to 40%). We 601
finally tested these predictions by performing experiments on the dacite with in situ electrical 602
conductivity measurements. We find that the geophysical anomaly identified beneath Ciomadul can 603
be explained by an upper crustal magma reservoir, which contains between 20 and 58% of nearly 604
water-saturated dacitic to rhyolitic melt. Such thermal evolution and presence of melt is consistent 605
with a magma storage existing for a protracted time (around 350 kyr; (Harangi et al., 2015a) and 606
supports the hypothesis of long-lasting, persistent magma storage above the solidus (Szymanowski 607
et al., 2017). From experiments and thermal calculations, we demonstrate here that Ciomadul 608
magmatic system could locally contain significant amount of melt with relative fraction close to the 609
eruptible state in some regions. Such magma storage conditions can exist even beneath relatively 610
small volcanic complexes. As long as melt-bearing magma body can be inferred beneath such long-611
dormant volcanoes, the potential for rejuvenation exists, irrespective of the length of its quiescence 612
time and this calls for more attention to apparently inactive PAMS volcanoes. 613
Acknowledgements
615
This project was supported by ERC #279790 and ANR #2010 BLAN62101 projects attributed to FG; 616
OTKA-NKFIH K116528 (SH) and NKFIH PD 121048 (RL) research grants. OK and OB acknowledge the 617
support from SNF Grant #200021_178928. ML acknowledges the French Government Laboratory of 618
Excellence initiative (ClerVolc contribution number 341). IS benefited by a grant of the Ministry of 619
Research and Innovation, CNCS-UEFISCDI, project PN-III-P4-ID-PCCF-2016-0014, within PNCDI III. 620
We thank C. Miller and M. Petrelli for their reviews that greatly clarified the paper. 621
622
References
623
Anderson, J.L., Barth, A.P., Wooden, J.L., Mazdab, F., 2008. Thermometers and thermobarometers 624
in granitic systems. Rev. Mineral. Geochemistry 69, 121–142. 625
Annen, C., Blundy, J.D., Sparks, R.S.J., 2006. The genesis of intermediate and silicic magmas in deep 626
crustal hot zones. J. Petrol. 47, 505–539. https://doi.org/10.1093/petrology/egi084 627
Bachmann, O., 2010. The petrologic evolution and pre-eruptive conditions of the rhyolitic Kos 628
Plateau Tuff (Aegean arc). Open Geosci. 2, 270–305. 629
Bachmann, O., Huber, C., 2016. Silicic magma reservoirs in the Earth’s crust. Am. Mineral. 101, 630
2377–2404. 631
Barboni, M., Boehnke, P., Schmitt, A.K., Harrison, T.M., Shane, P., Bouvier, A.-S., Baumgartner, L., 632
2016. Warm storage for arc magmas. Proc. Natl. Acad. Sci. 113, 13959–13964. 633
Bedrosian, P.A., 2007. MT+, integrating magnetotellurics to determine earth structure, physical 634
state, and processes. Surv. Geophys. 28, 121–167. 635
Carrigan, C.R., 1988. Biot number and thermos bottle effect: Implications for magma-chamber 636
convection. Geology 16, 771–774. 637
Cashman, K. V, Sparks, R.S.J., Blundy, J.D., 2017. Vertically extensive and unstable magmatic 638
systems: a unified view of igneous processes. Science (80-. ). 355, eaag3055. 639
Chen, J., Gaillard, F., Villaros, A., Yang, X., Laumonier, M., Jolivet, L., Unsworth, M., Hashim, L., 640
Scaillet, B., Richard, G., 2018. Melting conditions in the modern Tibetan crust since the 641
Miocene. Nat. Commun. 9. https://doi.org/10.1038/s41467-018-05934-7 642
Christopher, T.E., Blundy, J., Cashman, K., Cole, P., Edmonds, M., Smith, P.J., Sparks, R.S.J., Stinton, 643
A., 2015. Crustal‐scale degassing due to magma system destabilization and magma‐gas 644
decoupling at Soufrière Hills Volcano, Montserrat. Geochemistry, Geophys. Geosystems 16, 645
2797–2811. 646
Comeau, M.J., Unsworth, M.J., Cordell, D., 2016. New constraints on the magma distribution and 647
composition beneath Volcán Uturuncu and the southern Bolivian Altiplano from 648
magnetotelluric data. Geosphere 12, 1391–1421. 649
Cooper, K.M., 2019. Time scales and temperatures of crystal storage in magma reservoirs: 650
implications for magma reservoir dynamics. Philos. Trans. R. Soc. A 377, 20180009. 651
Cooper, K.M., 2015. Timescales of crustal magma reservoir processes: insights from U-series 652
crystal ages. Geol. Soc. London, Spec. Publ. 422, SP422-7. 653
Costa, F., 2008. Residence times of silicic magmas associated with calderas. Dev. Volcanol. 10, 1– 654
55. 655
Dufek, J., Bachmann, O., 2010. Quantum magmatism: Magmatic compositional gaps generated by 656