HAL Id: hal-01565292
https://hal.archives-ouvertes.fr/hal-01565292
Submitted on 21 Jul 2017HAL is a multi-disciplinary open access
archive for the deposit and dissemination of sci-entific research documents, whether they are pub-lished or not. The documents may come from teaching and research institutions in France or abroad, or from public or private research centers.
L’archive ouverte pluridisciplinaire HAL, est destinée au dépôt et à la diffusion de documents scientifiques de niveau recherche, publiés ou non, émanant des établissements d’enseignement et de recherche français ou étrangers, des laboratoires publics ou privés.
Yielding of complex liquid foams
François Gorlier, Yacine Khidas, Olivier Pitois
To cite this version:
François Gorlier, Yacine Khidas, Olivier Pitois. Yielding of complex liquid foams. Journal of Rheology, American Institute of Physics, 2017, 61 (5), pp.919-930. �10.1122/1.4994786�. �hal-01565292�
1
Yielding of complex liquid foams
F. Gorlier1, Y. Khidas2 and O. Pitois1
1
Université Paris Est, Laboratoire Navier, UMR 8205 CNRS – École des Ponts ParisTech – IFSTTAR cité Descartes, 2 allée Kepler, 77420 Champs-sur-Marne, France.
[email protected] ; [email protected]
2 Université Paris Est, Laboratoire Navier, UMR 8205 CNRS – École des Ponts ParisTech – IFSTTAR
5 bd Descartes, 77454 Marne-la-Vallée Cedex 2, France.
Abstract:
Foamy complex matter is increasingly encountered in various application fields. Whereas final functional properties of hardened foams have been widely investigated, rheology of complex foamy materials has received less attention. Here we consider two different types of complex matter to be mixed with aqueous foam and we investigate the resulting yield stress, which is known to control both static and flow properties of foams: (1) a concentrated emulsion possessing intrinsic yield stress properties, and (2) granular suspensions which are known to exhibit particle size effects when incorporated into foam. Yield stress of emulsion foams is found to be governed by both the Bingham-capillary number (i.e. the emulsion yield stress scaled by the bubble Bingham-capillary pressure), and the volume fraction of interstitial emulsion. Foams made with small solid particles reveal granular packings confined between foam bubbles and the resulting yield stress is shown also to be governed by the Bingham-capillary number, here based on Mohr-Coulomb criterion applied to the interstitial granular material. Yield stress of foams made with large particles is well-described by theory developed from micro-mechanics of particle-loaded yield stress materials, suggesting that for such size ratios, foam can be considered as a continuous matrix. Within the range of intermediate size ratio values the normalized foam yield stress undergoes an exponential decay that seems to be related to the number of bubbles separating neighboring particles. Finally, reported results are used to estimate the thicknesses of foamed material, such as isolating foamed mortars for example, that can be deposited on vertical substrates.
2
1. Introduction
Aerated materials are widely encountered as products from various industries. Polymer foams, such as polystyrene or polyurethane foams, are emblematic examples showing unique properties that have been proved to be useful for numerous applications. In the context of construction materials, cement foam exemplifies very well the optimization work that must be performed for reconciling lightness and mechanical strength [1]. Whereas final functional properties of those foams have been widely investigated in relation with the microstructure arising from the organization of bubbles and solid matrix in the material [2], rheology of fresh foamy materials has received less attention, except for the case of simple aqueous foams [3]. However, development of new aerated materials involves mixing aqueous foam with intrinsically complex matter. Numerous examples are found in various application fields, such as foods, paints, cosmetics and construction materials: whipped creams [4], aerated slurries such as cement [1], geopolymer [5] or plaster [6] fresh pastes, colloidal suspension foams [7–13], granular suspension foams [14–21], emulsion foams [22–28]. In fact, little is known about rheology of complex liquid foams while such knowledge is crucial for applications. Yield stress properties allow the material to sustain external forces and to keep its initial shape under gravity [25,27,29]. For example, the thickness of a material layer that can be deposited on vertical substrates is directly related to the material yield stress and effective material density. Obviously, taking advantage of such interesting mechanical properties requires understanding the yield stress of foamy materials. This is also the case for filling of molds, for example, where appropriate workability is needed. The control of this process requires to understand the rheology of those fresh foamy materials, starting from the yield stress value which is known to govern foam flows at small and moderate shear rates [3].
Recent findings have considerably increased our knowledge on elasticity of complex foams. Cohen-Addad et al. [18] have shown that adding a tiny amount of non-colloidal particles in aqueous foams can enhance drastically their elastic modulus. Gorlier et al. [21,20] have revealed the existence of a critical particle-to-bubble size ratio triggering a sharp transition between two well-defined elastic regimes: for small size ratios, the behavior is governed by the mechanical properties of the solid grains, which have been proved to pack in the shape of a foam-embedded granular skeleton. In contrast, bubbles elasticity prevails in the second regime, where isolated large particles contribute only weakly to the rheological behavior of the foamed material. Gorlier et al. [28] have shown that
3 the elastic modulus of emulsion foams is governed by two parameters, namely the gas volume fraction and the elasto-capillary number, defined as the ratio of the emulsion elastic modulus with the bubble capillary pressure. In this paper we investigate the yield stress properties of complex foams. We consider two different types of complex matter to be mixed with aqueous foam: (1) a concentrated emulsion possessing intrinsic yield stress properties, and (2) granular suspensions which are known to exhibit particle size effects when incorporated into foam. As shown in the following, although different by nature, results obtained for those two systems allow drawing some general rheological behavior for complex liquid foams.
2. Materials and methods
Complex foams are prepared by mixing precursor aqueous foam and complex fluid, i.e. concentrated emulsion or granular suspension.
Fig. 1: Elaboration of complex liquid foams. (a) Precursor aqueous foam is generated and stabilized in a glass column. (b) Then foam is pushed toward a device where it is mixed with concentrated emulsion or granular suspension. Note that the mixed emulsion results from the dilution of a mother emulsion with (foaming) solution. Controlling the entry flow rates allows tuning the volume fractions of constituents in the produced foam. (c) Image of emulsion foam. (d) Magnification on the structure of emulsion foams showing the ‘granular’ aspect of Plateau borders due to interstitial emulsion. Note that foam films are transparent and do not contain emulsion droplets. (e) Image of a foam made with
4 granular suspension. (f-j) Images showing the geometrical configuration of solid particles incorporated into liquid foams (the length scale is given by the particle size): 20 µm (f), 80 µm (g),
140 µm (h), 500 µm (i), 3200 µm (j).
a) Preparation of precursor foams
Precursor foams are aqueous foams with well-controlled bubble size and gas volume fraction. Foaming liquid (distilled water 70% w/w, glycerol 30% w/w, and tetradecyltrimethylamonium bromide (TTAB) at a concentration 5 g.L-1) and perfluorohexane-saturated nitrogen are pushed through a T-junction allowing to control the bubble size by adjusting the flow rate of each fluid (see figure 1a). Several bubble sizes were obtained within the range 150-400 µm, with a polydispersity Δ ⁄ ≈ ± 5%. Produced bubbles are collected in a glass column and gas fraction is set to an approximately constant value over the foam column by imbibition from the top with foaming solution (see figure A1). As shown in the following, producing emulsion foams requires to be known as accurately as possible. From careful work on the reproducibility of foaming and drainage conditions in the column, we were able to define a target value ± ∆ with ∆ = 0.001 and ranging from 0.985 to 0.995 (see Appendix A).
b) Granular suspensions
We prepared suspensions of polystyrene beads, with particle volume fraction chosen within the range = 0.05-0.55 and a monodisperse particle size ∈ [10, 20, 40, 80, 140, 250, 500] µm. Note that foam and suspension share the same continuous phase, which is composed of distilled water 70% w/w and glycerol 30% w/w, and TTAB at a concentration 5 g.L-1. Shear viscosity and density of that solution have been measured to be equal to 1.7 mPa.s and 1050 kg.m-3 respectively. The surface tension of the solution in contact with air has been measured to be equal to 38 mN.m-1. The density of polystyrene beads is 1050 kg.m-3 so the latter are not subjected to sedimentation in
the suspending liquid.
Additional experiments were performed with glass particles of diameter = 3200 µm. In such cases, the dry particles were spread by hand in foam. Note that for such a case, the particle size corresponds to almost ten bubbles.
5
c) Concentrated emulsions
We use a concentrated oil-in-water mother emulsion which has been produced in advance using a Couette emulsifier. The oil is a silicon oil (V350, Chimie Plus) and the continuous phase is almost the same as for the precursor foam: distilled water 50% w/w, glycerol 50% w/w, and TTAB at a concentration 30 g.L-1). The oil volume fraction is = 0.85 and the radius of the oil droplets measured by laser granulometry is around 1 to 2 µm (the polydispersity is around 20%). Note also that the oil/water/surfactant system chosen for this study is known to produce very stable mixtures of foam and emulsion [23,25–27].
Fig. 2: (a) Typical flow curve obtained at a small shear rate ( = 10-3 s-1) for concentrated oil-in-water emulsion. After the elastic regime observed at small strain ( ≲ 10%), the material yields and the
shear stress reaches the stationary value corresponding to the yield stress, . (b) Oil-in-water emulsions we used are characterized by a clear relation between shear yield stress and oil volume fraction . Such a relation, which can be described by = , is used to
control the yield stress of the interstitial emulsion through tuning of its oil concentration. Typical values for and are 2000 Pa and 0.63 respectively.
6
d) Mixing
Precursor foam and emulsion/suspension are mixed in a continuous process thanks to a mixing device based on the flow-focusing method (see figure 1). The mixing device allows tuning the flow rates of both the foam ( ∗!) and the emulsion/suspension ( ), as well as introducing additional foaming solution (at a flow rate #) in order to dilute the mother emulsion. This allows tuning the volume fractions of gas and oil or particles in the produced complex foam:
∗= ! ∗ $ + ! ∗ + #&
⁄ and ∗ = '$ + ∗!+ #& or ∗= '$ + ∗!+ #& respectively. Note that bubble size of the precursor foam is conserved during the mixing step.
For emulsions, the efficiency of the in-line dilution process has been checked separately by measuring the yield stress of resulting diluted emulsions as a function of oil volume fraction . In fact we prepared three mother emulsions, and for each one the curve was determined. Typical example is plotted in figure 2b, showing that curves can be described by the relationship = , where and are close to 2000 Pa and 0.63, respectively, which is fully consistent with previous classical results [30]. The device produces emulsion foams with target values for gas volume fraction, ∗, and oil volume fraction, ∗ . According to the parameters defined above, the yield stress of the interstitial material is ∗ = ∗ , where
∗ = ∗ ⁄ 1 ∗ = $ + 1
! ∗ +
#&
' is the oil volume fraction in the interstitial volume of the foam (between the bubbles). Note that during the dilution/mixing step, liquid flow rates and # are imposed, but the flow rate ∗! is subjected to gas compressibility effects. In order to evaluate and to account for such induced deviations with respect to target values, we measured the actual value of the gas volume fraction in emulsion foams, = 1 ( 〈(⁄ *+〉, where ( is the density of the sample deduced from weight measurements, and 〈(*+〉 = 1.005 is the median value of density for the mixed emulsions (densities of oil and water/glycerol solutions are 0.97 and 1.13 (for 50/50) or 1.08 (for 70/30) respectively). From we determine the actual value !=
+ # ⁄ , as well as the resulting oil volume fraction
= '$ + 1 !+ #&. Following such a method induced the following maximum
relative errors: Δ ⁄ ≈ ± 3%, Δτ ⁄τ ≈ Δτ τ⁄ ≈ 20% and Δ ⁄ ≈ ± 1%. Four bubble sizes were chosen: = 150, 270, 300 and 400 µm. Note that emulsion foams were not subjected to drainage when poured in the rheometry cell.
In contrast, particle-loaded foams were found to drain: both liquid and particles can flow down through the bubble assembly. It has been shown in a previous work[17] that this flow, as well as the
7 final equilibrium state, i.e. the final gas fraction and the final particle volume fraction , are governed by the initial gas fraction ∗, the particle-to-bubble size ratio ⁄ and the initial particle ./ volume fraction within the interstitial suspension ∗= ∗⁄ 1 ∗ . Therefore, for each particle size, a significant number of samples with different parameters ∗ and ∗ have been prepared in order to obtain drained samples with different parameters and . Note that due to limitations of the generation method we were not able to produce the most concentrated systems for all the particle sizes. Parameters and are measured thanks to a second cell (height = 7 cm and diameter = 26mm) also filled during the generation step. The bottom of this cell is a piston allowing for the particle-loaded foam to be partially pushed out after drainage. This setup allows sampling the foam along its height and the particle fraction profile is measured as follows: each sampled volume is first weighed and then rinsed several times with ethanol in order to break the foam and to remove glycerol (each time centrifugation is performed for separating the particles from the liquid). Finally, the collected particle/ethanol mixture is let for drying (twelve hours at 60°C) and the resulting dried particles are weighed. For all the particle sizes, vertical profiles for particle volume fraction showed very good homogeneity of the samples for high particle loadings, i.e. 〈 〉 ≥ 0.02. For 〈 〉 ≤ 0.01, very good homogeneity was obtained for the large particle sizes, i.e. ≥ 40 µm, and samples with smaller particle sizes showed reasonable homogeneity, i.e. 0.7 ≤ Δ ⁄〈 〉≤ 1.3. Such a behavior can be explained by the effect of initial particle concentration on drainage [17]. For high concentration, particles are trapped by collective jamming, i.e., channel size is larger than particle size. This situation promotes uniform concentration profile. For low concentration, collective jamming if rather ineffective and particle trapping is mainly due to individual captures, i.e., channel size is equal to particle size. For such cases, the quantity of trapped particles is strongly related to channel size at equilibrium, which is known to increase near the bottom: capture is less effective in those areas. Note that for granular suspension foams, only one bubble size was chosen: = 225 µm. In order to investigate systems characterized by larger particle-to-bubble size ratio, we turn to another approach for making foams loaded with glass particles of diameter = 3200 µm. Precursor foam is continuously poured into the rheometry cell and the dry particles are spread by hand during the filling process, ensuring homogeneity as far as possible. Note that (1) the significant yield stress of the precursor foam (≈ 10 Pa) prevented particles settling; (2) the yield stress of the precursor foam, i.e. , will be used as the reference yield stress for nondimensionalization purpose with this system. We focused on systems with particle volume fractions equal to 0.025 and 0.05.
Images of foams made with emulsion or granular suspension are presented in figure 1. Interstitial emulsion can be considered as a continuous material, whereas the smallest solid grains are distinguished at the scale of the interstitial network. Note that the particles are homogeneously
8 distributed within the foam network (figure 1e). Larger particles are trapped at the nodes formed by the foam network, and the largest particles seem to be embedded in aqueous foam. Note that emulsion, as well as particles, are contained in the Plateau border network, not in the thin foam films.
e) Rheometry
Produced foams are continuously poured into the measurement cell (cup geometry: height = 7 cm and diameter = 37mm). After this filling step, a six-bladed vane tool (height = 6 cm and diameter = 25mm) is inserted into the foam cell.
For emulsion foams, the measurement procedure starts just after the filling step (Malvern kinexus ultra+): the static yield stress is measured by initiating flow from rest at a small and constant imposed shear rate = 10-3 s-1 (figure 2a). From preliminary experiments, we have concluded that this shear rate is optimal: (1) it allows for the yield stress to be measured within acceptable time duration; (2) reducing the shear rate to = 10-4 s-1 does not induce significant change in the yield
stress value, which means that one can consider that reported values correspond to quasi-static conditions.
As particle-loaded foams drain, the measurement procedure is delayed in order to study only fully drained samples. The evolution of the sample is followed by measuring the shear elastic modulus through oscillatory rheometry with a strain of 10-3 at 1Hz. After a transient regime, all
samples were found to reach a constant value of the shear modulus [20]. Therefore, rheology measurement starts only from that time, following a procedure similar as the one described for emulsion foams.
Note that (i) to avoid slippage on the cell wall as the shear stress is applied, the cell surface has been striated to jam the bubbles; (ii) the minimal gap in the vane-cup geometry represents more than 8 bubble diameters; (iii) the presence of perfluorohexane inside the bubbles strongly reduces the foam ripening rate [31], which allows aging effects to be ignored over the time scale of measurements.
3. Results
A first outlook of the rheological behavior of complex foams is presented in figure 3, showing typical examples for flow curves of aqueous foam, emulsion foam and granular foam. Yielding of aqueous foam occurs for significant shear strain, i.e. ≈ 0.4, following the elastic regime that
9 characterizes bubble assemblies. Emulsion foams show similar yielding behavior. Note that increasing the yield stress of the interstitial emulsion increases the yield stress of emulsion foams, all the other parameters being equal. Flow curves of foams made with granular suspensions are significantly influenced by particle size: decreasing the particle size increases the yield stress. Moreover, small particles (i.e. 20 µm) induce a drastic evolution of the flow curve with respect to foams loaded with larger particles: an overshoot appears at the onset of yielding and the yield strain decreases significantly.
Fig. 3: Flow curves obtained at a small shear rate ( = 10-3 s-1). (a) Drained aqueous foam ( = 150 µm, = *6≈ 0.97). (b) Emulsion foams for several values of , the yield stress of the
10 interstitial emulsion. Bubble size and gas volume fraction are set. (c) Foams made with granular
suspension for several values of particle size. Bubble size and particle volume fraction are set.
In figure 4, we show how the yield stress of emulsion foams evolves as one control parameter varies, the other parameters being fixed. is shown to increase as a function of , but the magnitude of the increase clearly depends on bubble size and gas volume fraction (figure 4a). The effect of bubble size is in qualitative agreement with behavior expected for aqueous foams: decreases as a function of (figure 4b). Note however that the relation ~ 8⁄ is not observed for emulsion foams, which suggests coupling effects between control parameters. This is observed in figure 4c also, where decreases as a function of gas fraction, which contrasts with the behavior of simple liquid foams [32].
11 Fig. 4: Yield stress of emulsion foams. (a) Yield stress as a function of , the yield stress of the interstitial emulsion, for two sets of parameters and . (b) Yield stress as a function of bubble size
for two sets of parameters and . Dashed line corresponds to the expected behavior for simple liquid foams, i.e. ∝ 8⁄ . (c) Yield stress as a function of gas volume fraction for two values of .
Dashed lines correspond to the expected behavior for simple liquid foams, i.e. ∝ . Thin lines are guides for the eyes.
Results for the yield stress of foams made with granular suspensions are presented in figure 5 as a function of gas volume fraction. The effect of particle size, i.e. increases as decreases, is observed for all the investigated gas volume fractions.
Fig. 5: Yield stress of foams made with granular suspension as a function of gas volume fraction, for several values of particle size. Bubble size is = 225 µm.
4. Discussion
In the following, we will consider the reduced yield stress $ &' 0 , where 0 is the yield stress of the corresponding aqueous foam, i.e. the foam with same bubble size and same gas volume fraction. The latter can be estimated by the following relationship[32]: 0 = 8⁄
. As we measured ≈ 10 Pa for the drained particle-free foam (with = 225 µm), which is characterized by an average gas volume fraction equal to *6 ≈ 0.97, chosen parameters are ≈ 0.6
12 and ≈ 0.64, the volume fraction corresponding to the random close packing of spheres. We have introduced the parameter , the volume fraction of yield stress material in foam.
Results (figure 4) have shown that the yield stress of emulsion foams depends on coupled effects of capillary pressure, 8⁄ , and emulsion yield stress, . Those parameters can be used to form the Bingham-capillary number [25,26,29], <= = ⁄ . The reduced yield stress 8 $ &' 0 is expected to depend on the emulsion amount, i.e., = 1 , and the Bingham-capillary number. The modelling of those coupling effects is a huge theoretical task, as suggested by theoretical work devoted to bubbly systems [33], and it is far beyond the scope of the present paper. Now we try to show that collected data can be described with a function of <= and . Note that (i) for a given bubble size, the effect of interstitial material is expected to increase as and increase; (ii) for a given yield stress fluid as interstitial material, its effect on the global yield stress is expected to increase as the bubble capillary pressure decreases. Therefore, we seek for a simple analytical form complying with this behavior and we propose arbitrarily the following form: $ &' 0 = 1 + > ?<=@. As shown in figure 6a, a single curve can be obtained by plotting
$ &' 0 as a function of A B⁄ <= ⁄B, suggesting that, within the range of investigated parameter values, the reduced yield stress can be described by:
CD≡FFGG$HG&= 1 + > A B⁄ <= ⁄B (eq. 1)
with > = 110. Within the range of investigated parameters, equation 1 gives the strengthening effect of interstitial matter possessing yield stress properties, with respect to the yield stress of the corresponding aqueous foam. It is worth noting that equation 1 is expected to be useful for every foam made with yield stress material, as soon as the latter can be considered as continuous matter confined in the interstitial foam network. This situation is expected to correspond also to foams made from granular suspensions of small particles. For our system, this is indeed the case for particles of diameter equal to 10 and 20 µm, as shown in figure 1e-f. Using equation 1 with such a system means attributing a yield stress value for the bulk granular matter confined between the bubbles. Granular matter is expected to exhibit yield stress properties for volume fractions close to the packing volume fraction [34]. Therefore, the volume fraction of interstitial granular yield stress material can be estimated by ≈ ⁄ . In figure 6b, both emulsion foams and granular foams show the same curve as $ &' 0 is plotted as a function of A B⁄ <= ⁄B, assuming = 120 Pa for granular foams. Can we justify such a value? Yielding of bulk granular matter is well-described by the Mohr-Coulomb criterion: = IJ, where J is the confinement pressure exerted on
13 the grains and I is the so-called internal friction coefficient. On one hand, such a confinement pressure is provided in foamy systems by bubbles interface pushing on packed particles. This quantity depends on experimental conditions. In our system, liquid is free to drain within the packed particles (drained conditions), so the confinement pressure J is set by hydrostatic pressure: J ≈ (KLM ∼ 400 Pa. On the other hand, internal friction coefficient depends on particle shape and particle volume fraction. For sphere packings, the accepted value is I ≈ 0.3 [35,36]. Under pressure conditions imposed by bubbles, yielding of granular packings is expected to occur for shear stress value equal to ≈ 0.3 O 400 ≈ 130 Pa, which is in very good agreement with the value deduced from figure 6b. Therefore, packed small solid particles and continuous yield stress material induce similar strengthening of foam yield stress. It is interesting to note that such a small confinement pressure was however found to induce extremely large values for bulk elasticity of the granular skeleton [20,21], i.e. P ≈ 150 kPa. Note also that the overshoot behavior is also a feature of sheared dense granular matter [37].
Fig. 6: Yield stress of complex liquid foams divided by the yield of the corresponding aqueous foam (i.e. same bubble size and same gas volume fraction, estimated by the following relationship:
14 0 = 0.6 8⁄ 0.64 ) as a function of A B⁄ <= ⁄B, where is the volume fraction of yield stress material in foam, and <= = ⁄ is the Bingham-capillary number. Solid lines represent 8 equation 1. (a) Emulsion foams with several bubble sizes. (b) Emulsion foams – all data presented in
(a) – and foams made from granular suspensions (particles of diameter 10 and 20 µm).
Obviously, description proposed for small particles confined within the foam channel network is not appropriate for large particles. Theory exists for yield stress of large inclusions embedded in yield stress matrix [38–40]. In such a case, thanks to micro-mechanical approaches [38], the reduced yield stress $ &' 0 can be estimated from the reduced elastic modulus by the following relationship: FG$HQ& FG = R$1 & S$HQ& S T D⁄ (eq. 2)
Strengthening effect due to solid particles embedded in matrix of elastic modulus P+UVW X has been shown to be given by [39–41]: P$ & P⁄ +UVW X= $1 ⁄ &Y .ZH[. Applying this results to our system requires to express P+UVW X, the bulk elastic modulus of the embedding foam. Within our experimental configuration, the average value of the drained particle-free foam, that fills spaces between large particle inclusions, is *6. This value differs from the value measured for the particle-loaded foam, i.e., = *6$1 &, so the modulus of the reference aqueous foam [32], P 0 = K 8 .⁄ / , differs from the modulus of the embedding foam, P+UVW X=
K 8 .⁄ / *6$ *6 &, where K is a coefficient around 1.6. Therefore, we introduce the factor
\$ & = P+UVW X⁄P 0 , which can be written \$ & =
$ *6 & ]$1' &$ *6$1 & &^. Within our experimental configuration, \$ & varies
from 1 to 1.23 as increases from 0 to 0.05. The reduced shear elastic modulus is obtained by writing P$ & P 0⁄ = P$ & P⁄ +UVW XO P+UVW X⁄P 0 , which can be expressed as:
S$HQ& S = \$ & O _1 HQ H[` Y .ZH[ (eq. 3)
Note that previous work has demonstrated the validity of eq. 3 for elasticity of foams loaded with large spherical inclusions [21,42]. According to equations 2 and 3, the reduced yield stress writes:
15 C ≡FG$HQ& FG = _$1 &\$ &` D⁄ _1 HQ H[` YZH[⁄A (eq. 4)
Equation 4 is plotted in figure 7a, showing very good agreement with data corresponding to the largest investigated particle size, which suggests that for ⁄ a 1, embedding foam can be considered as a continuous matrix. This is consistent with previous results obtained for the yielding of a single spherical inclusion [43,44].
Fig. 7: Foams made with granular suspensions. (a) Yield stress divided by the yield of the corresponding aqueous foam (i.e. same bubble size and same gas volume fraction, estimated by the
16 all the investigated particle sizes. Lines correspond to equation 7 with given ̃ values. (b) Normalized yield stress ̃ as a function of particle-to-bubble size ratio, for particle volume fraction set to 0.05
(same symbols as in figure 7a). Solid lines corresponds to ̃ = exp $ ⁄ &.
The reduced yield stress of particle-loaded foams is therefore bounded by equations 1 and 4 (figure 7a). For ⁄ ≪ 1, particles form an interstitial granular skeleton with intrinsic yield stress properties, and the foam yield stress is given by function CD (eq. 1). For ⁄ ≫ 1, particles are no more contained within the foam network, but instead, they can be considered as isolated solid inclusions embedded in foam matrix. In such a case, the foam yield stress is given by function C (eq. 4). As the particle-to-bubble size ratio increases from ⁄ ≪ 1 to ⁄ ≫ 1, a geometrical transition occurs and induces a transition in the yield stress values. This can be highlighted in considering the normalized yield stress ̃ which measures the magnitude of $ & with respect to both upper and lower bounds defined by equations 1 and 4, for which ̃ = 1 and ̃ = 0, respectively:
̃ = hG$iQ&
hG j Y!j
!kY!j (eq. 5)
̃ is plotted in figure 7b as a function of particle-to-bubble size ratio, for a given particle volume fraction. ̃ is shown to decrease with ⁄ , first slowly for ⁄ < 1, then rapidly. This behavior is well described by an exponential decay of the particle-to-bubble size ratio:
̃ ≈ mno$ ⁄ & (eq. 6)
Note that equations 5 and 6 can be combined in order to give an estimate for the yield stress of particle-loaded foams (see figure 7a):
FG$HQ&
FG ≈ C + CD C mno _
pQ
17 Equation 6 refers to bubble size as the characteristic size in the transition regime. The bubble size, , is the natural size, but we stress that previous work [21,42] highlighted a power law decrease for elasticity of particle-loaded foams, i.e. Pr ∼ $ ⁄ &YB⁄ . Such a difference can be understood by considering that bubble movements involved in yielding (i.e. the so-called T1 topological events [32]) can be significantly prevented by particles. Such an effect is expected as the average distance $ ⁄ D B⁄ 1& between neighboring particles is less than one bubble. For = 0.05, particles
with = 140 µm (i.e. ⁄ ≈ 0.5) are separated by less than one bubble, whereas for = 500 µm (i.e. ⁄ ≈ 2), particles are separated by more than one bubble. This suggests that bubbles bridging neighboring particles possess yielding properties significantly different than bulk foam bubbles. Thus, elasticity and yielding should not have the same dependence with ⁄ . Note that the yielding behavior of such bubbles is known to be related to the Rayleigh-Plateau instability [45], which contrasts with yielding of bulk foam bubbles.
In terms of applications, present results can be used, for example, for estimating thicknesses of foamed material, such as isolating foamed mortars, that can be deposited on vertical substrates. The material thickness is m ≈ $ , <= & 1⁄ (+K, where (+ is the density of the interstitial matrix. We focus on behavior described by equation 1, i.e. for foam containing a continuous matrix with intrinsic yield stress . Results are presented in figure 8. It is shown (figure 8a) that intrinsic yield stress of 100 Pa allows deposition of material layer with a few centimeters thick. Moreover, this thickness can be significantly increased, i.e. 10 cm, if small bubbles are used (figure 8b).
18 Fig. 8: Expected thickness of complex foam layers that can be deposited and maintained in static equilibrium on vertical substrates. (a) Thickness as a function of air volume fraction for bubble size
= 100 µm and several values for the yield stress of the interstitial matrix. The dashed line corresponds to = 0. Inset: thickness as a function of for = 0.9. (b) Thickness as a function of
air volume fraction for interstitial yield stress = 100 Pa and several bubble size values.
5. Conclusion
We investigated the yield stress properties of complex liquid foams, i.e. foams made (1) with concentrated emulsion, and (2) with granular suspensions. Advanced elaboration method allowed producing systems with well-controlled parameters: bubble size , gas volume fraction , yield stress of interstitial emulsion , particle volume fraction and particle size . The yield stress of emulsion foams was found to be governed by the Bingham-capillary number <= = ⁄ and the 8 volume fraction of interstitial emulsion . More precisely we showed that foam yield stress increases with both and <= . Results obtained for foams made with small particles, i.e. ⁄ < 0.1, were successfully described by parameters and <= , assuming an intrinsic yield stress for packed particles confined between foam bubbles. The interstitial yield stress value was shown to be fully consistent with expected yielding properties of granular materials, according to the Mohr-Coulomb criterion. Yield stress of foams made with large particles, i.e. ⁄ ≈ 10, was found to be well-described by theory developed from micro-mechanics of particle-loaded yield stress materials, suggesting that for such size ratios, foam can be considered as a continuous matrix. With respect to yield stress values obtained for both small and large size ratios, the normalized foam yield stress was found to decrease exponentially in the range of intermediate ⁄ values. Such a behavior can be interpreted through the number of bubbles separating neighboring particles. As the size ratio decreases from ⁄ ≈ 10, this number decreases strongly down to values below unity, i.e. particles are bridged by single bubble layers, which are expected to possess yielding properties significantly different than bulk foam bubbles.
Finally, we have shown how results reported in this study can be used for estimating the thickness of complex foam that can be deposited on vertical substrates. Note that if the material is composed of solid particles (cement, plaster or clay slurries), two issues have to be considered: (1) the effect of the particle-to-bubble size ratio, as described by equation 7; (2) the effect of the confinement pressure exerted by bubbles on the particles. The latter effect remains to be understood in details.
19
Appendix
As explained in the experimental part, the success of our generation method is based on appropriate control of liquid content in the precursor foam. We address this issue through both numerical simulations of the foam production process and dedicated experiments.
Fig. A1: Example of the results obtained with the numerical approach. Continuous lines show the evolution of the vertical profile of the liquid volume fraction for several times: (from bottom to top)
t = 9, 15, 22, 28, 36 and 40 min. The latter time corresponds to the end of the generation process. Parameters are the following: = 140 µm, tu = 3.5 cm3/min, t = 0.6 cm3/h. The dashed line shows the vertical profile at time equal to 100 min, i.e. 1 hour after the end of the foam generation process
with t = 0.6 cm3/h.
We start the numerical approach by considering Darcy’s law applied to aqueous foam [32]: vw =x Hy _(Kw + z{{wΠ ` (eq. A1)
20 where v is the superficial liquid velocity, i.e. liquid flow rate divided by the cross-section area of the foam column } = 5 cm2, \ and Π are respectively the foam permeability and the foam osmotic pressure. Using the continuity equation, ~ ~⁄ + z{{w ∙ vw = 0, one obtains the so-called drainage equation:
€H €V+ z{{w ∙ •
x H
y _(Kw + z{{wΠ `‚ = 0 (eq. A2)
Expressions for \ and Π are given by [46,47]:
\ ≃A Z DY .†H‡ . Hq„H… „⁄ „ „ (eq. A3) Π ≃ 7.3qˆ .†AYHHk „⁄ „ (eq. A4)
Equation A2 is solved by the finite difference method (FDM). The following boundary conditions are used: 0 = 0.74 (monodisperse ordered – CFC – foam) and Π ‰⁄ = 0 at ‰ = 0 (bottom of the column), v = t }⁄ is the liquid velocity imposed at the top of the foam for simulating the imbibition process.
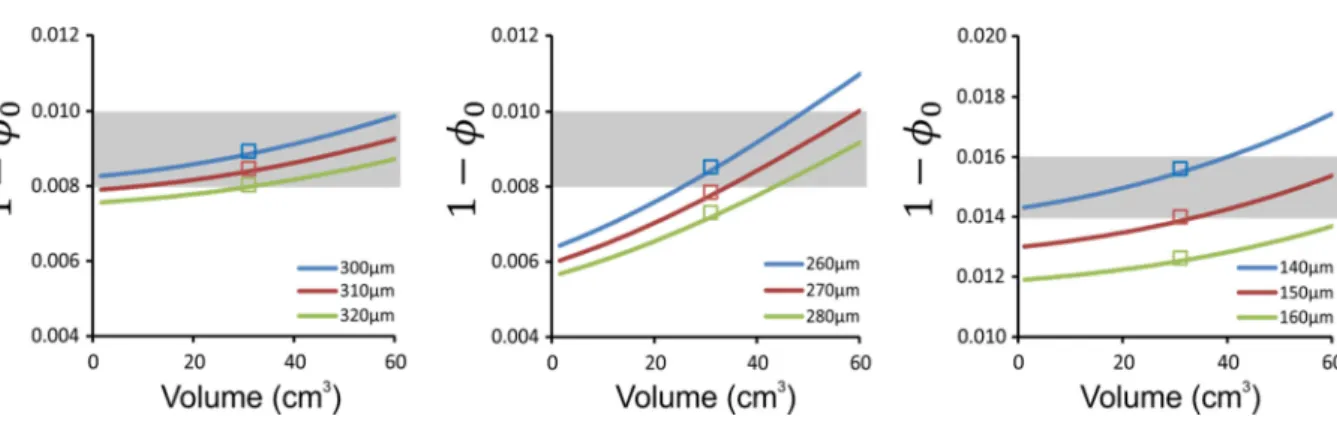
Fig. A2: Liquid volume fraction of precursor foams as delivered from the generation column within testing conditions. Shaded areas correspond to the global (averaged) liquid fraction measured over 60 cm3 delivered by the generation column. Solid curves correspond to numerical simulations. They give the foam liquid volume fraction at the column outlet as a function of the delivered foam volume.
Empty square show the average values of liquid volume fraction over the full profile. The foam production parameters are the following: (a) tu = 7 cm3/min, t = 1.2 cm3/h, ∆ = 5 min, t! = 15 cm3/min. (b) t
u = 7 cm3/min, t = 0.5 cm3/h, ∆ = 5 min, t! = 15 cm3/min. (c) tu = 3.5 cm3/min,
t = 0.6 cm3
21 The foam production is composed of three parts. (1) Generation step. A foam volume Š!, or equivalently a foam height ℎ! = Š!⁄ , is generated at a gas flow rate t} u: a foam slice of thickness Δ‰ ≃ 10 , i.e. Δ‰ ≃ ℎ!⁄100, is inserted at foam bottom at each time interval Δ = Δ‰} t⁄ , i.e. u
existing foam slices are shifted upward from a distance equal to Δ‰. Gas volume fraction of the inserted foam slice is 0 = 0.74. During Δ , foam is draining, involving a net liquid flux for each foam slice at height ‰ and a resulting new value ‰ calculated according to equation A2 (see figure A1). (2) Drainage step. The generation process is stopped and the foam column is let to drain for a duration Δ with liquid imbibition from the top at flow rate t (see figure A1). (3) Foam delivery step. Foam flushing out of the column at a flow rate tp is simulated by “removing” a foam slice Δ‰ from the top at each time interval Δ = Δ‰} t⁄ . Liquid volume fraction of the removed foam slice is p measured. During Δ , each foam slice at height ‰ is draining according to equation A2. Note that the imbibition flow rate t can be maintained at the same value as in the previous step or set to zero. In order to validate the numerical tool, we performed specific measurements for the liquid content of precursor foams delivered from our setup. Note that the delivery conditions of precursor foam when mixed with emulsion during the emulsion foam production are 60 cm3 within 20 min. Such conditions cannot be applied for measuring accurately the volume of the emulsion-free precursor foam due to the absence of the emulsion stabilizing effect against osmotic ripening – due to perfluorohexane – and partial collapse. Therefore, those measurements are performed at high flow rate for foam delivery (60 cm3 within 4 min). Simulations obtained with three sets of parameters are compared with experimental results in figure A2. Within experimental error for bubble size, good agreement is obtained for the three testing configurations. This suggests that numerical simulations can be used without any modification for optimizing the generation process within conditions for emulsion foams production, i.e. 60 cm3 within 20 min. Figure A3 presents such results for two investigated bubble sizes, showing that precursor foams exhibit approximately constant gas volume fractions , i.e. Δ ≲ 0.001.
22 Fig. A3: Liquid volume fraction of precursor foams as delivered from the generation column within experimental conditions for the production of emulsion foams. Parameters are the following: (1) =
140 µm, tu = 3.5 cm3/min, t = 0.6 cm3/h during foam generation, ∆ = 60 min, t! = 3.5 cm3/min, t = 0 during foam delivery. (2) = 300 µm, tu = 3.5 cm3/min, t = 1.2 cm3/h during foam
generation, ∆ = 60 min, t! = 3.5 cm3/min, t = 0 during foam delivery.
Acknowledgements
We thank D. Hautemayou and C. Mézière for technical support. We gratefully acknowledge financial support from Agence Nationale de la Recherche (Grant no. ANR-13-RMNP-0003-01) and French Space Agency (convention CNES/70980). We thank X. Chateau and G. Ovarlez for fruitful discussions.
References
[1] F.K. Akthar, J.R.G. Evans, High porosity (>90%) cementitious foams, Cement and Concrete Research. 40 (2010) 352–358. doi:10.1016/j.cemconres.2009.10.012.
[2] L.J. Gibson, M.F. Ashby, Cellular Solids: Structure and Properties, Cambridge University Press, Cambridge, 1997.
[3] S. Cohen-Addad, R. Höhler, O. Pitois, Flow in Foams and Flowing Foams, Annual Review of Fluid Mechanics. 45 (2013) 241–267.
http://www.annualreviews.org/doi/abs/10.1146/annurev-fluid-011212-140634.
[4] K.E. Allen, B.S. Murray, E. Dickinson, Development of a model whipped cream: Effects of emulsion droplet liquid/solid character and added hydrocolloid, Food Hydrocolloids. 22 (2008) 690–699. doi:10.1016/j.foodhyd.2007.01.017.
[5] Z. Zhang, J.L. Provis, A. Reid, H. Wang, Geopolymer foam concrete: An emerging material for sustainable construction, Construction and Building Materials. 56 (2014) 113–127.
23 doi:10.1016/j.conbuildmat.2014.01.081.
[6] Z. Bazelová, L. Pach, J. Lokaj, The effect of surface active substance concentration on the properties of foamed and non-foamed gypsum, Ceramics - Silikaty. 54 (2010) 379–385. [7] A.M. Sani, K.K. Mohanty, Incorporation of clay nano-particles in aqueous foams, Colloids and
Surfaces A: Physicochemical and Engineering Aspects. 340 (2009) 174–181. doi:10.1016/j.colsurfa.2009.03.026.
[8] R. Guillermic, A. Salonen, J. Emile, A. Saint-Jalmes, Surfactant foams doped with laponite: unusual behaviors induced by aging and confinement, Soft Matter. 5 (2009) 4975–4982. doi:10.1039/b914923f.
[9] F. Carn, A. Colin, O. Pitois, M. Vignes-Adler, R. Backov, Foam drainage in the presence of nanoparticle-surfactant mixtures, Langmuir. 25 (2009) 7847–7856. doi:10.1021/la900414q. [10] F. Carn, A. Colin, O. Pitois, R. Backov, Foam drainage study during plateau border
mineralisation, Soft Matter. 8 (2012) 61–65. doi:10.1039/c1sm06778h.
[11] I. Lesov, S. Tcholakova, N. Denkov, Factors controlling the formation and stability of foams used as precursors of porous materials., Journal of Colloid and Interface Science. 426 (2014) 9–21. doi:10.1016/j.jcis.2014.03.067.
[12] I. Lesov, S. Tcholakova, N. Denkov, Drying of particle-loaded foams for production of porous materials: mechanism and theoretical modeling, RSC Advances. 4 (2014) 811–823.
doi:10.1039/c3ra44500c.
[13] A. Britan, M. Liverts, G. Ben-Dor, S.A. Koehler, N. Bennani, The effect of fine particles on the drainage and coarsening of foam, Colloids and Surfaces A: Physicochemical and Engineering Aspects. 344 (2009) 15–23. doi:10.1016/j.colsurfa.2009.03.011.
[14] Y. Khidas, B. Haffner, O. Pitois, Capture-induced transition in foamy suspensions., Soft Matter. 10 (2014) 4137–4141. doi:10.1039/c4sm00246f.
[15] B. Haffner, Y. Khidas, O. Pitois, Flow and jamming of granular suspensions in foams., Soft Matter. 10 (2014) 3277–3283. doi:10.1039/c4sm00049h.
[16] F. Rouyer, B. Haffner, N. Louvet, Y. Khidas, O. Pitois, Foam clogging, Soft Matter. 10 (2014) 6990–6998. doi:10.1039/C4SM00496E.
[17] B. Haffner, Y. Khidas, O. Pitois, The drainage of foamy granular suspensions, Journal of Colloid and Interface Science. 458 (2015) 200–208. doi:10.1016/j.jcis.2015.07.051.
[18] S. Cohen-Addad, M. Krzan, R. Höhler, B. Herzhaft, Rigidity percolation in particle-laden foams, Physical Review Letters. 99 (2007) 168001. doi:10.1103/PhysRevLett.99.168001.
[19] A.Ö. Özarmut, H. Steeb, Rheological Properties of Liquid and Particle Stabilized Foam, Journal of Physics: Conference Series. 602 (2015) 12031. doi:10.1088/1742-6596/602/1/012031. [20] F. Gorlier, Y. Khidas, A. Fall, O. Pitois, Optimal strengthening of particle-loaded liquid foams,
Physical Review E - Statistical, Nonlinear, and Soft Matter Physics. 95 (2017) 42604. doi:10.1103/PhysRevE.95.042604.
[21] F. Gorlier, Y. Khidas, O. Pitois, Elasticity of particle-loaded liquid foams, accepted in Soft Matter (2017). doi:10.1039/C7SM00679A.
[22] K. Koczo, L.A. Lobo, D.T. Wasan, Effect of oil on foam stability: Aqueous foams stabilized by emulsions, Journal of Colloid and Interface Science. 150 (1992) 492–506. doi:10.1016/0021-9797(92)90218-B.
[23] J. Goyon, F. Bertrand, O. Pitois, G. Ovarlez, Shear induced drainage in foamy yield-stress fluids, Physical Review Letters. 104 (2010) 128301. doi:10.1103/PhysRevLett.104.128301.
[24] A. Salonen, R. Lhermerout, E. Rio, D. Langevin, A. Saint-Jalmes, Dual gas and oil dispersions in water: production and stability of foamulsion, Soft Matter. 8 (2012) 699–706.
doi:10.1039/c1sm06537h.
[25] M. Kogan, L. Ducloué, J. Goyon, X. Chateau, O. Pitois, G. Ovarlez, Mixtures of foam and paste: Suspensions of bubbles in yield stress fluids, Rheologica Acta. 52 (2013) 237–253.
doi:10.1007/s00397-013-0677-7.
[26] L. Ducloué, O. Pitois, J. Goyon, X. Chateau, G. Ovarlez, Rheological behaviour of suspensions of bubbles in yield stress fluids, Journal of Non-Newtonian Fluid Mechanics. 215 (2015) 31–39.
24 doi:10.1016/j.jnnfm.2014.10.003.
[27] L. Ducloué, O. Pitois, J. Goyon, X. Chateau, G. Ovarlez, Coupling of elasticity to capillarity in soft aerated materials., Soft Matter. 10 (2014) 5093–8. doi:10.1039/c4sm00200h.
[28] F. Gorlier, Y. Khidas, O. Pitois, Coupled elasticity in soft solid foams, Journal of Colloid And Interface Science. 501 (2017) 103–111. doi:10.1016/j.jcis.2017.04.033.
[29] L. Ducloué, O. Pitois, L. Tocquer, J. Goyon, G. Ovarlez, Yielding and flow of foamed metakaolin pastes, Colloids and Surfaces A: Physicochemical and Engineering Aspects. 513 (2017) 87–94. doi:10.1016/j.colsurfa.2016.11.015.
[30] T.G. Mason, J. Bibette, D.A. Weitz, Yielding and Flow of Monodisperse Emulsions, Journal of Colloid and Interface Science. 179 (1996) 439–448. doi:10.1006/jcis.1996.0235.
[31] F.G. Gandolfo, H.L. Rosano, Interbubble Gas Diffusion and the Stability of Foams, Journal of Colloid and Interface Science. 194 (1997) 31–36. doi:10.1006/jcis.1997.5067.
[32] I. Cantat, S. Cohen-Addad, F. Elias, F. Graner, R. Höhler, O. Pitois, F. Rouyer, Foams: Structure and Dynamics, Oxford University Press, Oxford, 2013.
[33] N.-T. Thy Linh, L. Ducloué, G. Ovarlez, X. Chateau, Overall Properties of a Soft Porous Material: Surface Tension Effects, in: ASCE (Ed.), Poromechanics V: Proceedings of the Fifth Biot
Conference on Poromechanics, American Society of Civil Engineers, Reston, VA, 2013: pp. 1895–1902. doi:10.1061/9780784412992.224.
[34] A.J. Liu, S.R. Nagel, Nonlinear dynamics: Jamming is not just cool any more, Nature. 396 (1998) 21–22. doi:10.1038/23819.
[35] A. Fall, G. Ovarlez, D. Hautemayou, C. Mézière, J.-N. Roux, F. Chevoir, Dry granular flows: Rheological measurements of the μ(I)-rheology, Journal of Rheology. 59 (2015) 1065–1080. doi:10.1122/1.4922653.
[36] F. da Cruz, S. Emam, M. Prochnow, J.-N. Roux, F. Chevoir, Rheophysics of dense granular materials: Discrete simulation of plane shear flows, Physical Review E. 72 (2005) 21309. doi:10.1103/PhysRevE.72.021309.
[37] M.D. Bolton, The strength and dilatancy of sands, Géotechnique. 36 (1986) 65–78.
[38] X. Chateau, G. Ovarlez, K.L. Trung, Homogenization approach to the behavior of suspensions of noncolloidal particles in yield stress fluids, Journal of Rheology. 52 (2008) 489–506. doi:10.1122/1.2838254.
[39] F. Mahaut, S. Mokéddem, X. Chateau, N. Roussel, G. Ovarlez, Effect of coarse particle volume fraction on the yield stress and thixotropy of cementitious materials, Cement and Concrete Research. 38 (2008) 1276–1285. doi:10.1016/j.cemconres.2008.06.001.
[40] F. Mahaut, X. Chateau, P. Coussot, G. Ovarlez, Yield stress and elastic modulus of suspensions of noncolloidal particles in yield stress fluids, Journal of Rheology. 52 (2008) 287.
doi:10.1122/1.2798234.
[41] F. Mahaut, F. Bertrand, P. Coussot, X. Chateau, G. Ovarlez, Suspensions of noncolloidal particles in yield stress fluids: Experimental and micromechanical approaches, AIP Conference Proceedings. 1027 (2008) 671–673. doi:10.1063/1.2964804.
[42] Y. Khidas, B. Haffner, O. Pitois, Critical size effect of particles reinforcing foamed composite materials, Composites Science and Technology. 119 (2015) 62–67.
doi:10.1016/j.compscitech.2015.09.024.
[43] I. Cantat, O. Pitois, Mechanical probing of liquid foam ageing, Journal of Physics: Condensed Matter. 17 (2005) S3455–S3461. doi:10.1088/0953-8984/17/45/034.
[44] I. Cantat, O. Pitois, Stokes experiment in a liquid foam, Physics of Fluids. 18 (2006) 83302. doi:10.1063/1.2267062.
[45] S.J. Cox, D. Weaire, M. Fatima Vaz, The transition from three-dimensional to two-dimensional foam structures, European Physical Journal E. 7 (2002) 311–315. doi:10.1140/epje/i2011-11082-y.
[46] F. Rouyer, O. Pitois, E. Lorenceau, N. Louvet, Permeability of a bubble assembly: From the very dry to the wet limit, Physics of Fluids. 22 (2010) 43302. doi:10.1063/1.3364038. [47] R. Höhler, Y.Y.C. Sang, E. Lorenceau, S. Cohen-Addad, Osmotic pressure and structures of
25 monodisperse ordered foam, Langmuir. 24 (2008) 418–425. doi:10.1021/la702309h.