HAL Id: inserm-01154124
https://www.hal.inserm.fr/inserm-01154124
Submitted on 21 May 2015
HAL is a multi-disciplinary open access
archive for the deposit and dissemination of sci-entific research documents, whether they are pub-lished or not. The documents may come from teaching and research institutions in France or abroad, or from public or private research centers.
L’archive ouverte pluridisciplinaire HAL, est destinée au dépôt et à la diffusion de documents scientifiques de niveau recherche, publiés ou non, émanant des établissements d’enseignement et de recherche français ou étrangers, des laboratoires publics ou privés.
Subjective social status: its determinants and its
association with measures of ill-health in the Whitehall
II study.
Archana Singh-Manoux, Nancy Adler, Michael Marmot
To cite this version:
Archana Singh-Manoux, Nancy Adler, Michael Marmot. Subjective social status: its determinants and its association with measures of ill-health in the Whitehall II study.. Social Science and Medicine, Elsevier, 2003, 56 (6), pp.1321-33. �10.1016/S0277-9536(02)00131-4�. �inserm-01154124�
Subjective social status: its determinants and its association with measures of ill-health in the Whitehall II study Archana Singh-Manoux*1 Nancy E. Adler2 Michael G. Marmot1 1
International Centre for Health and Society Department of Epidemiology and Public Health University College London
1-19 Torrington Place London WC1E 6BT, U. K.
2
Health Psychology Program University of California 3333 California Street San Francisco, CA 94143-0844 * Corresponding author Tel.: 44 (0)20 7679 1692 Fax: 44 (0)20 7813 0242
Abstract
The purpose of this study was twofold – 1) investigate the role of subjective social status as a predictor of ill-health, with a further exploration of the extent to which this relationship could be accounted for by conventional measures of socioeconomic position, 2) examine the
determinants of a relatively new measure of subjective social status used in this study. A 10 rung self-anchoring scale was used to measure subjective social status in the Whitehall II study, a prospective cohort study of London-based civil service employees. Results indicate that subjective status is a strong predictor of ill-health, and that education, occupation and income do not explain this relationship fully for all the health measures examined. The results provide further support for the multidimensional nature of both social inequality and health. Multiple regression shows subjective status to be determined by occupational position, education, household income, satisfaction with standard of living, and feeling of financial security regarding the future. The results suggest that subjective social status reflects the cognitive averaging of standard markers of socioeconomic situation and is free of psychological biases.
Introduction
Subjective social status has been defined as “a person’s belief about his location in a status order” (Davis, 1956), referring to an individual’s perception of his/her place in the socioeconomic structure. Initial research into subjective social status was driven by concerns about accurate measurement of this construct (Gough, 1949: Jackman & Jackman, 1973; Kluegel, Singleton, & Starnes, 1977). Subsequently there was an interest in the differential class identities of men and women (Baxter, 1994; Ritter & Hargens, 1975).
This paper investigates the relation to ill-health of a relatively new measure of subjective social status, with a further exploration of the determinants of subjective social status. The specific aims of the paper are:
1. Analysis of the relationship between subjective status and poor health, with an exploration of the extent to which this relationship can be explained by conventional measures of socioeconomic position: occupation, education and income.
2. Identifying the determinants of subjective social status.
There is ample evidence to suggest that social position is a predictor of both morbidity and mortality (Fox, 1989; Davey Smith, Bartley, & Blane, 1990; Mackenbach, Kunst,
Cavelaars, Groenhof, Guerts et al., 1997; Marmot & Wilkinson, 1999; Townsend, Davidson, & Whitehead, 1992). In addition, the existence of a gradient in health is now widely accepted - individuals at the highest socioeconomic level enjoy better health than not only those at the bottom, but also those at all levels in between (Marmot, Davey Smith, Stansfeld, Patel, North, head et al., 1991; Marmot & Shipley, 1996). Four possible explanations for health inequalities have been offered: artefact explanations, theories of natural and social selection,
materialist/structural explanations, and cultural/behavioural explanations (MacIntyre, 1997). The focus in the social inequalities field is now on explicating the causal pathways linking
socioeconomic position to health (e.g., Lynch, Davey Smith, Kaplan, & House, 2000; Marmot & Wilkinson, 2001).
Attempts at explaining the social gradient in health are complicated by the
multidimensional nature of both social inequality (Bartley, Sacker, Firth, & Fitzpatrick, 1999) and that of health itself (MacIntyre, 1997). Bartley and colleagues (1999) suggest delineation of the aetiological pathways linking specific measures of social position to health outcomes as the way forward. The fact that health is itself not unidimensional opens up the field to a plethora of models, each testing the relation between a specific outcome and a specific measure of socioeconomic position. There is some evidence to suggest that subjective status is a unidimensional construct. Multiple indicators of subjective class considered within a path analytical framework supported the assumption of unidimensionality of this construct
(Kluegel, Singleton, & Starnes, 1977).
The interest in subjective social status as a predictor of health has been fuelled by two strands of research. The first concerns the association between income inequality and
mortality (Kaplan, Pamuk, Lynch, Cohen, & Balfour, 1996; Kawachi & Kennedy, 1997; Kennedy, Kawachi, & Prothrow-Stith, 1996; Wilkinson, 1992), leading to delineation of the importance of relative disadvantage, through perception of relative standing in the social hierarchy, in pathways linking socioeconomic position to health. The second strand of evidence comes from animal studies, suggesting a link between position in the social
hierarchy and poor health (Blanchard, Sakai, McEwen, Weiss, & Blanchard, 1993; Kaplan & Manuck, 1999; Sapolsky, 1982).
Theoretically, the concept of subjective social status is wider than that that of “relative social standing” which is more a by-product of income inequality research. There is already some evidence to support this assumption. Jackman (1979) reported education, income and occupation to be involved in an individual’s assessment of his/her subjective social class. In
further analyses she found subjective class to be popularly interpreted as both a social and economic phenomenon in the American consciousness. A measure of subjective social status is likely to reflect not only current social circumstances, but also incorporate an assessment of the individual’s past (socioeconomic, educational, and economic background), along with their future prospects. Subjective social status would be expected to encompass the individual’s family resources, opportunities and life chances.
Subjective class identity is a complex phenomenon. In women it has been found to include their own employment status (Ritter & Hargens, 1975), their level of education
(Abbott, 1987; Jackman & Jackman, 1973), as well as their husbands’ objective class (Baxter, 1994). The majority of research in this field has been on subjective social “class”, which has been measured by respondents placing themselves in 4-6 social class categories like lower, working class, middle class, or upper class (e.g. Jackman & Jackman, 1973; Kluegel, Singleton, & Starnes, 1977). For the process of class-self-placement to work adequately all respondents need to have similar perceptions of the class system. As the terms “working class” and “middle class” can be variously interpreted, and are politically loaded (Evans, Kelley, & Kolosi, 1992), using this terminology in subjective class research can be misleading.
More recently, pictorial representations have been used to study perceived social class and social structures (Evans, Kelley, & Kolosi, 1992), and subjective social status (Adler, Epel, Castellazzo, & Ickovics, 2000; Ostrove, Adler, Kuppermann, & Washington, 2000). This paper presents data on a new measure of subjective social status (cf. Adler et al., 2000) developed to examine the role played by social status in determining health. There is already some support for the notion that subjective status is associated independently with physical and psychological health (Adler et al., 2000; Ostrove et al., 2000). In this paper, the
respiratory illness, perceived-general-health, GHQ depression – is assessed, with an examination of the extent to which this relationship can be explained by conventional measures of socioeconomic position.
The second issue that this paper addresses is the criteria people use to assign
themselves subjective social status. The process of assigning oneself social status is likely to involve processes of social comparison (comparison of self to similar others) and reflected appraisals (self perception is based on the way we see others perceiving us). The determinants of subjective social status will provide an insight into the interpretation of this concept. The main question relates to whether people use the conventional indicators of socioeconomic position (income, education, occupation), measures of wealth, or whether other elements like psychological well-being influence the assessment of subjective status. In other words, to what extent is the perception of status determined by social structural location, and to what extent is it determined by psychological processes.
Participants and Methods
Participants
The target population for the Whitehall II study was all the London-based office staff, aged 35-55, working in 20 Civil Service departments. With a response rate of 73%, the final cohort consisted of 10,308 participants (6,895 men and 3,413 women) at the first phase of data collection between 1985 and 1988. The true response rate is higher as around 4 % of those invited were not eligible for inclusion. Although mostly white collar, respondents
covered a wide range of employment grades from office support to permanent secretary. As of 1987 annual salaries ranged from £62,100 for a permanent secretary to £3,061 for the lowest paid office-support grade.
The screening at baseline (Phase I) involved a clinical examination, and a self-administered questionnaire containing sections on demographic characteristics, health, lifestyle factors, work characteristics, social support and life events. Since baseline screening four further data collection rounds have been completed. Successive phases alternate between collecting data by self-administered questionnaire only and collecting data via a clinical screening in addition to questionnaire completion. The most recent phase of data collection (Phase V) was completed between 1997-1999.
The subjects for these analyses are drawn from Phase V of the Whitehall II study. Response at Phase V was 76% of those who participated at baseline screening, 12 years previously. In addition to those who failed to respond to invitations to participate, non-respondents included participants who had died or those who could not be traced. 6981 participants provided data for the analyses presented in the paper, 4609 men and 2372
women. The response rate at Phase V was influenced by employment grade, with participants from the lower employment grades registering a lower follow-up participation rate. The
differential response rate did not bias the results significantly as the relationship between employment grade and self-rated health was not statistically different at Phases I and V.
Measures
Subjective social status. A self-anchoring scale (Cantril, 1965) in the form of a 10 rung ladder (see Appendix 1) was used to measure subjective social status. Participants were given the drawing of a ladder with the following instructions: “ Think of this ladder as representing where people stand in society. At the top of the ladder are the people who are best off –those who have the most money, most education and the best jobs. At the bottom are the people who are worst off – who have the least money, least education and the worst jobs or no job. The higher up you are on this ladder, the closer you are to people at the very top and the lower you are , the closer you are to the bottom. Where would you put yourself on the ladder? Please place a large ‘X’ on the rung where you think you stand.”
Objective socioeconomic position
Occupation: Occupational position was assessed via civil service employment grade in the
Whitehall II study. All participants were asked to give their current or last known civil service grade title. The civil service identifies 12 non-industrial grade levels, which correspond to the top seven Unified Grades, plus the other five main grades: senior executive officer (SEO), higher executive officer (HEO), executive officer (EO), clerical officer, and office support staff. To obtain sufficient numbers in each cell, the top six grades have been combined to form one group, and the bottom two have been combined into one, thus producing six employment grades overall.
Education: Education was measured as the highest level of education achieved, with the
respondent choosing one of the 11 categories in the questionnaire. This was regrouped into five standard hierarchic levels: (1) no formal education, (2) lower secondary education –
school leaving examination taken aged 16, (3) higher secondary education – school leaving examination taken aged 18, (4) university degree, (5) higher university degree.
Personal Income: Respondents were asked to pick a category that corresponded most closely
with their annual personal income (“amount received annually from salary or wages, or pensions, benefits and allowances before deduction of tax”). There were 8 categories in all ranging from “less than £9,999” to “more than £70,000”. For the purposes of analysis the two highest and the two lowest personal income categories were collapsed leaving 6 categories.
Household Income: In order to measure household income (‘total annual household income
from any source, including personal income’) in Phase 5 of Whitehall II study, the respondent were required to place themselves in one of the 11 categories ranging from “less than £999” to “more than £200,000”. For the purposes of analysis the 5 lowest and the 2 highest
household income categories were collapsed to form 6 categories in all.
Household wealth: Respondents were asked to assess their total assets (‘amount of money
the respondent would have if s/he cashed in all household assets – house, car, caravan, boat, jewellery - and paid off all the debts’). The six categories measuring household wealth ranged from “less than £4,999” to “more than “£500,000”.
Health measures
Angina was assessed on the Rose Angina Questionnaire (Rose, Blackburn, Gillum, &
Pinneas, 1982). Diabetes was reported by the participants as being diagnosed by a doctor.
Respiratory illness was assessed via the Medical Research Council’s (MRC, 1965)
questionnaire. Perceived general health was assessed via the following question: “In general, would you say your health is excellent/very good/good/fair/poor”. For the purposes of this study participants reporting two poorest levels of health were categorised as having “poor” perceived general health. GHQ depression was assessed using four items from the GHQ 30 (Goldberg, 1972) – “been thinking of yourself as a worthless person”, “felt that life is entirely
hopeless”, “felt that life isn’t worth living”, “found at times you couldn’t do anything because your nerves were too bad”. Depression was assessed by summing all the items scored on a Likert scale from 0-3. Respondents scoring 0-4 were considered “non-cases” and those scoring 5 and above were considered “GHQ depression cases”. GHQ depression is best considered to be a measure of depressive symptoms, and should not be equated with clinically diagnosed depression. (Stansfeld, North, White & Marmot, 1995).
Life satisfaction measures
Four life satisfaction measures were used in the study: feeling of financial security,
satisfaction with standard of living, material deprivation, and general life satisfaction. Feeling
of financial security (‘thinking of the next 10 years, how financially secure do you feel’) was
measured on a 4-point Likert scale going from insecure to secure. Satisfaction with standard
of living (‘all things considered how satisfied or dissatisfied are you with your standard of
living’) was measured on a 7-point Likert scale going from “very dissatisfied” to “very satisfied”. Material deprivation was measured on 5-point Likert scales using 4 items (Cronbach’s alpha = .65): “how often does it happen that you do not have enough money to afford the kind of food or clothing you/your family should have”, “how much difficulty do you have in meeting the payment of bills”, “to what extent do you have problems with your housing (e.g. too small, repairs, damp, etc.), “to what extent do you have problems with the neighbourhood in which you live (e.g. noise, unsafe street, few local facilities). General life
satisfaction (‘how satisfied or dissatisfied are you with your life as a whole’) was assessed on
a 7-point scale going from “very dissatisfied” to “very satisfied”. Psychological well-being measures
Seven measures of psychological well-being were used: hopelessness, control at work, general life control, mental health, vigilance, hostility, and optimism. Hopelessness was measured using 6 items adapted from Beck’s Hopelessness scale (Beck, Weissman, Lester, &
Trexler, 1974). These 6 items (Cronbach’s alpha = .80) were measured on 5-point scales.
Control at work (‘at work, I feel I have control over what happens in most situations’) and general life control (‘I feel that what happens in my life is often determined by factors
beyond my control’) were measured on one-item 6-point scales. Mental health was measured by the 30-item General Health Questionnaire (Goldberg, 1972) The GHQ is a measure of minor psychiatric disorder requiring participants to respond to a 30-item-questionnaire, scaled 0-3. Vigilance was measured on three (Cronbach’s alpha = .66) 5-point Likert scales: “I am always on guard for things that may come at me”, “I am not someone who worries about who’s coming up behind me”, and “I am on guard in most situations”. Hostility was
measured using the Cook-Medley hostility scale (Cook & Medley, 1954). Optimism (“Over the next 5-10 years I expect to have many more positive than negative experiences”) was measured on a 6-point Likert scale.
Statistical Analysis
Prevalence rates of ill-health measures have been standardised for age by the direct method using the total study population as the standard. In order to perform the test for trend the 10 categories of subjective social status have been regrouped into 5 categories.
Logistic regression models with health outcomes (angina, diabetes, respiratory illness, perceived general health, and GHQ depression) as binary outcome variables were used to test the significance of the relationship between subjective status and health. The comparison of the degree of inequality in morbidity is carried out by calculating the Relative Index of Inequality (RII), and 95% confidence interval. RII is interpreted as an odds-ratio that expresses the risk of ill-health for those at the bottom of the ladder (subjective social status) compared to those at the top. It is calculated by regressing the morbidity rate against the proportion of the sample that has a higher position in the social hierarchy. This method leads to results that are stable as data from all socioeconomic categories are used. Additionally, it
has the intuitive interpretation as the increase in morbidity when moving from the top to the bottom of the social hierarchy (Mackenbach & Kunst, 1997).
Logistic regression models were set up separately for men and women. In these analyses, the potential confounding effect of age was taken into account by entering age, grouped in 5-year bands, in the models before the predictor variables. Potential self-report response bias has been controlled by using the 7-point general life satisfaction measure described earlier. The cross-sectional nature of the data analysed necessitated adjustment for reporting bias. The reduction in deviance with the addition of one of the measures of social position to the model only containing age and the measure controlling for reporting bias was used to determine the significance of the association of each measure of social position with the measure of ill-health.
The second set of analyses involved multiple linear regression on an initial set of 16 predictor variables, with subjective status as the outcome variable. The analyses involved a sequential search for a small subset of these predictor variables capable of explaining as large a proportion of the variance (R2) associated with the outcome variable, subjective status. R2, lying between 0 and 100%, measures the extent to which the independent variables involved in the model predict the dependent variable. In order to control for overfitting (inclusion of too many variables in the regression model leading to trivial increases in R2) which can lead to the model performing badly on a new sample, each regression model was cross-validated. Cross-validation involves splitting the sample in two parts (70% & 30%) and using the larger to fit a regression model. The coefficients from this model are used to obtain predicted values for the remaining 30% of the sample. Then R2 (the square of the correlation between the predicted and observed values of the dependent variable) for the smaller sample was computed. The difference between R2 for the two samples is called the “shrinkage” and the larger the shrinkage, the poorer the fit of the model. Here this technique was carried out
iteratively in order to ensure stability of the regression model. Power considerations led us to carry out the second set of analysis on men and women together. All analyses were carried out using SPSS for Windows.
Results
Table 1 presents the age-adjusted prevalence rates of angina, diabetes, respiratory illness, perceived general health, and GHQ depression according to subjective social status. The test for trend shows lower subjective status in both men and women to be related to higher rates of age-adjusted morbidity. The trend for increasing rate of morbidity with decreasing subjective status does not hold true for respiratory illness in women.
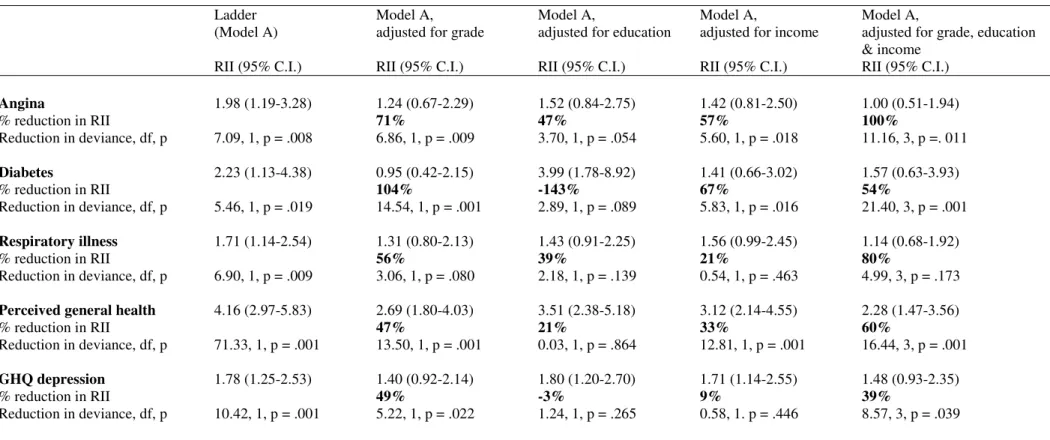
Table 2 presents the Relative Indices of Inequality (RII) of the health-subjective status relationship before and after adjustment for three different measures of socioeconomic
position. Subjective status in men shows a significant association with all the health measures, indicating that men with low subjective status have significantly more angina, diabetes, respiratory illness, poor self-rated health and depression. The RII is smallest for respiratory illness (1.71) and is largest for perceived general health (4.16). The adjustment for
occupational position – employment grade – causes the differences in diabetes due to
subjective position to disappear completely. For the other health measures, employment grade explains between 47 and 71 % of the relationship between subjective status and the morbidity measures.
The contribution of education alone to the subjective status-health relationship in men is significant only marginally for angina (p = .05) and diabetes (p = .09). In fact, adjustment for education to the subjective status-diabetes relationship increases the RII. The reason for this increase in RII is the non-linear bivariate relationship between education (not shown here) and diabetes. The relationship between educational level and diabetes is U-shaped with
respondents in both the lowest and highest levels of education reporting more diabetes than the intermediate levels. The adjustment for income to the subjective status-health relationship is significant for angina, respiratory illness and perceived general health. Overall income on its own explains between 9 and 67% of the variance in the relationship between the ladder and
health measures analysed in this paper. When the initial model, the relationship between subjective status and health, is adjusted for all three measures of socioeconomic position, only for angina is the variance explained fully.
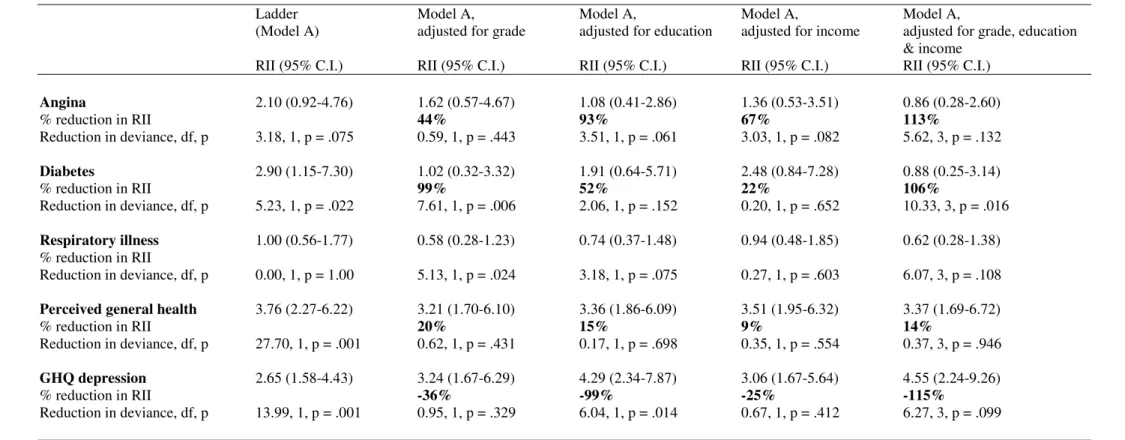
Table 3 examines the RIIs of the health-subjective status relationship in women. Subjective status has a significant relationship with diabetes (RII 2.90), perceived general health (RII 3.76), GHQ depression (RII 2.65.); and a marginally significant relationship with angina (RII 2.10). However, as also evident from the trend analysis presented earlier, there is no gradient in the relationship between subjective status and respiratory disease (RII 1). This implies that women with low subjective status have significantly more angina, diabetes, poor-self-rated health, and depression than women with high subjective status.
The adjustment for employment grade has the same effect on diabetes in women as in men, it explains all the variation in the relationship between subjective status and diabetes. This adjustment also reveals the bivariate non-linearity of the relationship between depression and employment grade. The contribution of education to the subjective status-health
relationship in women is marginally significant for angina (p = .06), but leads to a significant increase in the RII representing the subjective status-depression relationship. This is due the prevalence of slightly higher levels of depression in the women with higher levels of
education.
The adjustment for income to the subjective status-health relationship is significant marginally for angina in women (p = .08). Apart from angina, where it reduces the subjective status-health relationship by 67%, annual personal income does not play an important role in explaining the observed gradient. The initial model (subjective status predicting health), adjusted for all three measures of socioeconomic position explains very little of the variance concerning perceived general health and depression in women.
The second set of analyses carried out in this study involved the prediction of
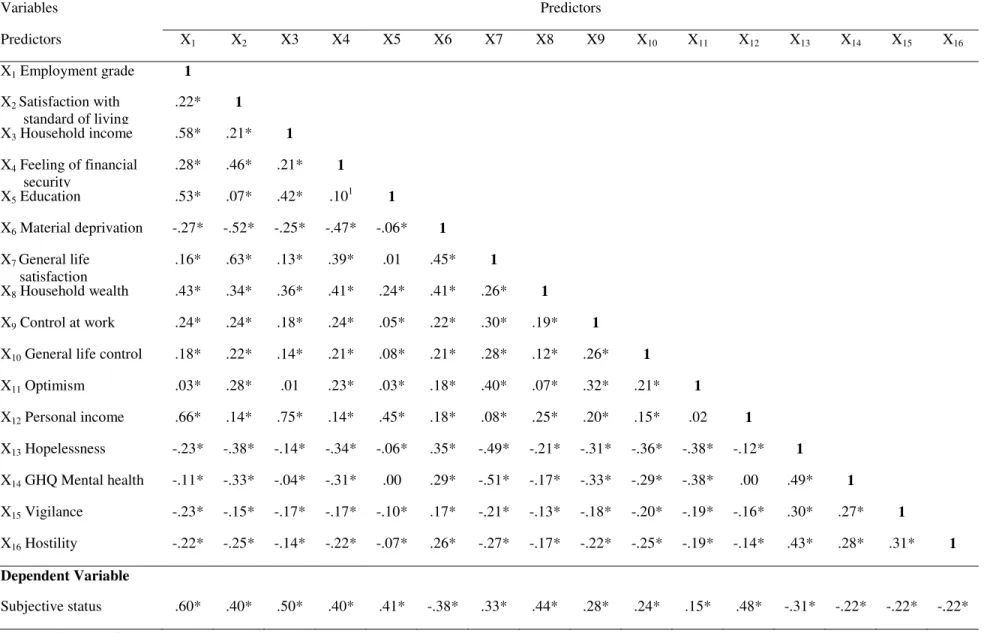
subjective status from a cluster of sixteen variables. Conceptually, these 16 predictor variables fall into four categories: conventional socioeconomic measures (occupation, personal income, education), measures of wealth (household income, household wealth, material deprivation), life satisfaction measures (feeling of financial security, satisfaction with standard of living, general life satisfaction), and psychological well-being measures (hopelessness, control at work, general life control, mental health, vigilance, hostility, and optimism). These 16 variables were chosen as predictors due to their high correlation with subjective status (see Table4). The inclusion of psychological variables in the prediction equation was intended to test whether the measure of subjective status used in this study was influenced by
psychological well-being.
Table 4 displays the correlations among the 16 predictor variables and their
correlations with the dependent variable. An examination of the correlation matrix reveals that some of the predictor variables are highly interrelated. Employment grade is strongly related to personal income (r = .66), household income (r = .58), and to education (r = .53).
Satisfaction with standard of living is closely related to general life satisfaction (r = .63) and material deprivation (r = -.52). The relationship between household income and personal income is also strong (r = .75). Although all predictor variables are significantly related to subjective status, employment grade (r = .60), household income (r = .50), personal income (r = .48) and household wealth (r = .44) show a particularly strong correlation.
The 16 predictor variables were used to find the best prediction equation for subjective status. Table 5 sets out the various stages of the regression analysis The first regression model with all 16 predictors was a good enough fit (R2adj. = 51%), with an overall significant relationship (F 16, 3246 = 210.78, p < .001). However, it is clear from Table 5 that the
model was very low. The goal of regression analysis here was to develop a subset of predictors useful in predicting subjective status while eliminating predictors that did not provide additional information to predictors already in the equation. A combination of backward elimination and stepwise method of variable selection was used in this study. This procedure allowed the contribution of variables to be tested at each step, leading to the removal of variable(s) that no longer made a significant independent contribution to the regression model. This is particularly important in the present analysis as the predictors are fairly strongly related to each other (Tabachnick & Fidell, 1989).
Table 5 shows that the first subset of variables to fall out of the initial stages of the analysis are the psychological variables (hopelessness, control at work, general life control, mental health, vigilance, hostility, and optimism). This obviously shows that psychological well-being is not an independent predictor of subjective status. Personal income also falls out of the regression equation, possibly because of the presence of household income to which it is strongly related (r = .75). The final model has five predictors - employment grade,
satisfaction with standard of living, household income, feeling of financial security, and education - accounting for 48% of the variance associated with subjective status.
As is clear from the table, R2 associated with the model with all 16 predictors is 3% higher than that of the final model. R2 is known to increase with the addition of more variables, it will continue to rise as more and more variables are added to the model. However, a model with many predictors is unstable and difficult to interpret. Overfitting occurs when too may predictors are included in the regression model, leading to the model performing poorly when applied to a new population. In our analyses, this is clearly reflected in the higher shrinkage rate associated with the model with all 16 predictors as compared to the final model. Cross-validation (70/30 split) using regression coefficients from the model
using the final 5 predictors leads to 0% shrinkage. This is undoubtedly a reflection of the stability of the final model.
The F statistic associated with all models (see table 5) is significant, implying that the predictors in the different models are useful in explaining the variation in the dependent variable. The F statistic associated with the final model is larger than the initial model mostly because of the increase in sample size related to less non-response on fewer variables in the model. The final model here accounts for 48% of the variance associated with subjective status. All five variables contributed significantly to the prediction of subjective status. The standardised regression coefficients (beta) indicate the importance of the contribution of each predictor to the model. Employment grade is the strongest predictor of subjective status in this sample.
Discussion
This study has shown the association between subjective status and health measures in a cohort of white-collar men and women. An individual’s subjective assessment of their social status, measured here by a one-item measure requiring individuals to place themselves on the social hierarchy, is a powerful predictor of their health status. The variation found in the magnitude of the association between subjective status and different health measures is similar in men and women, with the exception of respiratory illness in women where there is no social gradient.
The data presented suggest that there is a higher prevalence of angina, diabetes, respiratory illness (only in men), poor self-rated-health, and depression amongst individuals who rate themselves as having low social status as compared to those who see themselves as having higher status. The traditional method of measuring the relationship between social position and health has been to use classifications based on occupation, education or income. One of the questions that we addressed in this paper was whether the relationship between
subjective status and health could be explained by conventional measures of social position. The results show that occupational position completely accounts for the association between diabetes and subjective status in both men and women. Education in women and employment grade in men attenuates the subjective status and angina relationship considerably.
Educational achievement, employment grade, and income represent different aspects of social inequality, perhaps linked to different phases of the lifecourse. It is highly likely that their effect is mediated through different mechanisms. The results reported in this paper show that the same aspect of inequality is not involved to the same extent for all health outcomes and that different indicators of social position are not interchangeable. The remarkable aspect of the results relates to the fairly moderate attenuation brought about in the relationship between subjective status and two widely used health measures – poor self-rated health and depression. This is particularly true for women in this cohort. In fact, the adjustment for employment grade, education and income actually increases the gradient for depression in women.
The fact that adjustment for all conventionally employed measures of socioeconomic position does not lead to a complete attenuation in the association between subjective status and all the health measures examined in this study lead us to questions related to the particular nature of subjective status. The pathways by which subjective status might influence health are not yet known. It seems very likely that subjective status reflects an individual’s socio-cultural circumstance more fully than any of the other objective measures of social class. It is highly likely that the broad categorisation used in the commonly employed measures of social position miss individual information, whereas self placement of a 10-rung-ladder may allow the individual to take into account the special circumstances of his/her own life, leading to a more accurate portrayal of his/her social circumstances.
This leads us to one of the primary objectives of this paper – what does subjective status measure? There has been some research in the sociological field into the elements that govern an individual’s assessment of his/her subjective social class. Although this particular line of research had established subjective social class to incorporate both social and
economic aspects, little was known about the way in which subjective “status” as opposed to “class” would be determined. The question of measurement was made more pertinent due to the use of a relatively new measure of subjective status - a 10-point self-anchoring ladder.
Our analyses suggest a high degree of congruence between objective measures of socioeconomic position and subjective status. Subjective status shows strong and significant correlation with the conventional measures of objective status – employment grade,
education, and income – suggesting good validity of the measure. For conceptual clarity on the social causation and health selection debate, it was important to explore the contribution of the various measures of psychological functioning to subjective status. Multiple regression was set up to explicitly test this last statement - subjective social status was regressed on indicators of objective socioeconomic position, wealth measures, life satisfaction measures, and measures of psychological functioning.
The results from the regression analysis clearly show that people use mainly
socioeconomic criteria to assign themselves subjective status. Three of the five predictors of subjective status in this study are the conventional measures of socioeconomic position - employment grade, household income, and education. The other two predictors (satisfaction with standard of living, and feeling of financial security) reflect an assessment of current and future economic/material conditions. The importance of “feeling of financial security over the coming 10 years” is perhaps a reflection of the age of the participants (age range 45-69, mean age = 55.6 years).
Three models of subjective class identification have been advanced (Davis & Robinson, 1988). The independence model advocates individuals relying on their own characteristics to assess subjective status. In the sharing model, some of characteristics of the spouse are taken into consideration whereas in the borrowing model only the spouse’s characteristics define subjective status. The fact that household income instead of personal income remains in our regression model, reveals that the sharing model is being used by our participants to determine their subjective status. It is also likely that the use of household income is related to attempts at “status maximisation”, or attempts at a truer refection of their standard of living.
A further point of interest relating to the prediction of subjective status concerns the importance of education in determining subjective status. This is remarkable as the cohort in this study is middle-aged (mean age = 55.6 years), the completion of their formal education is likely to have occurred approximately 30 years previously. For education to have remained in the prediction equation points to the pertinent role that education plays in the way in which individuals perceive themselves. The results suggest that along with current and future prospects, subjective status is also determined by has an element of one’s past achievement. Educational achievement will be determined by several factors, aptitude of the individual and the socioeconomic/cultural environment in which the individual grew up being the most important.
This study suggests that assigning oneself subjective social status appears primarily to involve cognitive averaging of standard markers of socioeconomic position, while taking into account one’s assessment of current and future prospects. The results clearly show that this process is not driven by psychological biases as none of the elements of psychological functioning remain in the regression equation despite showing moderate correlation with subjective status. This result has wider implications for the health selection/reverse causation
hypothesis. The hypothesis that psychological status may determine social position rather than the reverse does not appear to be supported in this study.
As only half the variance in subjective status was reliably predicted in this study, questions as to the other predictors of subjective status remain open to research. It is likely that the dynamic nature of material circumstances and status will be important predictors of subjective social status. These dynamic aspects are likely to include gains through inheritance, rise in price of property owned, etc. The status component is likely to include prestige
elements: the kind of family one originates from, the kind of family one is married into, the nature of own or spouse’s profession, etc. It is plausible that subjective status reflects both changes in socioeconomic circumstances over the lifecourse and cumulative social position better than current employment grade. In future research it would be advisable to include both kinds of measures of social position. Repeated measures of social position over the lifecourse, both objective and subjective, will also enhance understanding of the social determinants of ill-health.
Although we have controlled for reporting bias in the first set of analysis and
explicitly tested the reverse causation hypothesis in the second set of analysis, there are some caveats to the conclusions drawn in this study. Self report, cross-sectional data are susceptible to biases associated with common method variance. When both the predictor and the outcome variable are measured on the same survey instrument at the same time, they share common method variance. The problem lies in determining whether observed covariance is attributable to valid relationships or common method variance. As this problem cannot be managed statistically, the solution lies in measuring the outcome and predictor variables separately. It may be useful to re-examine the ideas generated by this study prospectively.
Acknowledgements
The Whitehall II study has been supported by grants from the Medical Research Council; British Heart Foundation; Health and Safety Executive; Department of Health; National Heart Lung and Blood Institute (HL36310), US, NIH: National Institute on Aging (AG13196), US, NIH; Agency for Health Care Policy Research (HS06516); and the John D and Catherine T MacArthur Foundation Research Networks on Successful Midlife Development and
Socioeconomic Status and Health. MM is supported by an MRC Research Professorship. We also thank all participating civil service departments and their welfare, personnel, and establishment officers; the Occupational Health and Safety Agency; the Council of Civil Service Unions; all participating civil servants in the Whitehall II study; and all members of the Whitehall II study team.
References
Abbott, P. (1987). Women’s social class identification: Does husband’s occupation make a difference? Sociology 21, 91-103.
Adler, N., Epel, E. S., Castellazzo, G., & Ickovics, J. R. (2000). Relationship of subjective and objective social status with psychological and physiological functioning: Preliminary data in healthy white women. Health Psychology 19, 586-592.
Bartley, M., Sacker, A., Firth, D., & Fitzpatrick, R. (1999). Understanding social variation in cardiovascular risk factors in women and men: the advantage of theoretically based measures. Social Science & Medicine 49, 831-845.
Baxter, J. (1994). Is husband’ class enough? Class location and class identity in the United States, Sweden, Norway, and Australia. American Sociological Review 59, 220-235.
Beck, A. T., Weissman, A., Lester, D., & Trexler, L. (1974). The measurement of pessimism: The hopelessness scale. Journal of Consulting and Clinical Psychology 42, 861-865.
Blanchard, D., Sakai, R., McEwen, B., Weiss, S., & Blanchard, R. (1993).
Subordination stress: Behavioural, brain, and neuroendocrine correlates. Behavioural Brian Research 58, 113-121.
Cantril, H. (1965). The pattern of human concerns. New Brunswick, NJ: Rutgers University Press.
Cook, W. W., & Medley, D. M. (1954). Proposed hostility and Pharisaic values for the MMPI. The Journal of Applied Psychology 38, 414-418.
Davey Smith, G., Bartley, M., & Blane, D. (1990). The Black Report on socioeconomic inequalities 10 years on. British Medical Journal 301, 373-377.
Davis, J. A. (1956). Status symbols and the measurement of status perception. Sociometry 19, 154-165.
Davis, N. J. & Robinson, R. V. (1988). Class identification of men and women in the 1970s and 1980s. American Sociological Review 53, 103-112.
Evans, M. D. R., Kelley, J., Kolosi, T. (1992). Images of class: Public perceptions in Hungary and Australia. American Sociological Review 57, 461-482.
Fox, A. J. (1989). Health inequalities in European countries. Aldershot: Gower Publishing Company Limited.
Goldberg, D. P. (1972). The detection of psychiatric illness by questionnaire (Institute of Psychiatry Maudsley mongraphs No. 21). London: Oxford University Press.
Gough, H. G. (1949). A new dimension of status. III. Discrepancies between the ST scale and 2objective” status. American Sociological Review 14, 275-281.
Jackman, M. R. & Jackman, R. W. (1973). An interpretation of the relation between objective and subjective social status. American Sociological Review 38, 569-582.
Jackman, M. R. (1979). The subjective meaning of social class identification in the United States. Public Opinion Quarterly 43, 443-462.
Kaplan, G. A., Pamuk, E. R., Lynch, J. W., Cohen, R. D., & Balfour, J. L. (1996). Inequality in income and mortality in the United States: analysis of mortality and potential pathways. British Medical Journal 312, 999-1003.
Kaplan, J. & Manuck, S. (1999). Status, stress, and artherosclerosis. Annals of the New York Academy of Sciences. New York, Vol. 896, p. 145-161.
Kawachi, I. & Kennedy, B. P. (1997). Socioeconomic determinants of health. Health and social cohesion: Why care about income inequality? British Medical Journal 314, 1037-1040.
Kennedy, B. P., Kawachi, I., & Prothrow-Stith, D. (1996). Income distribution and mortality: cross sectional ecological study of the Robin Hood index in the United States. British Medical Journal 312, 1004-1007.
Kluegel, J. R., Singleton, R., & Starnes, C. E. (1977). Subjective class identification: a multiple indicator approach. American Sociological Review 42, 599-611.
Lynch, J. W., Davey Smith, G., Kaplan, G. A., & House, J. S. (2000). In come inequality and mortality: importance to health of individual income, psychosocial environment, or material conditions. British Medical Journal 320, 1200-1204.
Mackenbach, J. P., Kunst, A. E., Cavelaars, A. E. J. M., Groenhof, F., Geurts, J. J. M., & the EU working group on socioeconomic inequalities in health. (1997). Socioeconomic inequalities in morbidity and mortality in Western Europe. The Lancet 349, 1655-1659.
MacIntyre, S. (1997). The Black Report and beyond: What are the issues? Social Science and Medicine 44, 723-745.
Mackenbach, J. P. & Kunst, A. E. (1997). Measuring the magnitude of socio-economic inequalities in health: An overview of available measures illustrated with two examples from Europe. Social Science & Medicine 44, 757-771.
Marmot, M. & Wilkinson, R. G. (Eds.). (1999). Social determinants of health. Oxford: Oxford University Press.
Marmot, M. & Wilkinson, R. G. (2001). Psychosocial and material pathways in the relation between income and health: a response to Lynch et al. British Medical Journal 322, 1233-1236.
Marmot, M. G. & Shipley, M. J. (1996). Do socioeconomic differenecs in mortality persist after retirement? 25 year follow up of civil servants from the first Whitehall study. British Medical Journal 313, 1177-1180.
Marmot, M. G., Davey Smith, G., Stansfeld, S., Patel, C., North, F., Head, J., White, I., Brunner, E., & Feeney, A. (1991). Health inequalities among British civil servants: the Whitehall II study. The Lancet 337, 1387-1393.
Medical Research Council (1965). Definition and classification of chronic bronchitis for epidemiological purposes. Lancet i, 775-779.
Ostrove, J. M., Adler, N. E., Kuppermann, M., Washington, A. E. (2000). Objective and subjective assessments of socioeconomic status and their relationship to self-rated health in an ethnically diverse sample of pregnant women. Health Psychology 19, 614-618.
Ritter, K. V. & Hargens, L. L. (1975). Occupational positions and class identifications of married working women: A test of the asymmetry hypothesis. American Journal of
Sociology 80, 934-948.
Rose, G. A., Blackburn, H., Gillum, R. F., & Prinneas, R. J. (1982). Cardiovascular survey methods. Geneva, Switzerland: World Health Organization.
Sapolsky, R. (1982). The endocrine stress-response and social status in the wild baboon. Hormones and Behaviour 15, 279-292.
Stansfeld, S. A., North, F. M., White, I., & Marmot, M. G. (1995). Work
characteristics and psychiatric disorder in civil servants in London. Journal of Epidemiology & Community Health 49, 48-53.
Tabachnick, B. G. & Fidell, L. S. (1989). Using multivariate statistics (2nd ed.). New York: Harper Collins Publishers.
Townsend, P., Davidson, N., & Whitehead, M. (1992). Inequalities in Health: The Black Report and the Health Divide. London: Penguin Books.
Wilkinson, R. G. (1992). Income distribution and life expectancy. British Medical Journal 304, 165-168.
Appendix 1: Measure of Subjective Status – The Ladder
Participants were given the drawing of a ladder with the following instructions: “Think of this ladder as representing where people stand in society. At the top of the ladder are the people who are best off –those who have the most money, most education and the best jobs. At the bottom are the people who are worst off – who have the least money, least education and the worst jobs or no job. The higher up you are on this ladder, the closer you are to people at the very top and the lower you are , the closer you are to the bottom. Where would you put yourself on the ladder? Please place a large ‘X’ on the rung where you think you stand.”
Table 1: Age-adjusted prevalence (%) of ill-health according to subjective status
Sex Subjective status ranka Total Trend
1 & 2 3 & 4 5 & 6 7 & 8 9 & 10 N
Number M F 267 187 1918 991 1732 872 627 293 65 29 4609 2372 Angina M F 3.60 2.29 3.98 3.02 5.38 4.68 6.52 6.15 9.53 0.00 227 89 p=.001 p=.019 Diabetes M F 0.34 2.66 2.27 2.25 3.12 3.04 3.46 6.41 4.13 6.67 126 70 p=.002 p=.004 Respiratory illness M F 7.21 8.90 6.54 6.42 9.24 7.47 10.30 11.00 21.67 10.23 377 179 p=.001 p=.163 Perceived general health M
F 4.70 4.21 9.14 8.34 15.72 12.84 26.67 24.64 45.12 44.33 646 287 p=.001 p=.001 GHQ depression M F 10.52 3.99 8.79 7.84 15.29 13.10 22.89 24.50 42.76 47.75 611 284 p=.001 p=.001 a
Table 2: Relative Index of Inequality (RII) of subjective status (ladder) on ill-health, adjusted for employment grade, education and income in mena b
Ladder Model A, Model A, Model A, Model A,
(Model A) adjusted for grade adjusted for education adjusted for income adjusted for grade, education & income
RII (95% C.I.) RII (95% C.I.) RII (95% C.I.) RII (95% C.I.) RII (95% C.I.)
Angina 1.98 (1.19-3.28) 1.24 (0.67-2.29) 1.52 (0.84-2.75) 1.42 (0.81-2.50) 1.00 (0.51-1.94) % reduction in RII 71% 47% 57% 100% Reduction in deviance, df, p 7.09, 1, p = .008 6.86, 1, p = .009 3.70, 1, p = .054 5.60, 1, p = .018 11.16, 3, p =. 011 Diabetes 2.23 (1.13-4.38) 0.95 (0.42-2.15) 3.99 (1.78-8.92) 1.41 (0.66-3.02) 1.57 (0.63-3.93) % reduction in RII 104% -143% 67% 54% Reduction in deviance, df, p 5.46, 1, p = .019 14.54, 1, p = .001 2.89, 1, p = .089 5.83, 1, p = .016 21.40, 3, p = .001 Respiratory illness 1.71 (1.14-2.54) 1.31 (0.80-2.13) 1.43 (0.91-2.25) 1.56 (0.99-2.45) 1.14 (0.68-1.92) % reduction in RII 56% 39% 21% 80% Reduction in deviance, df, p 6.90, 1, p = .009 3.06, 1, p = .080 2.18, 1, p = .139 0.54, 1, p = .463 4.99, 3, p = .173
Perceived general health 4.16 (2.97-5.83) 2.69 (1.80-4.03) 3.51 (2.38-5.18) 3.12 (2.14-4.55) 2.28 (1.47-3.56)
% reduction in RII 47% 21% 33% 60% Reduction in deviance, df, p 71.33, 1, p = .001 13.50, 1, p = .001 0.03, 1, p = .864 12.81, 1, p = .001 16.44, 3, p = .001 GHQ depression 1.78 (1.25-2.53) 1.40 (0.92-2.14) 1.80 (1.20-2.70) 1.71 (1.14-2.55) 1.48 (0.93-2.35) % reduction in RII 49% -3% 9% 39% Reduction in deviance, df, p 10.42, 1, p = .001 5.22, 1, p = .022 1.24, 1, p = .265 0.58, 1. p = .446 8.57, 3, p = .039 a
Adjusted for age (5-year categories) and reporting bias (general life satisfaction measure)
b
Table 3: Relative Index of Inequality (RII) of subjective status (ladder) on ill-health, adjusted for employment grade, education and income in womena b
Ladder Model A, Model A, Model A, Model A,
(Model A) adjusted for grade adjusted for education adjusted for income adjusted for grade, education & income
RII (95% C.I.) RII (95% C.I.) RII (95% C.I.) RII (95% C.I.) RII (95% C.I.)
Angina 2.10 (0.92-4.76) 1.62 (0.57-4.67) 1.08 (0.41-2.86) 1.36 (0.53-3.51) 0.86 (0.28-2.60) % reduction in RII 44% 93% 67% 113% Reduction in deviance, df, p 3.18, 1, p = .075 0.59, 1, p = .443 3.51, 1, p = .061 3.03, 1, p = .082 5.62, 3, p = .132 Diabetes 2.90 (1.15-7.30) 1.02 (0.32-3.32) 1.91 (0.64-5.71) 2.48 (0.84-7.28) 0.88 (0.25-3.14) % reduction in RII 99% 52% 22% 106% Reduction in deviance, df, p 5.23, 1, p = .022 7.61, 1, p = .006 2.06, 1, p = .152 0.20, 1, p = .652 10.33, 3, p = .016 Respiratory illness 1.00 (0.56-1.77) 0.58 (0.28-1.23) 0.74 (0.37-1.48) 0.94 (0.48-1.85) 0.62 (0.28-1.38) % reduction in RII Reduction in deviance, df, p 0.00, 1, p = 1.00 5.13, 1, p = .024 3.18, 1, p = .075 0.27, 1, p = .603 6.07, 3, p = .108
Perceived general health 3.76 (2.27-6.22) 3.21 (1.70-6.10) 3.36 (1.86-6.09) 3.51 (1.95-6.32) 3.37 (1.69-6.72)
% reduction in RII 20% 15% 9% 14% Reduction in deviance, df, p 27.70, 1, p = .001 0.62, 1, p = .431 0.17, 1, p = .698 0.35, 1, p = .554 0.37, 3, p = .946 GHQ depression 2.65 (1.58-4.43) 3.24 (1.67-6.29) 4.29 (2.34-7.87) 3.06 (1.67-5.64) 4.55 (2.24-9.26) % reduction in RII -36% -99% -25% -115% Reduction in deviance, df, p 13.99, 1, p = .001 0.95, 1, p = .329 6.04, 1, p = .014 0.67, 1, p = .412 6.27, 3, p = .099 a
Adjusted for age (5-year categories) and reporting bias (general life satisfaction measure)
b
Table 4: Correlation matrix for relationship among predictors and that between predictors and subjective status Variables Predictors Predictors X1 X2 X3 X4 X5 X6 X7 X8 X9 X10 X11 X12 X13 X14 X15 X16 X1 Employment grade 1 X2 Satisfaction with standard of living .22* 1 X3 Household income .58* .21* 1 X4 Feeling of financial security .28* .46* .21* 1 X5 Education .53* .07* .42* .101 1 X6 Material deprivation -.27* -.52* -.25* -.47* -.06* 1 X7 General life satisfaction .16* .63* .13* .39* .01 .45* 1 X8 Household wealth .43* .34* .36* .41* .24* .41* .26* 1 X9 Control at work .24* .24* .18* .24* .05* .22* .30* .19* 1
X10 General life control .18* .22* .14* .21* .08* .21* .28* .12* .26* 1
X11 Optimism .03* .28* .01 .23* .03* .18* .40* .07* .32* .21* 1 X12 Personal income .66* .14* .75* .14* .45* .18* .08* .25* .20* .15* .02 1 X13 Hopelessness -.23* -.38* -.14* -.34* -.06* .35* -.49* -.21* -.31* -.36* -.38* -.12* 1 X14 GHQ Mental health -.11* -.33* -.04* -.31* .00 .29* -.51* -.17* -.33* -.29* -.38* .00 .49* 1 X15 Vigilance -.23* -.15* -.17* -.17* -.10* .17* -.21* -.13* -.18* -.20* -.19* -.16* .30* .27* 1 X16 Hostility -.22* -.25* -.14* -.22* -.07* .26* -.27* -.17* -.22* -.25* -.19* -.14* .43* .28* .31* 1 Dependent Variable Subjective status .60* .40* .50* .40* .41* -.38* .33* .44* .28* .24* .15* .48* -.31* -.22* -.22* -.22*
Table 5: Multiple Regression models predicting subjective statusa
Variables Regression models
1 2 3 4 5 6 7 8 9
β β β β β β β β β
Employment grade .30*** .31*** .33*** .32*** .32*** .31*** .33*** .33*** .34*** Satisfaction with standard of living .13*** .13*** .13*** .13*** .13*** .12*** .13*** .18*** .22*** Household income .10*** .10*** .12*** .12*** .12*** .16*** .16*** .16*** .17*** Feeling of financial security .09*** .09*** .09*** .10*** .10*** .12*** .13*** .14*** .16*** Education .15*** .15*** .15*** .15*** .15*** .14*** .14*** .13*** .13*** Material deprivation -.07*** -.07*** -.07*** -.08*** -.08*** -.08*** -.09*** -.10***
General life satisfaction .06** .06*** .06** .07*** .08*** .09*** .09*** Household wealth .08*** .10*** .08*** .07*** .07*** .08***
Control at work .04** .04** .04** .04*** .05*** General life control .04** .04*** .04*** .05***
Optimism .03 .03* .03* Personal income .05* .04 Hopelessness -.01 GHQ Mental health -.02 Vigilance -.02 Hostility -.01 Shrinkage 4% 4% 3% 3% 3% 2% 2% 1% 0% R2 Adjusted 51% 51% 51% 51% 51% 50% 49% 49% 48% Model Fb 210.78 307.85 337.24 372.39 410.45 641.61 723.71 823.13 970.08 N 3262 3505 3512 3530 3542 5151 5212 5226 5233 *** p <.001 ** p< .01 * p< .05