HAL Id: hal-01372565
https://hal.sorbonne-universite.fr/hal-01372565
Submitted on 27 Sep 2016
HAL is a multi-disciplinary open access archive for the deposit and dissemination of sci-entific research documents, whether they are pub-lished or not. The documents may come from teaching and research institutions in France or abroad, or from public or private research centers.
L’archive ouverte pluridisciplinaire HAL, est destinée au dépôt et à la diffusion de documents scientifiques de niveau recherche, publiés ou non, émanant des établissements d’enseignement et de recherche français ou étrangers, des laboratoires publics ou privés.
Distributed under a Creative Commons Attribution - NonCommercial - ShareAlike| 4.0
Laurent Pinelli, Antoine Nissant, Aurélie Edwards, Stéphane Lourdel, Jacques
Teulon, Marc Paulais
To cite this version:
Laurent Pinelli, Antoine Nissant, Aurélie Edwards, Stéphane Lourdel, Jacques Teulon, et al.. Dual regulation of the native ClC-K2 chloride channel in the distal nephron by voltage and pH. Journal of General Physiology, Rockefeller University Press, 2016, 148 (3), pp.213-226. �10.1085/jgp.201611623�. �hal-01372565�
The Rockefeller University Press $30.00 J. Gen. Physiol. 2016 Vol. 148 No. 3 213–226
I N T R O D U C T I O N
It is widely acknowledged that ClC-Kb in humans (ClC-K2 in rodents), in association with the regulatory sub-unit barttin, is the main basolateral chloride channel in the distal nephron and is therefore of prime impor-tance in NaCl absorption, body salt homeostasis, and possibly long-term blood pressure regulation (Jentsch, 2008; Fahlke and Fischer, 2010; Staruschenko, 2012; Eladari et al., 2014; Andrini et al., 2015; Sepúlveda et al., 2015). Bartter’s syndrome type III, a rare salt- and potassium-losing tubulopathy that targets the thick as-cending limb (TAL) and the distal convoluted tubule (DCT), is caused by loss-of-function CLC KNB muta-tions leading to impairment of NaCl balance and hypo-kalemic metabolic alkalosis (Krämer et al., 2008; Stölting et al., 2014; Andrini et al., 2015). The recent description of a severe Bartter’s syndrome in Clcnk2−/− mice ascertained that ClC-K2 plays a similar role in the mouse (Hennings et al., 2016).
Although the ClC family of chloride channels and transporters to which the ClC-K channels belong has been extensively studied from a biophysical standpoint (Pusch et al., 1999; Pusch, 2004; Chen, 2005), this is not
the case for ClC-K channels because their expression in heterologous systems, especially that of ClC-K2 (Kief-erle et al., 1994; Waldegger and Jentsch, 2000; Fahlke and Fischer, 2010), remains difficult to achieve (Estévez et al., 2001; Waldegger et al., 2002; Gradogna et al., 2010). ClC-K channels display a feature unique among ClC isoforms in that their activity increases with extra-cellular Ca2+ and pH (Estévez et al., 2001; Waldegger et
al., 2002; Gradogna et al., 2010, 2012; Andrini et al., 2014). In addition, ClC-K channels share the unique double-barreled architecture of ClC channels with two independent ion conduction pores. However, they lack the characteristic glutamate residue involved in the pro-topore gate mechanism of ClC channels, and their gat-ing is probably dominated by the common gate (Pusch, 2004; Jentsch, 2008; Stölting et al., 2014).
It has not been possible yet to study recombinant ClC-K2 or ClC-Kb at the single-channel level (Fahlke and Fischer, 2010; Stölting et al., 2014). Patch clamp studies on basolateral membranes of mouse renal tu-bules identified an ∼10-pS Cl− channel in the DCT, in
the intercalated cells of the connecting tubule (CNT) and cortical collecting duct (CCD; Lourdel et al., 2003;
ClC-K2, a member of the ClC family of Cl− channels and transporters, forms the major basolateral Cl−
conduc-tance in distal nephron epithelial cells and therefore plays a central role in renal Cl− absorption. However, its
regulation remains largely unknown because of the fact that recombinant ClC-K2 has not yet been studied at the single-channel level. In the present study, we investigate the effects of voltage, pH, Cl−, and Ca2+ on native
ClC-K2 in the basolateral membrane of intercalated cells from the mouse connecting tubule. The ∼10-pS channel shows a steep voltage dependence such that channel activity increases with membrane depolarization. Intracel-lular pH (pHi) and extracellular pH (pHo) differentially modulate the voltage dependence curve: alkaline pHi
flat-tens the curve by causing an increase in activity at negative voltages, whereas alkaline pHo shifts the curve toward
negative voltages. In addition, pHi, pHo, and extracellular Ca2+ strongly increase activity, mainly because of an
increase in the number of active channels with a comparatively minor effect on channel open probability. Further-more, voltage alters both the number of active channels and their open probability, whereas intracellular Cl− has
little influence. We propose that changes in the number of active channels correspond to them entering or leav-ing an inactivated state, whereas modulation of open probability corresponds to common gatleav-ing by these chan-nels. We suggest that pH, through the combined effects of pHi and pHo on ClC-K2, might be a key regulator of
NaCl absorption and Cl−/HCO
3− exchange in type B intercalated cells.
Dual regulation of the native ClC-K2 chloride channel in the distal
nephron by voltage and pH
Laurent Pinelli,1,2,3,4* Antoine Nissant,1,2,3,4* Aurélie Edwards,1,2,3,4 Stéphane Lourdel,1,2,3,4 Jacques Teulon,1,2,3,4 and Marc Paulais1,2,3,4
1Sorbonne Universités, Université Pierre-et-Marie-Curie Paris 06, 2Institut National de la Santé et de la Recherche Médicale,
and 3Université Paris Descartes, Sorbonne Paris Cité, UMR_S 1138, Centre de Recherche des Cordeliers, F-75006 Paris, France 4Centre National de la Recherche Scientifique ERL 8228, Centre de Recherche des Cordeliers, F-75006 Paris, France
© 2016 Pinelli et al. This article is distributed under the terms of an Attribution– Noncommercial–Share Alike–No Mirror Sites license for the first six months after the publication date (see http ://www .rupress .org /terms). After six months it is available under a Creative Commons License (Attribution–Noncommercial–Share Alike 3.0 Unported license, as described at http ://creativecommons .org /licenses /by -nc -sa /3 .0 /).
*L. Pinelli and A. Nissant contributed equally to this paper. Correspondence to Jacques Teulon: jacques.teulon@upmc.fr
A. Nissant’s present address is Centre National de la Recherche Scientifique UMR3571, Institut Pasteur, 75015 Paris, France.
Abbreviations used: CCD, cortical collecting duct; CNT, connecting tubule; DCT, distal convoluted tubule; TAL, thick ascending limb.
The Journal of General Physiology
on August 30, 2016
jgp.rupress.org
Downloaded from
Supplemental Material can be found at:
on August 30, 2016 jgp.rupress.org Downloaded from on August 30, 2016 jgp.rupress.org Downloaded from on August 30, 2016 jgp.rupress.org Downloaded from on August 30, 2016 jgp.rupress.org Downloaded from on August 30, 2016 jgp.rupress.org Downloaded from
Nissant et al., 2004, 2006; Teulon et al., 2005) and, more recently, in the TAL (Hennings et al., 2016). The channel was highly sensitive to intracellular pH (pHi)
and inhibited by PKC but insensitive to PKA (Lourdel et al., 2003). It required ATP for maintaining its activity in the inside-out configuration and was present at high density in membrane patches (Lourdel et al., 2003; Nissant et al., 2004, 2006). We considered the ∼10-pS Cl− channel as a likely ClC-K2 candidate because it
dis-played an anionic selectivity sequence and sensitivity to external Ca2+ and pH similar to that of ClC-Kb. In fact,
recent patch-clamp analysis revealed the complete
ab-sence of the ∼10 pS Cl− channel in Clcnk2−/− mice,
giving a direct proof of its molecular identity (Hen-nings et al., 2016).
The objective of the present study was to examine in detail how classical modulators of ClC and ClC-K chan-nels (Miller and White, 1980; Rychkov et al., 1996; Pusch et al., 1999; Chen and Chen, 2001; Fahlke, 2001),
i.e., membrane voltage, pHi and extracellular pH
(pHo), extracellular Ca2+, and intracellular Cl− might
modulate native ClC-K2 activity. Our results first show that the native ClC-K2 is voltage dependent, a property not yet recognized in recombinant ClC-Kb/K2 chan-nels, and activates upon membrane depolarization via an increase in the number of active channels and to a lesser extent in the open probability. Dependence on voltage is differentially modulated by pHi and pHo in
such a way that channel activity synergistically increases with pH around resting membrane voltage. Second, we report that an elevation in pHi, as well as in external
calcium and pH, increases ClC-K2 activity mainly via the modulation of the number of active channels. There-fore, we propose that powerful pH-dependent pro-cesses modulate the main pathway for basolateral Cl− exit from cells along the distal nephron, and hence
renal NaCl transport, by controlling the number of active channels.
M AT E R I A L S A N D M E T H O D S Isolation of renal tubules
The experiments were conducted according to the standards of the Veterinary Department of the French Ministry of Agriculture, and procedures were ap-proved by the Ethics Committee at the Pierre and Marie Curie University (agreement Ce5/2011/040). Tissue preparation was as previously described (Nis-sant et al., 2006). In brief, 15–20-g male mice (Charles River) were killed by cervical dislocation, and the left kidney was perfused with Leibovitz’s L-15 medium (Sigma-Aldrich) supplemented with 300 U/ml Worth-ington CLS-2 collagenase (Coger) before removal. Small pieces of cortex were incubated at 37°C for 30–60 min in the collagenase-containing medium, rinsed, and kept at 4°C until use.
Solutions and chemicals
Patch pipettes were filled with a solution containing
(mM) 145 NMDG-Cl, 1 MgCl2, and 10 HEP ES and
ad-justed to pH 7.0–7.8 using NMDG. For adjustment to pH 6.6, 10 mM Mes was substituted for HEP ES. Pipette solution calcium content was set by adding appropri-ate amounts of CaCl2. The tubules were initially bathed
in physiological saline containing (mM) 140 NaCl, 5 KCl, 1 CaCl2, 1 MgCl2, 10 glucose, and 10 HEP ES and
adjusted to pH 7.4 with NaOH. NMDG-Cl was substi-tuted for NaCl in the Na+-free solution used for
deter-mination of the number of channels in cell-attached patches (see below in Data analysis section). Mem-brane patches were excised into a solution containing
(mM) 145 NMDG-Cl, 1 MgCl2, and 10 glucose and
buffered with either 10 HEP ES or 10 Trizma base for adjustment to pH 7.0–7.8 or pH 8.2, respectively, using
NMDG. When necessary, internal Cl− concentrations
ranging from 7 to 147 mM were obtained by using the appropriate amount of NMDG-Cl and by adjusting os-molarity with sucrose. In the inside-out configuration,
2 mM EGTA (no Ca2+ added) and 0.5–1 mM Mg-ATP
(Sigma-Aldrich) were added to the perfusion solutions to partially prevent rundown (Lourdel et al., 2003; Nis-sant et al., 2006). Usually, an important fraction of the channels in the patch membrane underwent rapid rundown after excision from the cell, but the remain-ing channels could be recorded for long periods of time (5–20 min) provided that ATP was present in the internal solution.
Current recordings
Patch pipettes were pulled from Harvard Apparatus GC150T borosilicate glass (Phymep) by a P-97 puller (Sutter Instrument), coated with SYL GARD, and heat polished. Single-channel currents were amplified with a List LM-EPC7 or a Bio-logic RK 400 patch-clamp ampli-fier, filtered at 300 or 500 Hz by a LPBF-48DG 8-pole Bessel filter (NPI Electronic), and digitized at a sam-pling rate of 1–2 kHz using DIG IDA TA 1322A or 1440A analogue to digital converters and P-CLA MP software (Axon Instruments) for online monitoring and record-ing. All experiments were performed at room tem-perature (22–27°C).
Data analysis
Stretches of data of 30-s to 1-min duration were ana-lyzed for each condition. Channel activity on a patch was determined by the time-averaged Cl− current
pass-ing through the patch (<I>), takpass-ing the closed channel current level as reference, divided by the unitary cur-rent amplitude i. This method assumes that all the chloride channels present in the membrane patch be-have in the same homogenous way. The high number of channels per patch and the slow channel kinetics with open and closed times in the second range
on August 30, 2016
jgp.rupress.org
del et al., 2003) often precluded the determination of the closed current level by visual inspection of the re-cording, and inhibition of channel activity was there-fore required. In cell-attached patches, this was obtained by the lowering of pHi under tubule
superfu-sion with a Na+-free solution supplemented with either
0.25 mM N-ethylmaleimide (Sigma-Aldrich; Nissant et al., 2006) or 20 mM sodium acetate (Lourdel et al., 2003). A long delay of 1–5 min in these conditions was usually needed to reach a plateau for the minimum current level. In the inside-out configuration, the closed level was determined under low pH bath solu-tion or at the end of recording when channel activity had sufficiently run down. Routinely, our experimental sequences lasted 20–30 s.
In this study, we suggest that variations in the number of active channels involve very slow gating processes (>20 s), whereas variations in open probability (Po)
con-cern more rapid opening/closing events (still in the second range). In other words, modulation of the num-ber of active channels might be caused by channels en-tering or leaving an inactivated state, whereas modulation of the open probability might stem from more rapid oscillations between open and closed states. Accordingly, we defined N′ as the number of active channels in a given experimental condition as N′ = N * Po slow, where N is the absolute number of channels on
the patch (an unknown parameter) and Po slow
rep-resents the open probability caused by kinetic processes >20–30 s (also an unknown parameter). Experimen-tally, N′ represents the highest number of simultane-ously open channels during one experimental sequence. N′ was determined by either visual inspec-tion of patches containing only few levels of currents or by measuring the peak current amplitude, subtracting the closed current level, and dividing by the single channel current amplitude i. Thus, in the following, we use the equation I/i = N′ * Po to calculate Po.
We checked the accuracy of this evaluation by inde-pendently estimating Po and N′ using stationary noise
analysis (Gray, 1994). Here, the determination of the variance of the current (σ2) in each stretch of data
en-abled the calculation of Po and N′ according to the
equations 1 − Po = σ2/(<I> * i) and N′ = <I>/(i * Po).
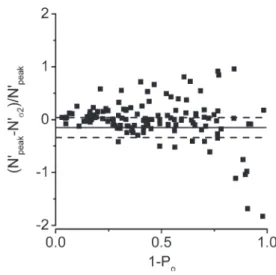
The relative difference in N′ deduced from the peak (N′peak) and variance (N′σ2) methods ((N′peak − N′σ2)/
N′peak) was then plotted versus 1 − Po (Fig. S1). Only
recordings yielding ΔN′/N′ values within a 95% agree-ment interval were included in this analysis (Bland and Altman, 1999). As emphasized by several authors, the number of channels along a stretch of recording can be underestimated; in the meantime, it has the advantage of being a direct measurement (Pácha et al., 1993; Col-quhoun and Hawkes, 1995).
N′Po/V data points were fitted by Boltzmann’s
function:
Y = ___________Y min − Y max
1 + e ( V− V 1 ⁄ 2 ) /K + Y min,
where V is a given membrane potential difference, V1/2
is the potential difference yielding a half-maximal re-sponse, Ymin and Ymax are the minimum and maxi-mum N′Po values, respectively, and K is the logarithmic
sensitivity indicating an e-fold increase in membrane potential difference. OriginLab Corporation ORI GIN software (Ritme Informatique) was used to fit the data points to equations.
P-CLA MP–generated amplitude histograms were fit-ted by a multiple peak Gaussian function using ORI GIN software, and the area of each component (k) relative to the total area of the n components was used to calcu-late its open probability, P(k). P(k) values were then
com-pared with the distribution of k simultaneously open independent channels predicted by a binomial distribu-tion, according to the equation
P (k) = _______k ! ( n − k n ! ) ! P ok ( 1 − P o ) n−k .
Mathematical model of type B intercalated cells
The mathematical model of the type B intercalated cell is based on steady-state conservation equations for mass and charge, following the approach of Weinstein (2001). These equations yield the intra-cellular volume, electric potential, and the concen-trations of 12 solutes as a function of external conditions. Our CCD model differs from that of Weinstein (2001) in that it accounts for the NaCl transport pathway in type B intercalated cells de-scribed by Eladari and colleagues (Leviel et al., 2010; Chambrey et al., 2013). Thus, in contrast with the Weinstein (2001) model, our model considers the
presence of apical Na+-dependent Cl−/HCO
3−
ex-changers (NDB CE), and it assumes that basolateral AE4 transporters, the transport properties of which
remain controversial, operate as Na+-HCO
3−
cotrans-porters (with a Na+/HCO
3− stoichiometry of 1:3 as
required for a sodium extruder) and that the
baso-lateral permeability to HCO3− is zero. The
simula-tions performed in this study correspond to
asymmetrical conditions, that is, with 144 mM Na+,
4 mM K+, and 118 mM Cl− in the peritubular
solu-tion, pH 7.4, and 75 mM Na+, 15 mM K+, and 75 mM
Cl− in the lumen, pH 7.04.
Statistics
Results are given as means ± SEM for the indicated number of measurements (n). Statistical significance of difference between means of groups was evaluated by either Student’s t test or by one-way ANO VA, when ap-propriate, using Systat SIG MAS TAT software (Ritme In-formatique). P < 0.05 was considered significant.
on August 30, 2016
jgp.rupress.org
Online supplemental material
Fig. S1 compares the results from peak current and sta-tionary noise analysis methods for the estimation of the number of active ClC-K2 channels on patches. Fig. S2 illustrates ClC-K2 channel conductive properties and voltage dependence in the cell-attached configuration. Fig. S3 shows ClC-K2 sensitivity to intracellular chloride. Fig. S4 depicts the variations in N′ and Po induced by
changes in pHo and Ca2+o. Table S1 summarizes
sin-gle-channel conductive properties under various pHi,
pHo, and [Ca2+]o conditions.
R E S U LT S
We previously showed that a small-conductance Cl−
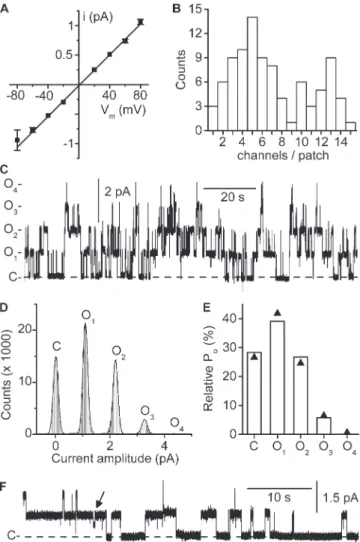
channel was densely present in the basolateral mem-branes of the TAL, DCT, and the intercalated cells of the CNT/CCD (Lourdel et al., 2003; Nissant et al., 2004, 2006). As anticipated (Lourdel et al., 2003; Teu-lon et al., 2005), recent work has demonstrated that this channel is formed by ClC-K2 (Hennings et al., 2016). In the present study on CNT intercalated cells, the channel displayed a unitary conductance of ∼10 pS (Fig. 1 A and Table S1), in agreement with previous re-sults (Nissant et al., 2006). We observed 1–14 channels in the inside-out configuration at pH 7.4 (Fig. 1 B), but the number of channels can be considerably higher at more alkaline pH (see below Fig. 3). Even and odd numbers of equally spaced current (10-pS conduc-tance) levels were observed (Fig. 1 B). If the observed ClC-K2 currents levels reflected the openings of inde-pendently gated protopores, an even number of con-ductance states should have been observed (Fischer et al., 2010; Stölting et al., 2014). A typical current trace of native ClC-K2 in a cell-excised inside-out patch from CNT intercalated cells bathed in symmetrical NMDG-Cl− solutions is shown in Fig. 1 C. Current
lev-els were equidistant (Fig. 1 D) and followed a binomial distribution (Fig. 1 E), again suggesting that protopore gating was not detected in this channel. Half-openings probably representing openings/closings of the pro-topore (Lourdel et al., 2003) could be detected from time to time but were generally brief, except at the end of long recordings when channels were inactivat-ing (Fig. 1 F). Altogether, the 10-pS conductance most probably reflects oscillations of the ClC-K2 dimeric structure, indicating that channel gating is dominated by the common gate.
Native ClC-K2 channel activity is highly dependent on voltage
One objective of this study was to investigate whether native ClC-K2 is sensitive to voltage. We first addressed this issue in inside-out patches by systematically quanti-fying channel activity at various membrane voltages and observed that patch currents dramatically increased at
Figure 1. Conductive properties of the native ClC-K2
chan-nel. Experiments were performed on cell-excised inside-out
membrane patches under symmetrical NMDG-Cl conditions. Pipette solution contained 5 mM Ca2+, and pipette and bath
pH were set to 7.4. (A) Mean i/Vm relationship. Each point is
the mean of 12 determinations, and SEM is shown as error bars when larger than symbols. The straight line is a linear fit of mean data points yielding a conductance of 13 ± 0.2 pS and a reversal potential of 1.7 ± 0.7 mV (R2 = 0.998). (B) Channel
density distribution. The maximum number of active channels per patch was determined by peak current measurement, at Vm 80 mV (92 patches). Note the even and odd numbers of
channels/patch. (C) Continuous channel recording at Vm 80 mV.
The dashed line indicates the closed channel current level (C-), and O1- to O4- indicate the current levels
correspond-ing to the opencorrespond-ing of one to four channels. (D) Point-ampli-tude histogram of the recording shown in C (0.05 pA bins). For clarity, the closed channel current level was subtracted. The continuous line is a nonlinear least square 5-term Gauss-ian fit of amplitude distribution data yielding peaks of 0.009 ± 0.001 pA (C), 1.09 ± 0.001 pA (O1), 2.2 ± 0.001 pA (O2), 3.3
± 0.006 pA (O3), and 4.4 pA (O4; R2 = 0.997). (E) Probabilities
of the channel current states in the recording shown in C. The measured state probabilities (bars) are shown together with the probability values predicted by a binomial distribution (▲; see Materials and methods) with k = 5 current levels includ-ing baseline and Po = 0.282. (F) Continuous recording from a
patch with only two apparent active channels. The dashed line indicates the closed channel current level (C-). Note the infre-quent short-lived subconductance state (arrow).
on August 30, 2016
jgp.rupress.org
positive membrane voltages (Fig. 2). For instance, for the traces shown in Fig. 2 A, N′Po increased from 2.5 at
Vm −80 mV to 7.9 at Vm 80 mV. The data from 10 patches
confirm that channel activity is highly dependent on membrane voltage (Fig. 2 B); the Boltzmann fit of mean N′Po data points yielded K and V1/2 values of 11 ± 7.3
mV and 44 ± 3.5 mV, respectively. Note that N′Po stays
relatively low over the range of physiological membrane voltages encountered in epithelial cells (between −70 and −30 mV, depending on cell type).
The properties of the channel in the cell-attached con-figuration are illustrated in Fig. S2. In these conditions, channel conductance was 10.4 ± 0.2 pS (n = 12, Fig. S2 B). The examination of traces in Fig. S2 A shows that the
channel voltage dependence is preserved in situ, N′Po
increasing in this example from 4.1 at a clamp potential (Vc) of −80 mV to 13.6 at Vc of 80 mV. The results from
nine cell-attached patches are quantified in Fig. S2 C. The variations in voltage occurring in CNT cells are very likely too limited to produce by themselves notice-able alterations in channel activity. Nevertheless, such a regulation could be of importance in the physiological control of channel activity, if any regulatory factor had the power of altering the shape of the voltage depen-dence curve. In the following measurements, we
there-fore examined whether pHi, pHo, and calcium
concentration ([Ca2+]
o), which are known regulators of
the native ClC-K2 channel (Lourdel et al., 2003; Nissant et al., 2006), as well as intracellular chloride concentra-tion ([Cl−]
i), which influences the activity of ClC-0 and
ClC-2 (Pusch et al., 1999; Niemeyer et al., 2003; Yusef et al., 2006), are able to alter ClC-K2 voltage dependence.
Channel activity is relatively independent of [Cl−] i
To date, the possibility that [Cl−]
i might regulate
recom-binant and native ClC-K2 channels and potentially con-tribute to the cross-talk between apical entry and basolateral exit of chloride in renal cells has not been explored. Thus, we measured ClC-K2 activity in cell-ex-cised inside-out patches clamped at either Vm 80 or Vm
−80 mV, while decreasing [Cl−]
i from 147 to 7 mM. As
illustrated in Fig. S3, N′Po did not change much over
the 147–14.5 mM [Cl−]
i range at both potentials.
Fur-ther lowering [Cl−]
i down to 7 mM, a value well below
the resting [Cl−]
i in the renal cells (Greger et al., 1983;
Beck et al., 1988; Weinstein, 2005), decreased N′Po to
∼65% and ∼32% of the N′Po at 147 mM at Vm −80 mV
(n = 3) and Vm 80 mV (n = 3), respectively (P = 0.05 for
each potential, paired Student’s t test). In sum, varia-tions in [Cl−]
i within the physiological range have a
lim-ited effect on ClC-K2 activity and voltage dependence.
Alkaline pHi flattens the voltage dependence curve by
increasing N′Po at negative membrane voltage
We have previously demonstrated that the native ClC-K2 is sensitive to pHi (Lourdel et al., 2003; Nissant et al.,
2006). Here, we attempted to establish a dose–response curve over an extended pHi range (Fig. 3). The N′Po
values were very low at pHi 6.6 (0.003 ± 0.003, n = 4) and
7.0 (0.15 ± 0.11, n = 4) and increased substantially over the 7.0–7.8 range, and even more steeply when pHi was
raised from 7.8 to 8.2. Although we cannot ascertain
that the maximal response was reached at pHi 8.2
be-cause patch instability precluded a more complete anal-ysis at higher pHi values, our results strongly indicate
that pKa might be well above physiologically rele-vant pHi values.
We examined whether pHi alters the ClC-K2 voltage
dependence by comparing activities in the same patches
at negative and positive membrane voltages while pHi
was varied over the 7.0–7.8 range. A rise in pHi from 7.0
Figure 2. Channel voltage dependence in the cell-excised
inside-out configuration. Experiments were performed under
symmetrical NMDG-Cl conditions (pH 7.4), and pipette solution contained 5 mM Ca2+ and bath solution was calcium free. (A)
Representative current recordings at the Vm values are given
on the right side of each trace. The dashed lines indicate the closed channel current levels (C-). Channel unitary conductance and reversal potential in these conditions (pHi 7.4) are given
in Table S1. (B) Mean N′Po/Vm relationship. N′Po data were
normalized to the respective N′Po at Vm 80 mV. Each point is
the mean of 6–10 measurements, and SEM is shown as error bars. The continuous line is a nonlinear least squares fit with the Boltzmann equation of mean normalized data.
on August 30, 2016
jgp.rupress.org
to 7.8 produced qualitatively similar increases in activity at Vm 80 mV and Vm −80 mV (Fig. 4 A), without altering
single-channel conductive properties (Table S1). Never-theless, variations in pHi at Vm −80 mV elicited a
signifi-cantly more pronounced effect on N′Po than at Vm 80
mV (Fig. 4 B), revealing a modulation of voltage depen-dence. Indeed, N′Po/Vm curves established at various
pHi values within the 7.0–7.8 range (Fig. 4 C) showed a
progressive flattening of the voltage dependence curve with internal alkalinization. Statistical analysis of mean parameters derived from Boltzmann fits of these exper-imental N′Po/Vm data revealed that internal
alkaliniza-tion significantly increased N′Po at negative voltage
without affecting K and V1/2 values (Table 1).
Alkaline pHo shifts the voltage dependence curve
toward negative voltages
The effects of pHo, a known regulator of recombinant
and native ClC-K2 channels (Waldegger and Jentsch, 2000; Estévez et al., 2001; Lourdel et al., 2003; Nissant et al., 2006), on voltage dependence were similarly investi-gated by comparing activities in separate patches when external (pipette) pH was set at either 6.6 or 8.0. Sin-gle-channel conductive properties were not affected by pHo (Table S1), but channel activity clearly increased
with positive membrane voltage in both pHo conditions
Figure 3. Dose–response curve for the effects of pHi on channel activity. Experiments were performed on cell-excised
inside-out membrane patches under symmetrical NMDG-Cl conditions, at Vm 80 mV. Pipette solution contained 5 mM Ca2+
(pHo 7.4), and the bath solution was calcium free. (A) Current
traces from the same patch exposed to pHi 7.0–8.2. For clarity,
the traces were superimposed, the dashed line indicating the closed channel current level (C-). The respective N′Po values are
given on the right side of each trace. (B) Dose–response rela-tionship. Each N′Po value at a given pHi was normalized to the
paired N′Po at pHi 7.8 on the same patch. Data are means of
measurements from four to five patches, and SEM is given as error bars when larger than symbols.
Figure 4. Increased pHi flattens the voltage dependence curve. Experiments were performed on inside-out patches
symmetrically bathed in NMDG-Cl solution. Pipette solution contained 5 mM Ca2+ (pH 7.4), and the bath solution was
cal-cium free. (A) Recordings from the same patch at Vm 80 mV
or at Vm−80 mV, at pHi 7.0 or 7.8. Dashed lines indicate the
closed channel current levels (C-). (B) Effects of pHi on N′Po in
the conditions given in A, at Vm−80 mV (white bars) and at Vm
80 mV (black bars), at the indicated pHi values. At each
poten-tial, N′Po values were normalized to their respective values at
pHi 7.8; data are given as means of five experiments, and SEM
is shown as error bars. *, P < 0.05 versus Vm 80 mV, paired
Stu-dent’s t test. (C) Mean N′Po/Vm curves at pHi 7.0 (■), 7.4 (●),
7.6 (▲), and 7.8 (▼). For each pHi condition, N′Po data were
normalized to the respective N′Po at Vm 80 mV, and each point
is the mean of 9–12 (pHi 7.0), 16–19 (pHi 7.4), 6–10 (pHi 7.6),
and 8–12 (pHi 7.8) measurements. SEM is shown as error bars
when larger than symbols. Continuous lines are the Boltzmann fits of mean data.
on August 30, 2016
jgp.rupress.org
(Fig. 5 A). Mean N′Po/Vm curves established at pHo 6.6,
7.4, and 8.0 (Fig. 5 B) show that, in contrast with pHi,
increased pHo did not modify the shape of the curve but
caused a significant shift toward less depolarizing volt-ages by decreasing V1/2 (Table 1). A plot of V1/2 values
from Table 1 as a function of pHo revealed a ∼12-mV per
e-fold change in the external H+ concentration (Fig. 5 C).
Extracellular calcium concentration ([Ca2+]
o) has no
influence on ClC-K2 voltage dependence
Experiments were then conducted to assess the impact of variations in [Ca2+]
o, by comparing recordings
ob-tained from separate inside-out patches with either a nominally calcium-free or 5 mM calcium–containing pipette solution. [Ca2+]
o had no influence on
sin-gle-channel conductive properties (Table S1), and channel activity increased with membrane depolariza-tion under each [Ca2+]
o condition (Fig. 6 A). As shown
in Fig. 6 B, [Ca2+]
o had no influence on channel voltage
dependence, the N′Po/Vm relationships obtained under
each [Ca2+]
o condition being superimposed and
Boltz-mann fits of experimental N′Po/Vm curves in each
con-dition yielding similar parameters (Table 1).
Altogether, our results show that pHi and pHo, but
not [Ca2+]
o, modify ClC-K2 channel voltage
depen-dence in such a way that its activity at negative mem-brane voltages is increased by alkaline pH.
The number of active ClC-K2 channels per patch is critically dependent on pHi, whereas the effect on Po
is less important
When examining the traces shown in Figs. 3 and 4, it is clear that alkaline pHi dramatically increases the
ap-parent number of active channels per patch. This
sug-gests a second possible pHi-dependent modulation of
chan nel activity.
To investigate this issue, we analyzed long-lasting cur-rent recordings on patches undergoing successive
changes in pHi without showing noticeable rundown.
Fig. 7 A shows a typical channel recording at Vm 80 mV
(i.e., under high activity conditions) where pHi was
low-ered from 7.4 to 7.0 and then raised back to 7.4. Here, a large reduction in steady-state currents occurred when switching pHi from 7.4 (N′Po = 7.96) to 7.0 (N′Po =
0.96), which was fully reversible when switching back to 7.4 (N′Po = 10.2). A further rise in pHi to 7.8 resulted in
a huge increase in N′Po to 28.3. It is also apparent from
Fig. 7 A that the changes in activity when switching to different pHi are quite slow, as illustrated by the ∼1-min
lag needed to reach a new steady-state after switching pHi from 7.4 to 8. We further explored this observation
by examining the time course of N′Po change upon a
large and sudden change in pHi at Vm 80 mV (Fig. 7 B).
Here, up to ∼21 channels were simultaneously active at pHi 7.8, and decreasing pHi to 6.8 progressively reduced
channel activity, reaching a new steady-state with only five active channels within ∼40 s. Based on the mean of four similar experiments, the fit of relaxation current data to a single exponential equation yielded a time constant of 13.6 ± 4.6 s, demonstrating the presence of
a slow component in the channel dependence on pHi.
Recordings obtained at Vm 80 mV and over the 7.4–
8.2 pHi range with sufficiently high activities enabled us
to estimate N′ and Po values from peak activity
measure-ments in good agreement with results from stationary noise analysis (see Materials and methods). As illus-trated in Fig. 7 C, the increase in N′Po with pHi was
caused by a dramatic increase in N′ over the 7.4–8.2 pHi
range, associated (pHi 7.4–7.8) or not (pHi 7.8–8.2)
with a moderate increase in Po.
pHo and [Ca2+]o also modulate the number of active
ClC-K2 channels per patch
In cell-attached patches from DCT cells, the effects of pHo and of [Ca2+]o on ClC-K2 channels were
simi-larly related to a major modulation in the number of
Table 1. Effects of pHi, pHo, and [Ca2+]o on channel N′Po/Vm relationships
Condition K V1/2 N′Po min N′Po max R2
mV mV % % pHi 7.0 (5) 20.8 ± 3.9 41.7 ± 8.4 19.4 ± 6a 111.0 ± 8.2 0.961 ± 0.027 pHi 7.4 (7) 19.0 ± 6.1 28.8 ± 8.4 19.6 ± 4.5a 106.7 ± 8.2 0.905 ± 0.022 pHi 7.6 (5) 22.9 ± 10.1 29.6 ± 5.9 38.4 ± 11.3 106.4 ± 4.4 0.953 ± 0.016 pHi 7.8 (5) 20.4 ± 4.6 32.8 ± 4.9 47.3 ± 3.3a 104.8 ± 1.7 0.945 ± 0.069 pHo 6.6 (5) 19.5 ± 6.2 58.0 ± 5.1b 33.1 ± 3.3 124.1 ± 12 0.934 ± 0.016 pHo 7.4 (5) 13.1 ± 2.4 33.0 ± 8.5 35.0 ± 3 105.0 ± 3.2 0.890 ± 0.03 pHo 8.0 (4) 23.3 ± 6.5 20.8 ± 4.6 37.0 ± 4.5 109.8 ± 3 0.927 ± 0.04 [Ca2+] o 0 mM (5) 21.2 ± 5.1 34.3 ± 12.6 10.4 ± 2.5 119.5 ± 11.2 0.979 ± 0.015 [Ca2+] o 5 mM (4) 29.1 ± 5.1 31.4 ± 11.3 6.9 ± 5.3 118.7 ± 11.8 0.965 ± 0.012
Mean parameters from Boltzmann fits (see Materials and methods) of individual N′Po/Vm relationships in the cell-excised inside-out configuration in the conditions
given in the left column. In each condition, N′Po values were normalized to their respective values at Vm 80 mV. Data are given as means ± SEM for the number of
fits indicated in parentheses. For each condition, a measure of the goodness of fit (R2) is also given. One-way ANO VA revealed significant differences between the
N′Pomin means of pHi groups (P < 0.005) and between the V1/2 means of pHo groups (P < 0.01). Parameters under 0 and 5 mM [Ca2+]o were not statistically different
(unpaired Student’s t test).
aP < 0.01 versus pH
i 7.8 (Holm-Šidák multiple comparison procedure). bP = 0.02 versus pH
o 8.0 (Holm-Šidák multiple comparison procedure).
on August 30, 2016
jgp.rupress.org
active channels (Lourdel et al., 2003). Fig. S4 shows that modulation by pHo and [Ca2+]o was also seen in
cell-excised patches from CNT cells. Here, N′Po was
measured during the first 2 min after excision of sepa-rate patches under various pHo or [Ca2+]o conditions,
at Vm 80 mV. In these conditions, the high N′Po at pHo
8.0, as compared with that on separate patches at pHo
6.6, was caused by a dramatic increase in N′ and by a moderate, yet significant, increase in Po (Fig. S4 A),
possibly by the pHo-dependent shift in voltage
depen-dence (see previous section). Similarly, the high N′Po
Figure 5. Variations in pHo shift the voltage dependence curve. Experiments were performed on inside-out patches
sym-metrically bathed in NMDG-Cl solution. Pipette solution con-tained 5 mM Ca2+, and the bath solution was calcium free and
adjusted at pH 7.4. (A) Current recordings from two separate patches under external (pipette) pH, pHo, 6.6 (left traces) or
8.0 (right traces) and clamped at the Vm values given on the left
side. The dashed lines indicate the closed channel current lev-els (C-). (B) Mean N′Po/Vm relationships at pHo 6.6 (▲), 7.4 (●),
and 8.0 (■). For each pHo condition, N′Po data were normalized
to the respective value at Vm 80 mV. Each point is the mean
of 5 (pHo 6.6 and 8.0) or 6 (pHo 7.4) measurements, and SEM
is shown as error bars when larger than symbols. Continuous lines are nonlinear least squares fits of respective mean data with the Boltzmann equation. (C) Mean V1/2 values from Table 1
plotted as a function of pHo, and SEM is shown as error bars.
Data were fitted by a straight line with a slope of 26.6 ± 1.99 mV/pHo unit (R2 = 0.989).
Figure 6. [Ca2+]
o does not affect channel voltage
depen-dence. Experiments were performed on cell-excised inside-out
membrane patches symmetrically bathed in NMDG-Cl solution (pH 7.4) and under calcium-free bath solution. (A) Represen-tative current recordings from two separate patches clamped at Vm 80 mV (top traces) or −80 mV (bottom traces) and under
calcium-free (0 Cao, left) or 5 mM (5 Cao, right) external (pipette)
conditions. The dashed lines indicate the closed channel cur-rent levels (C-). The inset is an excerpt of the trace at Vm 80 mV
taken at the indicated location (asterisk) with the correspond-ing expanded time scale. (B) Mean N′Po/Vm relationships under
external calcium-free (□) or 5 mM Ca2+ (●) condition. For each
[Ca2+]
o condition, N′Po data were normalized to the respective
N′Po value at Vm 80 mV. Each point is the mean of five
measure-ments, and SEM is shown as error bars when larger than sym-bols. Continuous and dashed lines are nonlinear least squares fits with the Boltzmann equation of calcium-free and 5 mM Ca2+
mean data, respectively.
on August 30, 2016
jgp.rupress.org
observed under 5 mM external Ca2+ as compared with
Ca2+-free conditions could be related to an increase in
N′, whereas no significant change in Po was observed
(Fig. S4 B).
Voltage affects both the number of active channels and Po, but alkaline pHi blunts the voltage dependence by
acting on Po only
We first evaluated the time course of the change in channel activity upon sudden variations in Vm. As
illus-trated in Fig. 8 A, switching Vm from 80 to −80 mV
caused an initial peak in channel activity followed by a progressive decay. The relaxation currents could be fit-ted to a single exponential equation with time constants of 18.7 ± 4 s after a 80 to −80-mV transition (n = 12) and of 19.6 ± 7.6 s for a −80 to 80-mV transition (n = 6), in-dicating the involvement of a relatively slow component in the channel dependence on voltage.
We then evaluated N′ and Po at positive and negative
membrane voltages. For this purpose, we selected a sub-set of data compatible with an analysis of N′ and Po as
defined in the Materials and methods section, in which
recordings were obtained at Vm 80, 40, −40, and −80
mV from the same patch (n = 5). Under these specific conditions, we observed a major increase in N′ with de-polarization (P = 0.007, one-way ANO VA), but also a moderate but significant (P = 0.023, one-way ANO VA) increase in Po (Fig. 8 B).
To investigate how pHi modulates the channel
volt-age dependence illustrated in Fig. 4, we analyzed
an-other subset of data comprising N′Po, N′, and Po
measurements at pHi 7.4 and 7.8 and at Vm 80 and −80
mV, in the same patch. As shown in Fig. 8 C, at pH 7.4,
the profound decrease in N′Po observed at −80 mV (as
compared with N′Po at 80 mV) was related to significant
reductions in both N′ (by ∼65%, middle panel) and Po
(by ∼35%, right panel). In contrast, at pH 7.8, the less
pronounced decrease in N′Po observed at −80 mV was
purely caused by a reduction in N′ (by ∼50%) without any variation of Po. We may conclude that the effect of
pHi on voltage dependence includes two components,
a dominant N′ modulation, which can be detected over a large range of pHi values, and a modest Po
modula-tion, apparent only at pHi ≤ 7.4.
Figure 7. pHi modulates the number of active channels. (A) Representative
continuous current recording from an inside-out membrane patch at Vm 80
mV, symmetrically bathed in NMDG-Cl solution. Pipette solution contained 5 mM Ca2+ (pH 7.4), and pH
i was varied
as indicated. The inset contains two ex-cerpts taken at the indicated locations (a and b) at the expanded time and amplitude scales (*). The dashed lines indicate the closed channel current lev-els (C-). (B) Time course of the change in channel activity upon switching pHi
from 7.8 to 6.8 (arrow), at Vm 80 mV. The
dashed line indicates the closed chan-nel current level (C-). The fit of the trace under pHi 6.8 to a single exponential
equation (continuous line) indicated an e-fold decrease in channel activity after 17.1s. (C) N′Po, number of active
chan-nels (N′) and Po as a function of pHi.
Paired data were obtained as described in A and normalized to the respective value at pHi 7.8. N′ was determined by
peak current measurements and vali-dated by stationary noise analysis (see Materials and methods). Only record-ings yielding ΔN′/N′ values within the 95% agreement interval were taken as valid. Data are given as means from four patches, and SEM is shown as error bars. N′Po, N′, and Po means
signifi-cantly were affected by pHi (P < 0.001,
P < 0.001, and P = 0.005, respectively; one-way ANO VA). **, P < 0.001; and *, P < 0.02 versus pHi 7.8 (Holm-Šidák
multiple comparison procedure).
on August 30, 2016
jgp.rupress.org
Modeling ion transport in type B intercalated cells
Even though ClC-K2 channels are densely present in the basolateral membrane, only a small fraction of these
channels is active under physiological conditions (i.e., at pH 7.4 and negative membrane voltage). Further-more, pH-dependent processes (acting via external and internal pH) around physiological values powerfully modulate ClC-K2 activity, implying that the basolateral chloride conductance (i.e., gClC-K) can change dra-matically under conditions of acidosis or alkalosis (from nearly 0% at pHo 7.0 to 100% around pHo 8.2, changes
in pHo are accompanied by parallel changes in pHi).
For this reason, we wished to evaluate how gClC-K mod-ulation might affect ion transport in type B intercalated cells. Type B intercalated cells are classically involved in
HCO3− secretion (Staruschenko, 2012), but the group
of Eladari and Chambrey (Leviel et al., 2010; Chambrey et al., 2013; Eladari et al., 2014) more recently showed that these cells are also able to reabsorb NaCl through an electroneutral process. The net reabsorption of
NaCl is energized by basolateral V-ATPase pumps. Na+
enters the cell on the apical side via the Na+-driven Cl−/
HCO3− exchanger NDC BE and exits via the Na+-HCO3−
transporter AE4 on the basolateral side. The apical up-take of Cl− is mediated by the Cl−/HCO
3− exchanger
pendrin; a fraction of Cl− is recycled via NDC BE,
whereas the remainder exits via the basolateral Cl−
channel ClC-K2 (Fig. 9 A).
We modeled ion transport in type B intercalated cells by integrating these main ion transport systems (see
Materials and methods) and evaluated Na+, Cl−, and
HCO3− transport under asymmetric conditions, i.e.,
with a low NaCl concentration in the lumen. When the basolateral gClC-K is maximal (a condition possi-bly corresponding to strong alkalosis), there is a large transepithelial Cl− flux associated with a minimal Na+
flux (Fig. 9 A): in these conditions, the intercalated
cells exchange HCO3− for Cl− but do not reabsorb
Na+ (Fig. 9 B). Reducing progressively gClC-K switches
the intercalated cell to a NaCl-transporting system (Fig. 9 B): when gClC-K is ∼15% of its maximal value (corresponding to resting pH conditions), the transep-ithelial Cl− flux is only coupled to the Na+ flux. Finally,
at very low gClC-K (such as in acidotic conditions), the Cl− flux tends toward zero and Na+ is absorbed with
HCO3−. These simulations suggest that the basolateral
Cl− conductance is a critical ion transport parameter in
the type B intercalated cell, whose modulation allows switching between several modes of transport.
D I S C U S S I O N
Previous single-channel patch clamp analyses on wild-type and Clcnk2−/− mice have established that the major basolateral Cl− channel along the distal nephron is a
∼10-pS Cl− channel formed by ClC-K2 (Lourdel et al.,
2003; Nissant et al., 2004, 2006; Zaika et al., 2015). The present study focused on the regulation of the native renal ClC-K2 by characteristic modulators of ClC
chan-Figure 8. Membrane voltage modulates the open
proba-bility and the number of active channels. Experiments were
performed on cell-excised inside-out membrane patches sym-metrically bathed in NMDG-Cl solution. Pipette solution con-tained 5 mM Ca2+ (pH
o 7.4), and bath solution was calcium free.
(A) Time course of the change in channel activity upon switch-ing Vm from 80 to −80 mV, at pHi 7.4. The dashed line indicates
the closed channel current level (C-). The fit of the trace at Vm
−80 mV to a single exponential equation (continuous line) in-dicated an e-fold decrease in channel activity within ∼15 s. (B) Number of active channels per patch (N′) and Po as a function of
Vm. For each patch, paired data were normalized to the
respec-tive value at Vm 80 mV, pHi 7.4. *, P < 0.05; **, P = 0.01; and ***,
P < 0.005, versus Vm 80 mV (Holm-Šidák multiple comparison
procedure). (C) Modulation by pHi of the effects of Vm on N′
and Po. For each patch, paired data at pHi 7.4 (black bars) or 7.8
(white bars), at Vm−80 mV, were normalized to the respective
value at Vm 80 mV. *, P < 0.005; ** P < 0.0001, versus Vm 80 mV;
and #, P < 0.05; ##, P < 0.005 versus pHi 7.8, paired Student’s t
test. (B and C) Data are given as means from five patches, and SEM is shown as error bars. N′ was determined by peak cur-rent measurements and validated by stationary noise analysis (see Materials and methods). Only recordings yielding ΔN′/N′ values within the 95% agreement interval were taken as valid.
on August 30, 2016
jgp.rupress.org
nels and describes the key role of external and internal pH synergistically modulating membrane voltage de-pendence at negative membrane voltages.
Voltage dependence
We first showed that voltage dependence, a general property of ClC Cl− channels (Uchida and Sasaki, 2005;
Jentsch, 2008; Stölting et al., 2014), is also a characteris-tic of the native renal ClC-K2 channel. Previous studies on the regulation by membrane voltage of recombinant human ClC-Kb provided contradictory information. Two-electrode voltage clamp experiments on ClC-Kb/ barttin channels expressed in Xenopus laevis oocytes showed time- and voltage-dependent gating, currents activating upon membrane depolarization and deactivat-ing upon membrane hyperpolarization (Estévez et al., 2001; Waldegger et al., 2002; Picollo et al., 2004; Gra-dogna et al., 2010). In contrast, whole-cell currents from renal HEK and tsA201-cultured cells transfected with ClC-Kb/barttin showed no relaxation component (Es-tévez et al., 2001; Scholl et al., 2006; Fahlke and Fischer, 2010). There is no clear explanation for this discrepancy, but the similar voltage dependence in cell-attached and cell-excised inside-out membrane patches in our exper-iments very likely rules out the loss of an unknown intra-cellular signal regulating gating upon cell dialysis in ClC-Kb/barttin whole-cell measurements. Interestingly, we observed that the native ClC-K2 channel displays slow kinetics with two open states of 0.3 s and 2.2 s and one very long closed state of 6.5 s (Lourdel et al., 2003), and with a relaxation time constant close to 20 s (this study). Such a slow component in ClC-K2 channel gating may have been missed under the short (<500 ms) pulses used in whole-cell studies of recombinant ClC-K2 channels.
Regulation of channel activity by pH and calcium
Regulation by external H+ and Ca2+ is a typical property
of all ClC-K channels (Estévez et al., 2001; Waldegger et al., 2002) that was studied in detail by Pusch and associ-ates (Gradogna et al., 2010, 2012; Imbrici et al., 2014).
The effects of external H+ and Ca2+ on recombinant
ClC-Kb are independent, acting on separate binding sites located at the outer layer of the protein and there-fore not indirectly mediated by some regulatory cell component (Gradogna et al., 2010). This is in agree-ment with our results on the native mouse ClC-K2. We
previously demonstrated that the native ∼10-pS Cl−
channel in mouse renal tubules was sensitive to exter-nal H+ and Ca2+ in cell-attached patches (Lourdel et al.,
2003; Nissant et al., 2006). We show here that this prop-erty can still be observed in excised patches, ruling out the hypothesis that the effects of pHo are in fact caused
by secondary changes in pHi. In contrast to the
well-rec-ognized effects of pHo, pHi effects have never been
in-vestigated on recombinant ClC-K channels and may not be a general property of ClC-K channels. Indeed, a ∼45-pS Cl− channel in mouse TAL (Paulais and Teulon,
1990), later identified as ClC-K1 (L’Hoste et al., 2013), the murine orthologue of ClC-Ka in humans, was shown to be hardly sensitive to this parameter. There is presently no clue regarding the mechanism responsi-ble for ClC-K2 pHi sensitivity. Further investigations on
recombinant ClC-K2 would be necessary to determine the presence of a specific binding site for intracellular
H+. Two facts are worth mentioning: (1) quite
puz-zlingly, the pKa for pHi effects is very alkaline, as is that
for pHo effects in ClC-Kb (Gradogna et al., 2010;
An-drini et al., 2015); (2) although pHi affects mainly the
number of active channels over a large range of pHi,
Figure 9. Modeling ion transport in the type B intercalated cells. (A) Ion transporter model used for simulations (see Materials and methods). Type B intercalated cells secrete HCO3− into the lumen by the apical Cl−/HCO3− exchanger pendrin coupled to the
basolateral efflux of protons by the V-ATPase and of Cl− by the ClC-K2/Barttin channel. Electroneutral NaCl reabsorption is mediated
by the apical coupling of pendrin with the Na+-driven Cl−/HCO
3− exchanger NDC BE and by the basolateral extrusion of Na+ by Na+
-HCO3− cotransporter AE4, and of Cl− by ClC-K2. (B) Predicted effects of variations in basolateral membrane chloride conductance
(gClC-K) on net fluxes of Cl− through ClC-K2 (blue), of Na+ through NDC BE (red), and of apical HCO
3− (black; left) and on net
tran-scellular Na+, Cl−, and HCO
3− transport (right). The labels 1–3 correspond to relative gClC-K values of 0, 0.15, and 1, respectively.
on August 30, 2016
jgp.rupress.org
there is clearly a more rapid component affecting Po at
negative membrane voltages that can be detected at pHi ≤ 7.4. This suggests that pHi might be acting via
two distinct mechanisms.
ClC complex gating
The ClC channels are functional dimers, whose activity is controlled by two independent processes, the two in-dependent protopore gates and the common gate that simultaneously opens/closes the two protopores (Pusch, 2004; Chen, 2005; Jentsch, 2008). The pro-topore gating involves the protonation/deprotonation of a glutamate residue at position 166. In contrast, the mechanisms of the common gate have not yet been elu-cidated; it functions as an inactivation process driven by depolarization in ClC-0 and ClC-2 channels and by hy-perpolarization in the ClC-1 channel. It can be very slow (tens of seconds), as in ClC-0, or relatively fast (hun-dreds of milliseconds), as in ClC-1 (Pusch, 2004; Chen, 2005; Jentsch, 2008). Because the ClC-K channels lack the characteristic glutamate residue involved in the pro-topore gate mechanism of ClC channels, ClC-K channel gating is presumed to be controlled mainly by the com-mon gate. Accordingly, the protopore conductance is only rarely detected under the form of short-lived, half-openings for the native ClC-K2 (Lourdel et al., 2003) and recombinant mouse ClC-K1 (L’Hoste et al., 2013) channels, whereas it is clearly observed after in-sertion of a glutamate at position 166 in mouse ClC-K1 (L’Hoste et al., 2013). Likewise, in the present experi-ments, we did not notice more frequent half-openings under specific conditions of membrane voltage, pH, or Ca2+ concentration. In sum, this suggests that ClC-K2
gating is dominated by the common gate.
Mechanisms involved in ClC-K2 regulation
The effects of [Ca2+]
o, pHi and pHo appear to be mainly
caused by variations in the apparent number of active ClC-K2 channels. The presence of separate binding sites for Ca2+ and H+ at the outer side of the ClC-Ka
protein (Gradogna et al., 2010), a ClC-Kb isoform, makes it unlikely that changes in the total number of channels in cell-attached membrane patches, via chan-nel trafficking to and from the membrane, may have modulated the number of channels after changes in the external environment (i.e., [Ca2+]
o or pHo). In
cell-excised membrane patches, it can be reasonably admitted that the total number of channel proteins per
patch remains constant upon changes in pHi, i.e., we
may discard the possibility that trafficking processes are involved in this regulation. Nevertheless, the actual number of active channels in the patch membrane may fluctuate during the whole duration of the current re-cording, either because some of the channels present in the patch spontaneously enter a “sleepy” (inactive) state or because regulatory factors favor an inactivated
state (Colquhoun and Hawkes, 1995). We propose that, under acid pHi conditions, a fraction of the channels
present in the membrane patch enter into an electri-cally quiescent state and do not contribute to the pool of electrically active channels over a time scale of tens of seconds (which represents the time scale of our re-cordings). According to this hypothesis, conforma-tional changes upon increased [Ca2+]
o would stabilize
the channel in an activated mode, increasing the num-ber of active channels on the membrane patch, whereas H+, in contrast, would stabilize the channel in an
inac-tivated state and increase the number of electrically quiescent channels.
Voltage dependence can also be explained within the same framework, membrane hyperpolarization fa-voring an inactivated state and decreasing the appar-ent number of active channels. However, it is clear from our results that Po is a second voltage-dependent
component. The modulation of Po with voltage, as
illus-trated in Fig. 7 B, is modest, with a decrease of ∼25–
30% at −80 mV compared with 80 mV at pH 7.4. Po
modulation disappears at pH 7.8, suggesting that pro-tons might interfere with common gating, possibly via an intracellular site distinct from the one modulating N′. The effect of pHi on Po is not limited to negative
voltages but is also observed at positive voltages when pHi is decreased to 7.4.
Therefore, we suggest that the activity of the native ClC-K2 channel is modulated by two slow processes, i.e., the open probability and the number of active
chan-nels. Po modulation would correspond to channel
com-mon gating stricto sensu and N′ modulation to the channels entering/leaving an inactivated state of long duration. Regarding the latter, abrupt changes in volt-age and pHi interestingly affected channel activity with
comparable kinetics (see Figs. 7 B and 8 A), but we can-not rule out that these two factors, and likely pHo and
[Ca2+]
o, may indeed modulate N′ by separate
mecha-nisms with similar time constants.
ClC-K2 regulation in the context of renal physiology
The native ClC-K2 is present at very high density in the basolateral membranes of the distal nephron (Lourdel et al., 2003; Nissant et al., 2006). Our previous (Lourdel et al., 2003; Nissant et al., 2006) and present results in-dicate that the number of active (detectable) channels under physiological conditions of calcium and pH is considerably lower than the actual number of channels present in the patch (as evaluated with alkaline pH or elevated calcium). Thus, we may envision the ClC-K2 channel population as a large reservoir of silent chan-nels in the basolateral membranes, which may be mobi-lized by regulatory factors. Our results show that [Cl−] i
may not be viewed as a physiological regulator of ClC-K2, whereas the intracellular and pHo might be key
reg-ulators of ClC-K2 under diverse acido-basic conditions,
on August 30, 2016
jgp.rupress.org
as pHo variations should induce smaller but parallel
variations in pHi.
Our modeling study gives some insight into the con-ditions of ion transport in type B intercalated cells. When the basolateral Cl− conductance is maximal, type
B intercalated cells mostly exchange HCO3− for Cl−,
ful-filling their primary function of HCO3− excretion,
with-out absorbing Na+. This prediction results from the fact
that the Cl− gradient across the apical membrane is not
favorable to the uptake of Na+ via NDC BE, whereas the
high basolateral Cl−conductance optimizes the
recircu-lation of the Cl− ions entering the cell by means of the
Pendrin exchanger. When the Cl− conductance is
re-duced to 15% or more of its maximal value, the
ClC-K2–mediated Cl− flux is decreased but it is now
accompanied by a parallel Na+ transcellular flux. In
sum, under low luminal NaCl conditions, variations in basolateral Cl− conductance may switch type B
interca-lated cells from a state where they primarily exchange HCO3− against Cl− to a state where NaCl transport is
favored. Thus, we suggest that pH, by controlling ClC-K2 activity, is in a position to decrease Na+ absorption
across type B intercalated cells while stimulating Cl−/
HCO3− exchange during alkalosis.
Of course, given the involvement of ClC-K2 in renal NaCl absorption, it would be attractive to link Cl−
chan-nel modulation to hormones and mediators (Wu et al., 2013; Zaika et al., 2015). Future studies are needed to investigate whether these regulations are also acting on the number of active channels either via phosphoryla-tion/dephosphorylation processes of the channel (Zaika et al., 2015) or via variations in the pHi that may
alter the transport status of intercalated cells.
A C K N O W L E D G M E N T S
The English text was edited by Charlotte Sumida.
This work was supported by grants from the French National Research Agency (ANR-14-CE12-0013-02).
The authors declare no competing financial interests. Merritt Maduke served as editor.
Submitted: 18 May 2016 Accepted: 7 July 2016 R E f E R E N C E S
Andrini, O., M. Keck, S. L’Hoste, R. Briones, L. Mansour-Hendili, T. Grand, F.V. Sepúlveda, A. Blanchard, S. Lourdel, R. Vargas-Poussou, and J. Teulon. 2014. CLC NKB mutations causing mild Bartter syndrome profoundly alter the pH and Ca2+ dependence
of ClC-Kb channels. Pflugers Arch. 466:1713–1723. http ://dx .doi .org /10 .1007 /s00424 -013 -1401 -2
Andrini, O., M. Keck, R. Briones, S. Lourdel, R. Vargas-Poussou, and J. Teulon. 2015. ClC-K chloride channels: emerging pathophysiology of Bartter syndrome type 3. Am. J. Physiol. Renal
Physiol. 308:F1324–F1334. http ://dx .doi .org /10 .1152 /ajprenal
.00004 .2015
Beck, F.X., A. Dörge, R. Rick, M. Schramm, and K. Thurau. 1988. The distribution of potassium, sodium and chloride across the apical membrane of renal tubular cells: effect of acute metabolic
alkalosis. Pflugers Arch. 411:259–267. http ://dx .doi .org /10 .1007 /BF00585112
Bland, J.M., and D.G. Altman. 1999. Measuring agreement in method comparison studies. Stat. Methods Med. Res. 8:135–160.
http ://dx .doi .org /10 .1191 /096228099673819272
Chambrey, R., I. Kurth, J. Peti-Peterdi, P. Houillier, J.M. Purkerson, F. Leviel, M. Hentschke, A.A. Zdebik, G.J. Schwartz, C.A. Hübner, and D. Eladari. 2013. Renal intercalated cells are rather energized by a proton than a sodium pump. Proc. Natl. Acad. Sci. USA. 110:7928–7933. http ://dx .doi .org /10 .1073 /pnas .1221496110 Chen, T.Y. 2005. Structure and function of clc channels. Annu. Rev.
Physiol. 67:809–839. http ://dx .doi .org /10 .1146 /annurev .physiol
.67 .032003 .153012
Chen, M.F., and T.Y. Chen. 2001. Different fast-gate regulation by external Cl− and H+ of the muscle-type ClC chloride channels. J.
Gen. Physiol. 118:23–32. http ://dx .doi .org /10 .1085 /jgp .118 .1 .23
Colquhoun, D., and A.G. Hawkes. 1995. The principle of the sto-chastic interpretation of ion-channel mechanisms. In Single-Channel Recordings. Second edition. B. Sakmann and E. Neher, editors. Springer, New York. 397–482.
Eladari, D., R. Chambrey, N. Picard, and J. Hadchouel. 2014. Electroneutral absorption of NaCl by the aldosterone-sensitive distal nephron: implication for normal electrolytes homeostasis and blood pressure regulation. Cell. Mol. Life Sci. 71:2879–2895. http ://dx .doi .org /10 .1007 /s00018 -014 -1585 -4
Estévez, R., T. Boettger, V. Stein, R. Birkenhäger, E. Otto, F. Hildebrandt, and T.J. Jentsch. 2001. Barttin is a Cl− channel
β-subunit crucial for renal Cl− reabsorption and inner ear K+
secretion. Nature. 414:558–561. http ://dx .doi .org /10 .1038 /35107099
Fahlke, C. 2001. Ion permeation and selectivity in ClC-type chloride channels. Am. J. Physiol. Renal Physiol. 280:F748–F757.
Fahlke, C., and M. Fischer. 2010. Physiology and pathophysiology of ClC-K/barttin channels. Front. Physiol. 1:155. http ://dx .doi .org /10 .3389 /fphys .2010 .00155
Fischer, M., A.G.H. Janssen, and C. Fahlke. 2010. Barttin activates ClC-K channel function by modulating gating. J. Am. Soc. Nephrol. 21:1281–1289. http ://dx .doi .org /10 .1681 /ASN .2009121274 Gradogna, A., E. Babini, A. Picollo, and M. Pusch. 2010. A regulatory
calcium-binding site at the subunit interface of CLC-K kidney chloride channels. J. Gen. Physiol. 136:311–323. http ://dx .doi .org /10 .1085 /jgp .201010455
Gradogna, A., C. Fenollar-Ferrer, L.R. Forrest, and M. Pusch. 2012. Dissecting a regulatory calcium-binding site of CLC-K kidney chloride channels. J. Gen. Physiol. 140:681–696. http ://dx .doi .org /10 .1085 /jgp .201210878
Gray, P.T.A. 1994. Analysis of whole cell currents to estimate the kinetics and amplitude of underlying unitary events: relax-ation and ‘noise’ analysis. In Microelectrodes Techniques, The Plymouth Workshop Handbook. Second edition. D. Ogden, edi-tor. Company of Biologists, Cambridge, MA. 189–207.
Greger, R., H. Oberleithner, E. Schlatter, A.C. Cassola, and C. Weidtke. 1983. Chloride activity in cells of isolated perfused cortical thick ascending limbs of rabbit kidney. Pflugers Arch. 399:29–34. http ://dx .doi .org /10 .1007 /BF00652518
Hennings, J.C., O. Andrini, N. Picard, M. Paulais, A.K. Hübner, I.K. Lopez Cayuqueo, Y. Bignon, M. Keck, N. Cornière, D. Böhm, et al. 2016. The ClC-K2 chloride channel is critical for salt handling in the distal nephron. J. Am. Soc. Nephrol.. http ://dx .doi .org /10 .1681 /ASN .2016010085
Imbrici, P., A. Liantonio, A. Gradogna, M. Pusch, and D.C. Camerino. 2014. Targeting kidney CLC-K channels: pharmacological profile in a human cell line versus Xenopus oocytes. Biochim. Biophys.
Acta. 1838:2484–2491. http ://dx .doi .org /10 .1016 /j .bbamem
.2014 .05 .017
on August 30, 2016
jgp.rupress.org


![Figure S4. pH o and [Ca 2+ ] o also modulate the number of active channels. Experiments were performed under symmetrical NMDG-Cl solutions, at V m 80 mV](https://thumb-eu.123doks.com/thumbv2/123doknet/14515828.530537/18.918.339.565.97.359/figure-modulate-number-channels-experiments-performed-symmetrical-solutions.webp)
