Critical Power Characteristics of Axially Heterogeneous Tight Bundle Designs
byXingang Zhao
Diplôme d’ingénieur, Energy and Environmental Engineering (2014) Institut National des Sciences Appliquées de Lyon
Diplôme d’ingénieur, Nuclear Engineering (2014)
Institut National des Sciences et Techniques Nucléaires de Saclay
SUBMITTED TO THE DEPARTMENT OF NUCLEAR SCIENCE AND ENGINEERING IN PARTIAL FULFILLMENT OF THE REQUIREMENTS FOR THE DEGREE OF
MASTER OF SCIENCE IN NUCLEAR SCIENCE AND ENGINEERING AT THE
MASSACHUSETTS INSTITUTE OF TECHNOLOGY February, 2016
© 2016 Massachusetts Institute of Technology. All rights reserved.
Signature of Author ………... Xingang Zhao Department of Nuclear Science and Engineering January 6, 2016 Certified by …...……..………..
Jacopo Buongiorno, Ph.D. Professor and Associate Department Head of Nuclear Science and Engineering Director, Center for Advanced Nuclear Energy Systems (CANES) Thesis Supervisor Certified by ...….…….………..
Koroush Shirvan, Ph.D. Research Scientist of Nuclear Science and Engineering Thesis Co-supervisor and Reader Accepted by ...….….……...………..
Ju Li, Ph.D. Battelle Energy Alliance Professor of Nuclear Science and Engineering Professor of Materials Science and Engineering Chair, Department Committee on Graduate Students
Critical Power Characteristics of Axially Heterogeneous Tight Bundle Designs
byXingang Zhao
Submitted to the Department of Nuclear Science and Engineering on January 6, 2016 in Partial Fulfillment of the Requirements for the Degree of
Master of Science in Nuclear Science and Engineering
Abstract
Accurate prediction of the dryout critical power in fuel rod bundles is challenging and has important implications for the economy and safety of Boiling Water Reactors (BWRs). This is especially true for the tight bundle design of the Resource-Renewable BWR (RBWR) proposed by Hitachi, Ltd. Unlike a traditional square lattice BWR fuel bundle, the RBWR bundle is a relatively short tight hexagonal lattice with axially heterogeneous fuel composition for purpose of providing actinide breeding and burning capabilities. The RBWR’s different core geometry, combined with higher power-to-flow ratio and larger coolant void fraction, demands a reevaluation of the standard BWR thermal hydraulic models. One of the key constraints in BWR design is the thermal margin to dryout occurrence, referred to as the Minimum Critical Power Ratio (MCPR). In this thesis, different approaches for predicting critical power of tight bundles are investigated through empirical and mechanistic formulations. Previous work at MIT focused on collecting dryout database representative of RBWR fuel bundle geometry and operating conditions, and derived a best-estimate model for the prediction of critical quality/power, named M1-CISE4 (modified CISE4 version 1) correlation, which was based on the CISE4 formulation. This model showed significant scatter when compared to experimental data in its range of validity. This work supplements tight bundle data with relevant critical heat flux (CHF) data for tubes and annuli to better understand the effect of different parameters. An updated correlation, M2-CISE4 (modified CISE4 version 2), is proposed and analyses reveal that the dependence of critical power on such parameters as non-uniform axial and radial power distribution profiles as well as heated length requires further investigations via sub-channel analysis, using the code VIPRE-01. Results of radial quality distribution at the axial location of dryout are then incorporated and yield the M3-CISE4 (modified M3-CISE4 version 3) correlation development. Another approach utilized in the prediction of dryout databases is the three-field model, which relies on a mechanistic system of mass balance equations to resolve relevant fields (liquid film, entrained droplets, and vapor) within the annular flow regime. The introduction of sub-channel analysis is able to reduce the predicted standard deviation with both M3-CISE4 and three-field model against tight bundle database that includes eight different data sets with a total of 565 measurements with various axial and radial power distributions.
Lastly, the MCPR evaluation of the two current RBWR designs, RBWR-AC and TB2, is performed using the models above and values are compared against the conventional BWR steady-state design limit.
Thesis Supervisor: Jacopo Buongiorno, Ph.D.
Title: Professor and Associate Head, Department of Nuclear Science and Engineering Thesis Co-supervisor and Reader: Koroush Shirvan, Ph.D.
Acknowledgments
I would like to express my most profound gratitude to my former and late thesis supervisor, Professor Mujid S. Kazimi, for providing me with the opportunity to work on this exciting project. His guidance and insights have guided me to become a better researcher, his patience and generosity have helped me to become a better man. His knowledge as well as his smile will be missed by many, and I am so honored to have him as my first mentor at MIT. May your soul rest in peace, and I will miss you, Professor Kazimi.
I am very thankful to have Professor Jacopo Buongiorno as my thesis supervisor. He took me as his student immediately after the passing of Professor Kazimi, and his renowned expertise in reactor thermal-hydraulics has helped tremendously to the completion of my work. The discussions we had during group meetings have always been of great value, along with his comments and suggestions on the thesis.
I owe a great debt to my thesis co-supervisor and reader, Dr. Koroush Shirvan, for his continuous support and help throughout my thesis. I was deeply impressed and influenced by his diligence, rigorous attitude, incisive thinking, and unending desire for learning. He assisted me with every single step of my research: literature review, code learning, data analysis, and troubleshooting. He always prioritized my questions no matter how busy he was. More than an advisor, he is a real friend who helped and encouraged me at different moments.
My thanks are extended to Professor Yingwei Wu, visiting professor from Xi’an Jiaotong University, who provided me with files from previous work on critical power prediction and sub-channel analysis at the start of my project.
I also wish to thank all my NSE classmates for their hospitality and support. My special thanks go to my fellow friends, in particular Lulu Li, Yinan Cai and Zhaoyuan Liu, who have always been of priceless help both academically and socially.
This research work is partly funded by Hitachi, Ltd., which we acknowledge for their financial support.
Finally I would like to thank my father Nan Zhao and my mother Fengqin Zhang, for their unconditional love. They have made unimaginable sacrifices sending their only child abroad for over seven years now. I would never be able to pursue my study here without having such supportive parents.
Table of Contents
Abstract ... 3 Acknowledgments... 5 Table of Contents ... 7 List of Figures ... 9 List of Tables ... 11 Nomenclature ... 12 1. Introduction ... 14 1.1. Background ... 14 1.2. Motivation ... 171.3. Thesis Objective and Outline ... 19
2. M1-CISE4 Correlation Assessment... 20
2.1. Tube Data ... 20
2.2. Annulus Data ... 22
2.3. Tight Bundle Data ... 27
2.4. Conclusion ... 35
3. M2-CISE4 Correlation Development and Assessment ... 36
3.1. Methodology ... 36
3.2. M2-CISE4 Correlation ... 37
3.3. Results and Discussion ... 38
3.3.1. Effect of Pressure ... 40
3.3.2. Effect of Mass Flux and Bundle Tightness ... 41
3.3.3. Effect of Inlet Condition ... 42
3.3.4. Effect of Heated Length and Axial Peaking Condition ... 43
3.3.5. Effect of Radial Peaking Condition ... 46
3.3.6. Recommendations ... 46
3.4. Conclusion ... 46
4. Sub-channel Analysis of Tight Bundles ... 48
4.1. Objective ... 48
4.2. Code Overview: VIPRE-01 ... 48
4.2.2. Input Layout ... 49
4.3. VIPRE-01 Benchmark: Single-phase Flow ... 54
4.4. VIPRE-01 Benchmark: Two-phase Flow ... 61
4.5. Results and Discussion ... 67
5. M3-CISE4 Correlation Development and Assessment ... 72
5.1. Methodology ... 72
5.2. M3-CISE4 Correlation ... 72
5.3. Results and Discussion ... 73
5.4. Conclusion ... 76
6. Three-Field Model: A Mechanistic Approach ... 78
6.1. Introduction ... 78 6.2. Governing Equations ... 79 6.3. Constitutive Relations ... 80 6.3.1. Evaporation Rate ... 81 6.3.2. Deposition Rate ... 81 6.3.3. Entrainment Rate ... 82 6.3.4. Boundary Conditions ... 83
6.4. Results and Discussion ... 84
6.4.1. Tubes and Annuli ... 85
6.4.2. Tight Bundles ... 85
6.5. Conclusion ... 87
7. MCPR Evaluation of RBWR Designs ... 90
8. Summary, Conclusions, and Future Work ... 94
8.1. Summary and Conclusions ... 94
8.2. Recommendations for Future Work ... 95
Appendix A: VIPRE-01 Single-Phase Benchmark Input Files ... 97
Appendix B: VIPRE-01 Two-Phase Benchmark Input Files ... 101
Appendix C: VIPRE-01 Tight Bundle Tests Sample Input Files ... 105
Appendix D: Tight Bundle Critical Quality Comparison ... 124
Appendix E: VIPRE-01 RBWR-TB2 Bundle Input File ... 126
List of Figures
Figure 1. Natural uranium requirement (left) and TRU inventory (right) for OTC LWR, RBWR,
and FR scenarios (reproduced from Passerini and Kazimi, 2012)... 14
Figure 2. Geometry of a BWR square (left) and an RBWR hexagonal (right) fuel bundle (from Uchikawa et al., 2009). ... 15
Figure 3. RBWR heterogeneous axial fuel composition (reproduced from Shirvan, 2013). ... 15
Figure 4. RBWR-AC (left) and TB2 (right) relative axial power distribution (from Downar and Kazimi, 2015). ... 16
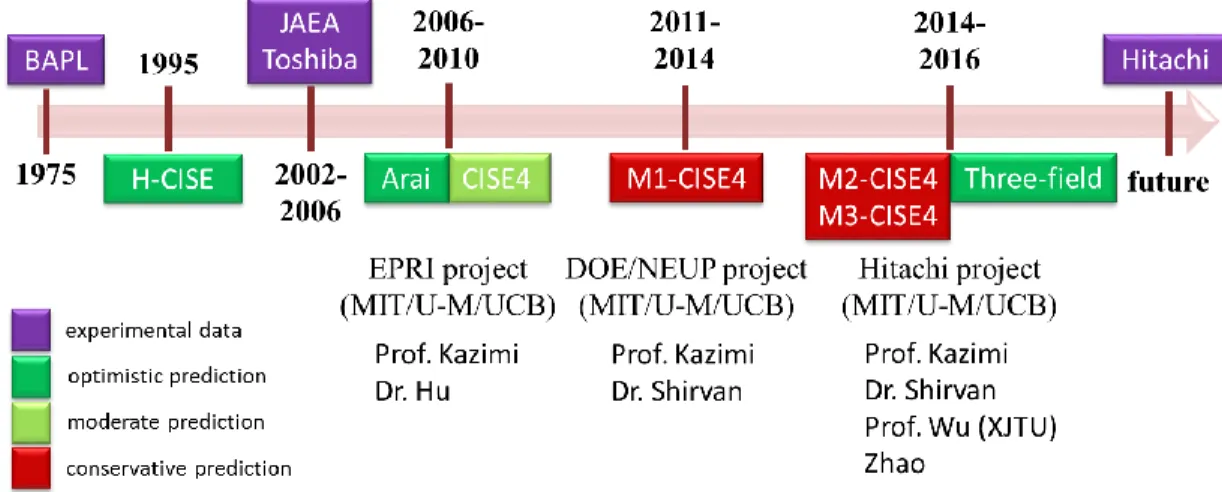
Figure 5. Dryout research timeline for tight bundles and more specifically RBWR. ... 18
Figure 6. M1-CISE4: tube critical power results. ... 22
Figure 7. First annulus data reference: axial heat flux profile for the third test section (from Beus and Seebold, 1981)... 23
Figure 8. Second annulus data reference: axial heat flux profile for the second test section (from Beus and Humphreys, 1979). ... 24
Figure 9. M1-CISE4: annulus critical power results. ... 27
Figure 10. JAEA-A: schematic view (from Kureta et al., 2002). ... 28
Figure 11. JAEA-B: schematic view (from Liu et al., 2004). ... 29
Figure 12. JAEA-B: axial power distribution profile (from Liu et al., 2004)... 30
Figure 13. JAEA-C & D: 37-rod bundle configuration (from Liu et al., 2007). ... 30
Figure 14. JAEA-C & D: axial power distribution profile (from Liu et al., 2007)... 31
Figure 15. Toshiba 7-rod bundle: schematic view and axial power distribution profile (from Yamamoto et al., 2006). ... 31
Figure 16. Toshiba 14-rod bundle: radial power distribution (from Yamamoto et al., 2006). .... 32
Figure 17. M1-CISE4: tight bundle critical power results. ... 34
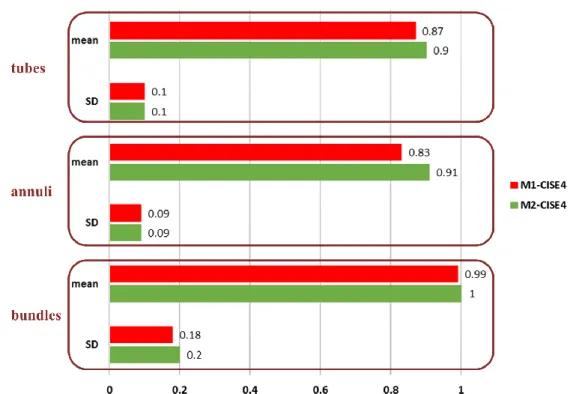
Figure 18. Predicted/experimental critical power (PECP) mean and SD values for tubes, annuli, and tight bundles with M1-CISE4 and M2-CISE4 correlations. ... 38
Figure 19. Look-up table: tube critical quality results (at 7±0.5 MPa). ... 40
Figure 20. Pressure effect on tight bundle critical power (M2-CISE4). ... 41
Figure 21. Mass flux and tightness effect on tight bundle critical power (M2-CISE4)... 42
Figure 22. Inlet temperature effect on tight bundle critical power (M2-CISE4). ... 42
Figure 23. Heated length and APD effect on tight bundle critical power (M2-CISE4). ... 43
Figure 24. JAEA-A & B experimental vs. predicted (M2-CISE4) critical quality. ... 45
Figure 25. VIPRE-01 single-phase verification test case #1 geometric view. ... 55
Figure 27. VIPRE-01 single-phase verification test case #1 outflow mass flux. ... 57
Figure 28. VIPRE-01 single-phase verification test case #2-4 geometric view. ... 57
Figure 29. VIPRE-01 single-phase verification test case #2-4 outflow mass flux (adiabatic, no turbulent mixing). ... 59
Figure 30. VIPRE-01 single-phase verification test case #2 outflow mass flux (axially uniform heat flux of 100 kW/m2, no turbulent mixing). ... 59
Figure 31. VIPRE-01 single-phase verification test case #2 outflow mass flux (adiabatic, sensitivity to turbulent mixing coefficient). ... 60
Figure 32. VIPRE-01 single-phase verification test case #2 outflow quality (xavg, exit = 0.16, sensitivity to turbulent mixing coefficient in two-phase). ... 61
Figure 33. VIPRE-01 two-phase verification test case #1 side view (from Kureta, 2007). ... 62
Figure 34. Photograph of honeycomb-type spacer (from Yamamoto et al., 2006). ... 63
Figure 35. VIPRE-01 two-phase verification test case #1 exit void fraction (partially reproduced from Kureta et al., 2008). ... 64
Figure 36. VIPRE-01 two-phase verification test case #1 mass flux axial distribution. ... 64
Figure 37. VIPRE-01 two-phase verification test case #2 configuration. ... 65
Figure 38. VIPRE-01 two-phase verification test case #2 exit quality - flat local power distribution (partially reproduced from Tamai et al., 2003). ... 66
Figure 39. VIPRE-01 two-phase verification test case #2 exit quality - side peak local power distribution (partially reproduced from Tamai et al., 2003). ... 67
Figure 40. VIPRE-01 tight bundle test sections sub-channel schemes. ... 68
Figure 41. VIPRE-01 tight bundles peak-to-average quality ratio (Rf_x) mean values. ... 71
Figure 42. Predicted/experimental critical power (PECP) mean and SD values for tubes, annuli, and tight bundles with M2-CISE4 and M3-CISE4 correlations. ... 73
Figure 43. Mass flux and tightness effect on tight bundle critical power (M3-CISE4)... 74
Figure 44. Heated length and APD effect on tight bundle critical power (M3-CISE4). ... 75
Figure 45. Schematic view of the three-field model (reproduced from Okawa et al., 2003). ... 79
Figure 46. Predicted/experimental critical power (PECP) mean and SD values for tubes and annuli with M3-CISE4 correlation and three-field model. ... 85
Figure 47. Predicted/experimental critical power (PECP) mean values for tight bundle tests with three-field model (no calibration). ... 86
Figure 48. Predicted/experimental critical power (PECP) mean values for tight bundle tests with M3-CISE4 correlation and three-field model. ... 87
Figure 49. RBWR-TB2 bundle sub-channel scheme. ... 91
Figure 50. JAEA-A & B experimental vs. VIPRE-01 critical quality. ... 125
List of Tables
Table I. Overall design parameters of RBWR-AC and RBWR-TB2 (reproduced from Shirvan
and Kazimi, 2015). ... 16
Table II. Dryout experiment test parameters for tubes. ... 21
Table III. Dryout experiment test parameters for annuli. ... 23
Table IV. Dryout experiment test parameters for tight lattice bundles. ... 28
Table V. Parameter ranges for the M2-CISE4 correlation. ... 38
Table VI. PECP mean and SD values for all test sections with M1-CISE4 and M2-CISE4 correlations. ... 39
Table VII. VIPRE-01 single-phase verification test case #1 parameters. ... 56
Table VIII. VIPRE-01 single-phase verification test case #2-4 parameters. ... 58
Table IX. VIPRE-01 two-phase verification test case #1 parameters. ... 62
Table X. VIPRE-01 two-phase verification test case #2 parameters. ... 66
Table XI. VIPRE-01 principal constitutive models for tight bundle tests. ... 69
Table XII. VIPRE-01 tight bundles peak-to-average quality ratio (Rf_x) values summary. ... 70
Table XIII. PECP mean and SD values for tight bundle test sections with original CISE4, M2-CISE4, and M3-CISE4 correlations. ... 74
Table XIV. Critical quality and MCPR evaluation of RBWR-AC and RBWR-TB2 with four different models. ... 90
Table XV. Critical quality and MCPR evaluation of RBWR-TB2 with M3-CISE4 correlation and three-field model. ... 92
Table XVI. Sensitivity of MCPR for RBWR-TB2 with M3-CISE4 correlation and three-field model to design parameters. ... 92
Nomenclature
AC: Actinide Consumer
APD: Axial Power Distribution
BAPL: Bettis Atomic Power Laboratory BFBT: BWR Full-size Fine-mesh Bundle Test BOC: Beginning of Cycle
BWR: Boiling Water Reactor
CFD: Computational Fluid Dynamics CHF: Critical Heat Flux
CPR: Critical Power Ratio CR: Conversion Ratio
DNB: Departure from Nucleate Boiling EOC: End of Cycle
EPRI: Electric Power Research Institute FR: Fast Reactor
JAEA: Japan Atomic Energy Agency
JAERI: Japan Atomic Energy Research Institute LWR: Light Water Reactor
M1-CISE4: Modified CISE4 version 1 M2-CISE4: Modified CISE4 version 2 M3-CISE4: Modified CISE4 version 3 MCPR: Minimum Critical Power Ratio
MDNBR: Minimum Departure from Nuclear Boiling Ratio MEFISTO: Mechanistic Film Sub-channel Tool
MIT: Massachusetts Institute of Technology
NASCA: Nuclear reactor Advanced Sub-Channel Analysis NRC: Nuclear Regulatory Commission (U.S.)
NSE: Nuclear Science and Engineering (department of) NUPEC: Nuclear Power Engineering Corporation OAF: Onset of Annular Flow
ONB: Onset of Nucleate Boiling OTC: One-Through Cycle
PECP: Predicted over Experimental Critical Power PWR: Pressurized Water Reactor
RBWR: Resource-renewable BWR
RMWR: Reduced-Moderation Water Reactor SD: Standard Deviation
TB2: Transuranic Burner TRU: Transuranic
UCB: University of California, Berkeley U-M: University of Michigan
1. Introduction
1.1. Background
By the end of the 20th century, a Boiling Water Reactor (BWR) design aiming to provide long-term energy supply, referred to as the Resource-Renewable BWR (RBWR), was proposed by Hitachi, Ltd. (Takeda et al., 1995). Over 90% of the world’s commercial power producing nuclear reactors are water cooled and moderated. Except for its reactor core, the RBWR is fully based on the most advanced and proven BWR technology.
Similar to a Gen-IV fast reactor (FR), the RBWR is capable of consuming actinides of the current light water reactor (LWR) spent fuel as well as breeding new nuclear fuel. Sustainability can be attained with the RBWR, i.e. fissile material inventory stays the same throughout the lifetime of the fuel in the reactor. This will extend current uranium ore reserves to last by over 1,000 years, a solution to the global increase in energy demand. Moreover, by burning transuranics (TRUs) in the spent fuel, the RBWR can reduce the long-term radioactivity by orders of magnitude. Figure 1 shows natural uranium requirement and TRU inventory for the next 100 years in the U.S., assuming a 2.5% nuclear energy demand growth rate. The RBWR design is able to achieve similar performance as a FR with a conversion ratio (CR) of 1.0 in terms of uranium utilization and reduce the TRU inventory in the system to half way between FRs and current once-through cycle (OTC) LWRs. Additionally, the RBWR is an attractive option in terms of potential economic performance and ease in licensing compared to FRs for which zero commercial experience is available.
Figure 1. Natural uranium requirement (left) and TRU inventory (right) for OTC LWR, RBWR, and FR scenarios (reproduced from Passerini and Kazimi, 2012).
With the objective of providing actinide breeding and burning capabilities, the RBWR core design has different features from a conventional BWR in order to achieve a harder neutron spectrum: the fuel bundles are shorter (~1/3, to facilitate neutron leakage) with a tight hexagonal lattice (to reduce volume occupied by water) and axially heterogeneous, blanket-fissile-blanket-fissile-blanket axial zoning (to achieve negative void coefficient of reactivity). Figure 2 compares the RBWR geometry to that of a regular BWR, and Figure 3 depicts its axial fuel composition.
Figure 2. Geometry of a BWR square (left) and an RBWR hexagonal (right) fuel bundle (from Uchikawa et al., 2009).
Compared to a regular BWR, the RBWR coolant flowrate is much lower (~1/3) to increase the coolant void fraction (from 30-40% to ~60%) for reduced neutron moderation. The lower coolant flowrate also gives rise to higher coolant exit quality (from ~15% to ~40%). The two RBWR designs selected for this study are: AC (Actinide Consumer) as a breeder reactor, and TB2 (Transuranic Burner) as a burner reactor1. Table I compares main design parameters between RBWR-AC and TB2, and Figure 4 illustrates the double-humped axial power distribution profile for both designs.
Table I. Overall design parameters of RBWR-AC and RBWR-TB2 (reproduced from
Shirvan and Kazimi, 2015).
Item RBWR-AC RBWR-TB2
Thermal power [MWt] 3926 3926
Fuel rod diameter [cm] 1.005 0.72
Core height [m] 1.347 1.015
Number of fuel bundles 720 720
Number of rods per assembly 271 397
Coolant average flow rate [kt/h] 22 22
Core average pressure [MPa] 7.2 7.2
Inlet enthalpy [kJ/kg] 1250 1250
Assembly average mass flux [kg/m2-s] 896 573
Hydraulic/Heated Diameter [mm] 4.1/4.4 6.1/6.6
Core radial power peaking factor 1.3 1.2
Figure 4. RBWR-AC (left) and TB2 (right) relative axial power distribution (from Downar and Kazimi, 2015).
1 A breeder reactor is capable of generating at least the same amount of fissile material as it consumes, while the goal
of a burner reactor is to destroy transuranics rather than to increase fissile fuel. 0 0.5 1 1.5 2 2.5 3 3.5 0 30 60 90 120 150 P ea k in g Facto r Axial Height (cm) BOC EOC 0 0.5 1 1.5 2 2.5 3 3.5 0 30 60 90 120 150 P ea k in g Facto r Axial Height (cm) BOC EOC
1.2. Motivation
Different core geometry, combined with higher power-to-flow ratio and larger void fraction conditions, demands re-examination of the standard BWR thermal hydraulic models for the RBWR application. One of the most important constraints on the operation of a BWR is the thermal margin to dryout occurrence, also known as the Minimum Critical Power Ratio (MCPR). Dryout, referred to as the evaporation and disappearance of liquid film in annular flow, constitutes the practical limit for the BWR type reactor power, and its accurate prediction is of crucial importance for safe operation.
As presented in Figure 5, limited dryout experimental data and few critical power correlations for tight bundles are available. The first tight bundle experiment was carried out at Bettis Atomic Power Laboratory (BAPL) in 1975. Twenty years later, when the RBWR design was conceived, Hitachi developed a modified CISE correlation (referred here as H-CISE), which was based on the CISE4 formulation (Gaspari et al., 1974), to predict the MCPR. The JAEA (Japan Atomic Energy Agency) and Toshiba Corporation tight bundle tests were then conducted to better represent RBWR geometry and operating conditions compared to BAPL experiments. Following those tests, the U.S. RBWR projects started in 2006, led by MIT, University of Michigan (U-M), and UC Berkeley (UCB). MIT was in charge of the thermal hydraulic assessment in cooperation with Hitachi and conducted by Prof. Kazimi, Dr. Hu, and later on Dr. Shirvan and Prof. Wu. Different correlations, standard or modified versions, have been used for predicting the MCPR of the RBWR that resulted in a wide range of predictions. In the near future, Hitachi plans to carry out a new dryout test dedicated to its RBWR design.
Recent work at MIT by Shirvan et al. (2013) focused on collecting dryout database representative of RBWR fuel bundle geometry and operating conditions, i.e. BAPL, JAEA and Toshiba test sets which will be detailed in section 2.3, and derived a best-estimate model for the prediction of critical quality/power, named as M1-CISE4 (modified CISE4 version 1) correlation. Like the initial Hitachi correlation (H-CISE), M1-CISE4 is grounded in the CISE4 critical quality - boiling length type formulation which depends on bundle-averaged thermal hydraulic conditions. This model
showed significant scatter when compared to experimental data in its validity range. In order to better quantify the effect of different parameters, and help validate the updated models, round tube (detailed in section 2.1) and annulus (section 2.2) dryout data that are representative of the RBWR hydraulic diameter and operating conditions are integrated in the database.
Figure 5. Dryout research timeline for tight bundles and more specifically RBWR.
The original CISE4 formulation only depends on bundle-averaged pressure, mass flux, boiling length, and the ratio of heated to wetted perimeters. This one-dimensional analysis approach neglects the intra-assembly channel mixing for a rod bundle, which would result in an under-prediction of the critical power. But on the other hand, the fact that it also neglects the local rod peaking within the bundle could compensate for the critical power underestimation. Sub-channel analysis is capable of providing radial flow and quality distribution within a bundle, and thus capturing the effect of inter-channel mixing as well as non-uniform radial heating. Moreover, the configuration of spacer grids also has an impact on the dryout, and can be embodied in sub-channel analysis codes. Therefore, in order to reduce the spread in prediction of critical power data, sub-channel analysis will be employed in this work.
Additionally, the non-uniform axial power distribution (APD) may, if not dominantly, influence the critical power, and its effect is difficult to be captured in simple 1-D correlations like CISE4 due to the strong interference between various parameters. Besides the sub-channel analysis in which APD will be specified and accounted for in each case, it has been shown that the influence
of APD on dryout can be captured via the three-field model (Anglart, 2010). The latter relies on a mechanistic approach to resolve relevant field (liquid film, entrained droplets, and vapor) mass balance equations within the annular flow regime, and is considered as one of the most promising mathematical tools to achieve the purpose of accurate critical power prediction (Okawa et al., 2003).
1.3. Thesis Objective and Outline
The objective of the thesis is to derive best-estimate critical power prediction models that can correctly capture the unique features of axially heterogeneous tight bundle designs, more specifically those of an RBWR.
The thesis will start with the assessment of the previously derived M1-CISE4 correlation against experimental data for tubes, annuli, and tight bundles (Chapter 2). An updated correlation, M2-CISE4 (modified M2-CISE4 version 2), will be developed and evaluated in Chapter 3. Effects of different parameters on the critical power (predicted and experimental) will be surveyed and discussed. Chapter 4 will focus on sub-channel analysis of tight bundles with the code VIPRE-01 which provides radial quality distribution information to be incorporated in Chapter 5: M3-CISE4 (modified CISE4 version 3) correlation development and assessment. Chapter 6 will present the three-field model with its governing equations and constitutive relations, as well as its prediction of dryout against experiments. The MCPR evaluation of RBWR-AC and TB2 will be investigated in Chapter 7 with all the models mentioned earlier. Chapter 8 summarizes the observations and conclusions drawn from the work performed for the thesis, and discusses recommended future research.
2. M1-CISE4 Correlation Assessment
The first step of the thesis consists of evaluating the ability of previously derived M1-CISE4 correlation by Shirvan et al. (2013) to accurately predict the dryout critical power for all the three types of heated geometries: tubes, annuli, and tight bundles. As shown in Equation (1), a one-dimensional critical quality - boiling length type correlation was opted as it was deemed easier and simpler than other models which would require sub-channel analysis for tight bundle cases. The critical quality only depends on bundle-averaged hydraulic & heated diameter, exit pressure, mass flux, and boiling length. For this work, all data processing and critical power modeling were performed in Matlab. The M1-CISE4 is given by:
𝑥𝑐𝑟 = 𝐷𝑒 𝐷ℎ× 𝑎×𝐿𝑏 𝑏+𝐿𝑏 (1) where 𝑎 = [1 + 1.481 × 10⁻⁴(1 − 𝑃 𝑃𝑐) −3 0.7𝐺]−1 if 𝐺 ≤ 𝐺∗, and 𝑎 = (1 − 𝑃 𝑃𝑐) /( 0.7𝐺 1000) 1/3 if 𝐺 > 𝐺∗, with 𝐺∗ = 3375 (1 − 𝑃 𝑃𝑐) 3 ; 𝑏 = 0.199(𝑃𝑐 𝑃 − 1) 0.4𝐺𝐷 𝑒1.2.
𝑥𝑐𝑟 = critical quality; 𝐷𝑒 = hydraulic diameter (m); 𝐷ℎ = heated diameter (m); 𝐿𝑏 = boiling length (m); 𝑃 = exit pressure (MPa); 𝑃𝑐 = critical pressure (MPa); 𝐺 = mass flux (kg/m2-s). Terms 𝑎 and 𝑏 were adjusted in M1-CISE4 so as to fit tight bundle data.
2.1. Tube Data
The Thompson and Macbeth (1964) vertical, uniformly heated round tube dryout database is used to compare with the predicted critical power using M1-CISE4.Tests were performed at a variety of tube diameters and operating conditions. In order to be compatible with the RBWR design
specifications, a total of 390 burnout data points are selected, and ranges of parameters are summarized in Table II.
Table II. Dryout experiment test parameters for tubes.
Test APD Number
of data Pressure [MPa] Mass flux [kg/m2-s] Diameter [mm] Heated length [m]
Thompson & Macbeth (1964) Uniform 390 1 - 7.1 241 - 1,980 3.9 - 7.8 0.86 - 3.12
The results of tube critical power prediction by M1-CISE4 are presented in Figure 6. The average predicted over experimental critical power (PECP) is equal to 0.87 with a standard deviation (SD) of 0.10. In other words, M1-CISE4 under-estimates the tube data by 13%.
One can see from Figure 6 that M1-CISE4 markedly under-predicts the critical power at pressures higher than 4 MPa, at mass fluxes over 1,500 kg/m2-s, and for tube diameter of 5.6 mm. The trend of increasing PECP with increasing heated length is observed.
(a) 0 20 40 60 80 0 20 40 60 80 P re d icte d Crit ica l P o w er [k W ]
(b) (c)
(d) (e)
Figure 6. M1-CISE4: tube critical power results.
(a) predicted vs. experimental critical power; (b) PECP vs. pressure; (c) PECP vs. mass flux; (d) PECP vs. tube diameter; (e) PECP vs. heated length.
2.2. Annulus Data
Four references have been used for the evaluation of internally heated annuli critical power prediction, as presented in Table III with selected parameter ranges.
0.0 0.5 1.0 1.5 2.0 0 2 4 6 8 P ECP Pressure [MPa] mean mean +/- 2 SD 0.0 0.5 1.0 1.5 2.0 0 500 1000 1500 2000 P ECP Mass Flux [kg/m2-s] mean mean +/- 2 SD 0.0 0.5 1.0 1.5 2.0 3 4 5 6 7 8 P ECP Diameter [mm] mean mean +/- 2 SD 0.0 0.5 1.0 1.5 2.0 0 1 2 3 4 P ECP Heated Length [m] mean mean +/- 2 SD
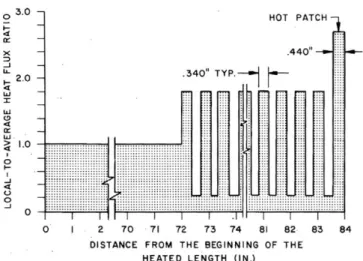
In the first reference (Beus and Seebold, 1981), the annulus is 2.13 m long and tests are performed by employing three different APDs: the first test section with a uniform power distribution; the second with 1.52 m uniform and 0.61 m alternate high and low heat flux segments (with local-to-average heat flux ratios of 1.27 and 0.16 respectively); and the third with a 5.46 cm hot patch (with a peak-to-average heat flux ratio of 2.19) near the outlet, as shown in Figure 7. Experimental data indicate that the thermal performance of the annulus was unaffected by the alternate high and low heat flux profile or the presence of hot patch compared to the uniform power distribution.
Table III. Dryout experiment test parameters for annuli.
Test APD Number
of data Pressure [MPa] Mass flux [kg/m2-s] Hydraulic diameter [mm] Heated diameter [mm] Heated length [m] Axial peaking factor
Beus and Seebold (1981)
Uniform 22 5.5 - 11 336 - 1,363 5.6 15.2 2.13 1.0 Alternate 11 1.27 Alternate with hot patch 9 2.19
Beus and Humphreys (1979)
Alternate 18
5.5 - 11 290 - 1,248 5.5 14.8 2.13
1.76 Alternate with
hot patch 14 2.7
Mortimore and Beus (1979)
Uniform 15
8.3 - 11 332 - 1,396 5 13.3 2.13
1.0 Hot patch of 1.5
heat flux ratio 12 1.5
Hot patch of 2.25
heat flux ratio 14 2.25
Janssen and Kervinen (1963) Uniform 282 4.1 - 10.2 354 - 1,980 8.5 22.3; 24.6 1.8 - 2.7 1.0
Figure 7. First annulus data reference: axial heat flux profile for the third test section (from Beus and Seebold, 1981).
The experimental configurations in the second reference (Beus and Humphreys, 1979) are very similar to those in the first reference. Tests are performed by employing two different APDs: the first test section with 1.83 m uniform and 0.3 m square wave alternating heat flux segments (with a maximum-to-average heat flux ratio of 1.76); and the second with a 1.12 cm hot patch (with a peak-to-average heat flux ratio of 2.7) near the outlet, as shown in Figure 8. Like the first reference, no significant critical heat flux (CHF) penalty due to the non-uniform heat flux profile was observed in the experiments.
Figure 8. Second annulus data reference: axial heat flux profile for the second test section (from Beus and Humphreys, 1979).
Experiments performed in the third reference (Mortimore and Beus, 1979) are under similar conditions as in the two previous sources. Three different test sections are employed with: (1) axially uniform heat flux over the entire length of 2.13 m; (2) axially uniform heat flux over 2.08 m with hot patch over the last 5.08 cm with a 1.5 heat flux ratio; and (3) axially uniform heat flux over 2.08 m with a hot patch over the last 5.08 cm with a 2.25 heat flux ratio. Experimental results suggest that the hot-patches did not affect CHF over the range of variables tested.
In the last reference (Janssen and Kervinen, 1963), the rod is uniformly heated in annular geometry with ranges of parameters quite different from those in the other references. The major disparity occurs by a significantly larger hydraulic diameter (8.5 mm) which is well beyond that of the RBWR designs (4-6 mm). The pressure and mass flux ranges are also wider, and the heated length can reach up to 2.7 m compared to 1-1.3 m in an RBWR.
The comparison between experimental and predicted critical power (with M1-CISE4) is illustrated in Figure 9. The average PECP is 0.83 with a SD of 0.09. The last reference has the most data but yields significant under-estimation of critical power (mean PECP of 0.81 for the last data source only). It can be noticed that the effect of pressure is well captured by M1-CISE4, though no low pressure (less than 4 MPa) data is available. The effect of hydraulic-over-heated-diameter (De/Dh)
is also well captured. The PECP slightly increases with increasing mass flux, whilst it decreases when the hydraulic diameter is larger. The PECP trend as a function of heated length for annulus data differs from that for tubes, as shown in Figure 6(e) and Figure 9(f).
(a)1
1 Legend: “1-UNI” = first reference - uniform; “1-ALT” = first reference - alternate; “1-ALT w/ HP” = first reference
- alternate with hot patch; “2-ALT” = second reference - alternate; “2-ALT w/ HP” = second reference - alternate with hot patch; UNI” = third reference - uniform; HP1.5” = third reference - hot patch of 1.5 heat flux ratio; “3-HP2.25” = third reference - hot patch of 2.25 heat flux ratio; “4-UNI” = fourth reference - uniform.
0 100 200 300 400 500 0 100 200 300 400 500 P re d icte d Crit ica l P o w er [k W ]
Experimental Critical Power [kW]
1-UNI 1-ALT 1-ALT w/ HP 2-ALT 2-ALT w/ HP 3-UNI 3-HP1.5 3-HP2.25 4-UNI
(b) (c) (d) 0.0 0.5 1.0 1.5 2.0 4 6 8 10 12 P ECP Pressure [MPa] 1-UNI 1-ALT 1-ALT w/ HP 2-ALT 2-ALT w/ HP 3-UNI 3-HP1.5 3-HP2.25 4-UNI mean mean +/- 2 SD 0.0 0.5 1.0 1.5 2.0 0 500 1000 1500 2000 P ECP Mass Flux [kg/m2-s] 1-UNI 1-ALT 1-ALT w/ HP 2-ALT 2-ALT w/ HP 3-UNI 3-HP1.5 3-HP2.25 4-UNI mean mean +/- 2 SD 0.0 0.5 1.0 1.5 2.0 4 5 6 7 8 9 P ECP Hydraulic Diameter [mm] 1-UNI 1-ALT 1-ALT w/ HP 2-ALT 2-ALT w/ HP 3-UNI 3-HP1.5 3-HP2.25 4-UNI mean mean +/- 2 SD
(e)
(f)
Figure 9. M1-CISE4: annulus critical power results.
(a) predicted vs. experimental critical power; (b) PECP vs. pressure; (c) PECP vs. mass flux; (d) PECP vs. hydraulic diameter; (e) PECP vs. hydraulic/heated diameter; (f) PECP
vs. heated length.
2.3. Tight Bundle Data
The tight lattice rod bundle critical power experimental tests used as calibration database for the M1-CISE4 correlation and corresponding parameter ranges are listed in Table IV. Unlike in
Shirvan et al. (2013), the limited data publically available from BAPL are not included due to its
0.0 0.5 1.0 1.5 2.0 0.34 0.35 0.36 0.37 0.38 0.39 P ECP
Hydraulic Diameter / Heated Diameter
1-UNI 1-ALT 1-ALT w/ HP 2-ALT 2-ALT w/ HP 3-UNI 3-HP1.5 3-HP2.25 4-UNI mean mean +/- 2 SD 0.0 0.5 1.0 1.5 2.0 1.6 1.9 2.2 2.5 2.8 P ECP Heated Length [m] 1-UNI 1-ALT 1-ALT w/ HP 2-ALT 2-ALT w/ HP 3-UNI 3-HP1.5 3-HP2.25 4-UNI mean mean +/- 2 SD
unconventional geometric configuration (parallelogram shape channel box). As listed in Table IV, the selected experiments were carried out in JAEA and Toshiba Corporation. They differ in bundle geometry, including the number and arrangement of heater rods, shape, tightness, and heated length of the bundle, as well as working conditions such as axial and local power distribution, pressure, and mass velocity.
Table IV. Dryout experiment test parameters for tight lattice bundles.
Test Number of rods APD Number of data Pressure [MPa] Mass flux [kg/m2-s] Hydraulic diameter [mm] Heated diameter [mm] Heated length [m] JAEA-A (Kureta and Akimoto, 2003) 7 Uniform 129 1 - 8.5 298 - 2,489 2.35 3.56 1.8 JAEA-B (Liu et al., 2004) 7 Double-humped 116 2 - 8.4 300 - 1,381 2.86 4.34 1.26 JAEA-C (Liu et al., 2007) 37 Double-humped 117 2 - 9 206 - 1,005 4.42 5.32 1.26 JAEA-D (Liu et al., 2007) 37 Double-humped 147 2 - 9 300 - 1,500 3.71 4.45 1.26 Toshiba-1 (Yamamoto et al., 2006) 7 Stepped cosine 6 7 472 - 1,744 4.85 7.29 1.6 Toshiba-2 (Yamamoto et al., 2006) 7 Stepped cosine 13 7 489 - 1,961 5.91 9.03 0.8; 1.6 Toshiba-3 (Yamamoto et al., 2006) 7 Stepped cosine 6 7 600 - 1,711 7.03 10.95 1.6 Toshiba-4 (Yamamoto et al., 2006) 14 Stepped cosine 31 1 - 8 385 - 1,764 5.74 9.55 1.6
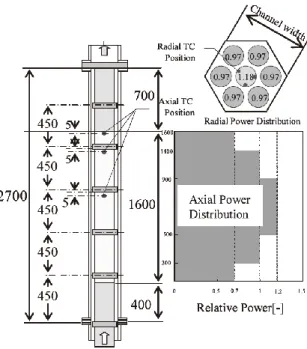
The JAEA-A test section (Kureta and Akimoto, 2003) simulates the fuel assembly of a reduced-moderation water reactor (RMWR) designed by the Japan Atomic Energy Research Institute (JAERI1), a water-cooled breeder reactor with a core of tight triangular fuel rod arrangement. As shown in Figure 10, the bundle contains 7 heater rods (one center rod and six peripheral rods) of 12.3 mm in diameter with rod-rod gap of 1 mm and rod-shroud gap of 0.5 mm. The test section is uniformly heated along the 1.8 m bundle length. The center rod operates with a nominal radial local peaking factor (Rf) of 1.3.
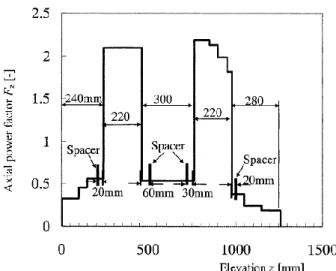
The JAEA-B test section (Liu et al., 2004) also simulates the RMWR tight lattice bundle behavior but employs an axial 12-step double-humped power distribution, as outlined in Figure 11 and Figure 12. Its geometry is very similar to that of JAEA-A, but with a larger rod diameter (13 mm) and gaps (1.3 mm of rod-rod gap and 0.65 mm of rod-shroud gap). The heated length is significantly reduced to 1.26 m. A nominal Rf value of 1.4 was chosen in this experiment.
Figure 11. JAEA-B: schematic view (from Liu et al., 2004).
Figure 12. JAEA-B: axial power distribution profile (from Liu et al., 2004).
The JAEA-C and JAEA-D experiments (Liu et al., 2007) use a 37-rod bundle with 13 mm rod diameter and were performed with a double-humped APD. The cross-sectional configuration is shown in Figure 13, and the axial power shape is illustrated in Figure 14. JAEA-C bundle has a 1.3 mm rod-rod gap and 1.05 mm rod-shroud gap, whilst JAEA-D bundle is tighter with a 1 mm rod-rod gap and 0.75 mm rod-shroud gap. The heated length is equal to 1.26 m in both cases. The 37-rod experiments mainly focused on uniformly heated transverse conditions (Rf = 1.0).
Figure 14. JAEA-C & D: axial power distribution profile (from Liu et al., 2007).
Figure 15. Toshiba 7-rod bundle: schematic view and axial power distribution profile (from Yamamoto et al., 2006).
The Toshiba test sets (Yamamoto et al., 2006) were performed with two types of tight bundles: one is a 7-rod bundle with a hexagonal channel box (Figure 15), and the other is a 14-rod bundle with a rectangular channel box. The first three test sections use the same 7-rod bundle but differ in bundle tightness: 0.8 mm rod gap and 2.2 mm shroud gap for Toshiba-1, 1.3 mm rod-rod gap and 2.57 mm rod-rod-shroud gap for Toshiba-2, 1.8 mm rod-rod-rod-rod gap and 2.99 mm rod-rod-shroud gap for Toshiba-3. Toshiba-4 uses the 14-rod bundle with a 1.3 mm rod gap and 2.7/3.78 mm
rod-shroud gap1. All the four experiments have the same rod diameter of 10.8 mm and heated length of 1.6 m (except for Toshiba-2 in which some data were obtained with a reduced length of 0.8 m), and employed a stepped-cosine shape APD2, as shown in Figure 15. The nominal radial peaking factor equals to 1.18 for the three 7-rod bundle tests, and 1.15 for the 14-rod bundle test (Figure 16).
Figure 16. Toshiba 14-rod bundle: radial power distribution (from Yamamoto et al., 2006).
(a)
1 Erratum in Yamamoto et al. (2006): Toshiba-4 (14-rod) channel width should be 52.2 mm × 49.8 mm.
2 In the case of the short heated length of 0.8 m in Toshiba-2, the upper half of the heated region does not exist in
Figure 15, i.e. the APD shape becomes outlet-peak instead of stepped-cosine.
0 400 800 1200 1600 2000 0 400 800 1200 1600 2000 P re d icte d Crit ica l P o w er [k W ]
Experimental Critical Power [kW]
JAEA-A JAEA-B JAEA-C JAEA-D Toshiba-1 Toshiba-2 Toshiba-3 Toshiba-4
(b) (c) (d) 0.0 0.5 1.0 1.5 2.0 0 2 4 6 8 10 P ECP Pressure [MPa] JAEA-A JAEA-B JAEA-C JAEA-D Toshiba-1 Toshiba-2 Toshiba-3 Toshiba-4 mean mean +/- 2 SD 0.0 0.5 1.0 1.5 2.0 0 500 1000 1500 2000 2500 P ECP Mass Flux [kg/m2-s] JAEA-A JAEA-B JAEA-C JAEA-D Toshiba-1 Toshiba-2 Toshiba-3 Toshiba-4 mean mean +/- 2 SD 0.0 0.5 1.0 1.5 2.0 2 3 4 5 6 7 8 P ECP Hydraulic Diameter [mm] JAEA-A JAEA-B JAEA-C JAEA-D Toshiba-1 Toshiba-2 Toshiba-3 Toshiba-4 mean mean +/- 2 SD
(e)
(f)
Figure 17. M1-CISE4: tight bundle critical power results.
(a) predicted vs. experimental critical power; (b) PECP vs. pressure; (c) PECP vs. mass flux; (d) PECP vs. hydraulic diameter; (e) PECP vs. hydraulic/heated diameter; (f) PECP
vs. heated length.
As for position where dryout occurred, for uniform and stepped-cosine APD cases (JAEA-A, Toshiba 1 through 4), it first occurred at bundle exit; for double-humped shape APD (JAEA-B through D), it occurred earlier at the outlet1 if the mass velocity was low (in general below 600
1 also called complete dryout 0.0 0.5 1.0 1.5 2.0 0.5 0.6 0.7 0.8 0.9 P ECP
Hydraulic Diameter / Heated Diameter
JAEA-A JAEA-B JAEA-C JAEA-D Toshiba-1 Toshiba-2 Toshiba-3 Toshiba-4 mean mean +/- 2 SD 0.0 0.5 1.0 1.5 2.0 0.7 1.0 1.3 1.6 1.9 P ECP Heated Length [m] JAEA-A JAEA-B JAEA-C JAEA-D Toshiba-1 Toshiba-2 Toshiba-3 Toshiba-4 mean mean +/- 2 SD
kg/m2-s but varies with different tests), or near the end of the second hump1 if the mass velocity was high.
The results of tight lattice bundle critical power prediction by M1-CISE4 are reported in Shirvan et al. (2013) and independently replicated for further investigation and improvement. The average PECP equals to 0.99 with a SD of 0.18. Figure 17 depicts the parameter effects on the overall performance of M1-CISE4 (reflected by values of PECP), and more detailed discussion about the dependence of critical power on different parameters (pressure, mass flux, bundle tightness, heated length, APD, Rf, etc.) is included in the next chapter.
2.4. Conclusion
About 800 round tube and annulus data that are representative of the RBWR flow characteristics have been integrated in the database of over 550 tight bundle data to validate the formerly derived M1-CISE4 correlation. As presented in the previous sections, M1-CISE4 under-predicts tube and annulus dryout data by respectively 13% and 17% in average within the selected parameter ranges. An updated critical power correlation is necessary to improve the prediction with regard to tube and annulus geometry.
In terms of parameter effects, it is tough to draw conclusions based on the overall PECP results (Figure 6, Figure 9, and Figure 17). Sensitivity analysis will be performed and detailed in the next chapter along with the updated correlation, namely M2-CISE4.
3. M2-CISE4 Correlation Development and Assessment
3.1. Methodology
As discussed in chapter 2, the M1-CISE4 correlation significantly under-estimates tube and annulus critical power (by 13% and 17% respectively), and does not account for the rod radial heating factor (even though this was somewhat covered in the original CISE4 formulation by the presence of hydraulic-to-heated diameter ratio term and counter-balanced by the non-consideration of intra-assembly flow mixing in the one-dimensional modeling). The scatter in PECP results between different test sets and even within certain experiments also needs to be addressed.
The updated critical power correlation, referred to as M2-CISE4, will focus on predicting tube and annulus data as accurately as possible and aim to achieve an average PECP of 1.0 for tight bundles. The impact of different parameters should be correctly captured.
The methodology for the development of M2-CISE4 is as follows:
Calibrate the correlation by modifying coefficients and exponents in a and b terms to fit tube data as closely as possible;
Calibrate the correlation by modifying coefficients and exponents in a, b and (De/Dh) terms
to fit annulus data as closely as possible;
Introduce the Rf factor, and calibrate the correlation by modifying coefficients and
exponents in a, b and (De/Dh) terms to fit tight bundle data (average PECP = 1.0).
Like the original CISE4 and M1-CISE4, the updated M2-CISE4 correlation does not account for the non-uniform axial power distribution, since annuli experiments with non-uniform heating up to 2.7 times the average heat flux did not show any significant impact on critical power. Also as dryout is a global phenomenon, its dependence on local heat flux is not supposed to be over-arching. However, literature review suggests that the shape of non-uniform APD upstream the location of dryout could affect the critical power, as presented later in section 3.3.4.
The effect of radial peaking factor (Rf) on experimental critical power has been surveyed, and
Rf increases from 1.0 to 1.3; in JAEA-C & D, critical power decreases by about 20% when Rf
changes from 1.04 to 1.19; whereas in JAEA-B and Toshiba-4, Rf has no impact on critical power.
Exact heater rod configuration cannot be modeled in 1-D analysis, and local flow distribution remains unknown. Hence, a constant Rf is preferred to a geometry dependent radial peaking factor
in M2-CISE4. The value of Rf is set to be 1.1 as suggested by the hot assembly local peaking in an
RBWR (Downar and Kazimi, 2015).
3.2. M2-CISE4 Correlation
The updated M2-CISE4 correlation is presented in Equation (2).
𝑥𝑐𝑟 = ( 𝐷𝑒 𝐷ℎ) 0.8×𝑎×𝐿𝑏 𝑏+𝐿𝑏× 𝑅𝑓 −1 (2) where 𝑎 = [1 + 1.481 × 10⁻⁴(1 − 𝑃 𝑃𝑐) −3 𝐺]−1 if 𝐺 ≤ 𝐺∗, and 𝑎 = (1 − 𝑃 𝑃𝑐) /( 𝐺 1000) 1/3 if 𝐺 > 𝐺∗, with 𝐺∗ = 3375 (1 − 𝑃 𝑃𝑐) 3 ; 𝑏 = 0.279(𝑃𝑐 𝑃 − 1) 0.4𝐺𝐷 𝑒1.4.
𝑥𝑐𝑟 = critical quality; 𝐷𝑒 = hydraulic diameter (m); 𝐷ℎ = heated diameter (m); 𝐿𝑏 = boiling length (m); 𝑃 = exit pressure (MPa); 𝑃𝑐 = critical pressure (MPa); 𝐺 = mass flux (kg/m2-s); 𝑅𝑓 = 1.1 (constant radial peaking factor for tight bundles).
Table V. Parameter ranges for the M2-CISE4 correlation.
Parameter
Tube Annulus Tight Bundle
Low High Low High Low High
Pressure [MPa] 1.0 7.1 4.1 11.0 1.0 9.0
Mass Flux [kg/m2-s] 241 1,980 290 1,980 206 2,489
Hydraulic Diameter [mm] 3.9 7.8 5.0 8.5 2.4 7.0
Heated Diameter [mm] 3.9 7.8 13.3 24.6 3.6 11.0
Hydraulic-to-heated Diameter Ratio 1.00 1.00 0.35 0.38 0.60 0.83
Heated Length [m] 0.86 3.12 1.80 2.70 0.80 1.80
Number of Heater Rods 7; 14; 37
APD uniform uniform; alternate;
outlet peak
uniform; double-humped; stepped-cosine
3.3. Results and Discussion
Figure 18. Predicted/experimental critical power (PECP) mean and SD values for tubes, annuli, and tight bundles with M1-CISE4 and M2-CISE4 correlations.
As can be seen in Figure 18, in average M2-CISE4 outperforms its previous version (M1-CISE4) for the tube and annulus database by 3% and 8% respectively, but remains conservative for both
geometries. On the other hand, M2-CISE4 is still unable to reduce the scatter in tight bundle results due to significant discrepancies between different tests and even within some tests, as recapitulated in Table VI, leading us to go for a parameter effect survey.
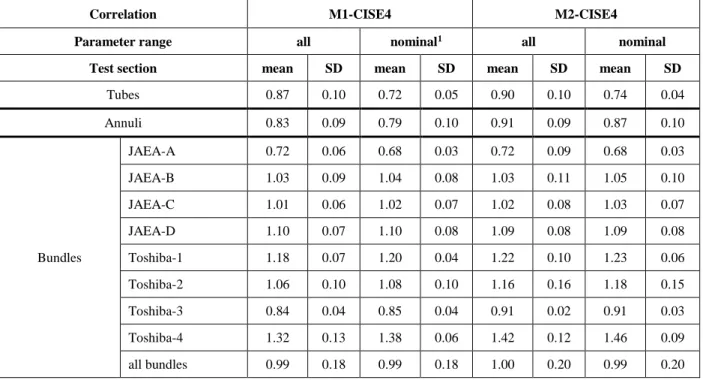
Table VI. PECP mean and SD values for all test sections with M1-CISE4 and M2-CISE4 correlations.
Correlation M1-CISE4 M2-CISE4
Parameter range all nominal1 all nominal
Test section mean SD mean SD mean SD mean SD
Tubes 0.87 0.10 0.72 0.05 0.90 0.10 0.74 0.04 Annuli 0.83 0.09 0.79 0.10 0.91 0.09 0.87 0.10 Bundles JAEA-A 0.72 0.06 0.68 0.03 0.72 0.09 0.68 0.03 JAEA-B 1.03 0.09 1.04 0.08 1.03 0.11 1.05 0.10 JAEA-C 1.01 0.06 1.02 0.07 1.02 0.08 1.03 0.07 JAEA-D 1.10 0.07 1.10 0.08 1.09 0.08 1.09 0.08 Toshiba-1 1.18 0.07 1.20 0.04 1.22 0.10 1.23 0.06 Toshiba-2 1.06 0.10 1.08 0.10 1.16 0.16 1.18 0.15 Toshiba-3 0.84 0.04 0.85 0.04 0.91 0.02 0.91 0.03 Toshiba-4 1.32 0.13 1.38 0.06 1.42 0.12 1.46 0.09 all bundles 0.99 0.18 0.99 0.18 1.00 0.20 0.99 0.20
Table VI reveals that the performance of M2-CISE (and M1-CISE) is not markedly altered when we only focus on RBWR representative operating conditions, except for tube cases in which the under-estimation of critical power can reach up to more than 25% at nominal conditions. This under-prediction could result from various reasons including data uncertainties and applicability of bundle formulation for tubes. Interestingly, as shown in Figure 19, the comparison of the tube data at 7 ± 0.5 MPa to the 2006 CHF look-up table (Groeneveld et al., 2007) also resulted in similar under-estimation. The 2006 CHF look-up table consists of a normalized data bank for a vertical 8 mm water-cooled tube, and is widely used for the prediction of tube CHF due to its relatively high accuracy and reliability. It gives rise to an average PECP of 0.96 (SD of 0.08) with our tube database if the entire range of validity is covered (which outperforms M2-CISE), but also
predicts experiments by 20% at 7 ± 0.5 MPa. The prediction of annulus critical power has been improved with M2-CISE4 mainly due to the modification of the scaling factor (i.e. hydraulic-to-heated diameter ratio term) exponent.
Figure 19. Look-up table: tube critical quality results (at 7±0.5 MPa).
Sensitivity analysis will be performed in the following sub-sections to investigate the impact of different parameters on the dryout critical power of tight bundles.
3.3.1. Effect of Pressure
It is generally well established for a traditional BWR fuel bundle that the critical power would increase at low pressure before reaching its peak value between 4 and 6 MPa and then decrease at high pressure. However, this trend is not observed with our tight bundle database in which critical power decreases as pressure becomes higher, as shown in Figure 20. This feature is also confirmed in tubes and annuli. The pressure effect is correctly captured by M2-CISE4, even though the correlation over-estimates Toshiba-4 data.
An RBWR operates under the same pressure as a conventional BWR; that is, around 7.2 MPa.
0.0 0.2 0.4 0.6 0.8 1.0 0.0 0.2 0.4 0.6 0.8 1.0 P re d icte d Crit ica l Qu ali ty
(a) (b)
Figure 20. Pressure effect on tight bundle critical power (M2-CISE4). (a) JAEA-C; (b) Toshiba-4.
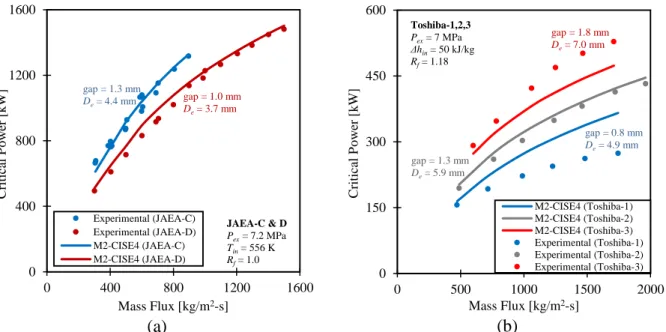
3.3.2. Effect of Mass Flux and Bundle Tightness
The two plots in Figure 21 compare experimental versus predicted (by M2-CISE4) critical power as a function of mass flux. One can conclude that the trend of increasing critical power with increasing mass flux is properly captured by M2-CISE4. Idem for the tightness: a tighter bundle would have a lower critical power. However, for Toshiba-1, 2 & 3 data sets (Figure 21(b)), the magnitude of tightness effect is not as well represented by M2-CISE4 as for JAEA-C & D (Figure 21(a)): the 0.8 mm gap case (Toshiba-1) is over-predicted, and the 1.8 mm gap case (Toshiba-3) is under-predicted. The bundle tightness is directly related to the inter-channel mixing: tighter bundle means smaller rod-rod gap, allowing less coolant mixing among sub-channels. Unfortunately, flow mixing cannot be modeled in 1-D bundle analysis.
In RBWR designs, the AC has a rod-rod gap of 1.3 mm versus 2.2 mm for the TB2. Hydraulic diameter is 4.1 mm (AC) versus 6.1 mm (TB2), and nominal mass flux (average assembly) is 896 kg/m2-s (AC) versus 573 kg/m2-s (TB2). 0 300 600 900 1200 1500 0 2 4 6 8 10 Crit ica l P o w er [k W ] Pressure [MPa] Experimental Predicted (M2-CISE4) JAEA-C G = 600 kg/m2-s ΔTin= 5 K Rf= 1.0 0 200 400 600 800 1000 0 2 4 6 8 10 Crit ica l P o w er [k W ] Pressure [MPa] Experimental Predicted (M2-CISE4) Toshiba-4 G = 800 kg/m2-s Δhin= 50 kJ/kg Rf= 1.15
(a) (b)
Figure 21. Mass flux and tightness effect on tight bundle critical power (M2-CISE4). (a) JAEA-C & D; (b) Toshiba-1,2,3.
3.3.3. Effect of Inlet Condition
As plotted in Figure 22, a higher inlet temperature (or enthalpy) results in a lower critical power. This trend is correctly captured by M2-CISE4.
Figure 22. Inlet temperature effect on tight bundle critical power (M2-CISE4).
An RBWR operates with an inlet enthalpy of 1250 kJ/kg, which corresponds to an inlet temperature of 557.5 K (284.4 °C). 0 400 800 1200 1600 0 400 800 1200 1600 Crit ica l P o w er [k W ] Mass Flux [kg/m2-s] Experimental (JAEA-C) Experimental (JAEA-D) M2-CISE4 (JAEA-C) M2-CISE4 (JAEA-D) JAEA-C & D Pex= 7.2 MPa Tin= 556 K Rf= 1.0 gap = 1.3 mm De= 4.4 mm gap = 1.0 mm De= 3.7 mm 0 150 300 450 600 0 500 1000 1500 2000 Crit ica l P o w er [k W ] Mass Flux [kg/m2-s] M2-CISE4 (Toshiba-1) M2-CISE4 (Toshiba-2) M2-CISE4 (Toshiba-3) Experimental (Toshiba-1) Experimental (Toshiba-2) Experimental (Toshiba-3) Toshiba-1,2,3 Pex= 7 MPa Δhin= 50 kJ/kg Rf= 1.18 gap = 0.8 mm De= 4.9 mm gap = 1.3 mm De= 5.9 mm gap = 1.8 mm De= 7.0 mm 700 900 1100 1300 1500 520 530 540 550 560 570 Crit ica l P o w er [k W ] Inlet Temperature [K] Experimental Predicted (M2-CISE4) JAEA-D Pex= 7.2 MPa G = 1000 kg/m2-s Rf= 1.0
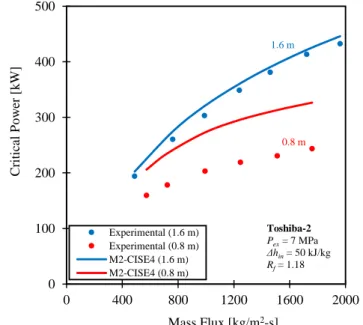
3.3.4. Effect of Heated Length and Axial Peaking Condition
Figure 23 shows the dependence of critical power on heated length and axial power distribution. This plot compares results of Toshiba-2 test section between two different lengths and APD profiles: the stepped-cosine shape and longer bundle (1.6 m) dryout is nicely predicted by M2-CISE4, while the downstream-peaked profile and shorter bundle (0.8 m) dryout is over-estimated by 30%. Theoretically, a longer heated/boiling length yields a higher critical quality/power. The critical quality - boiling length curve reaches a plateau when the channel is long enough (Figure 13.21 in Todreas and Kazimi, 2012) for the annular flow regime to become fully-developed (the droplet deposition rate catches up and is in equilibrium with the entrainment rate). The heated length sensitivity is quite different from what has been observed in tubes (Figure 6(e)) and annuli (Figure 9(f)). This higher sensitivity of critical power in tight bundles may be due to intra-assembly flow mixing, configuration (number and location) of spacer grids, as well as the difference in APD profile. Unfortunately, tight bundle experiments changed more than one parameter1, so their effect on dryout cannot be investigated separately.
Figure 23. Heated length and APD effect on tight bundle critical power (M2-CISE4).
1 In Toshiba-2, both heated length and APD were modified between the 1.6 m case and the 0.8 m case; between
JAEA-A and B tests, not only length and JAEA-APD but also bundle geometry (rod diameter, bundle tightness) and radial power peaking factor changed.
0 100 200 300 400 500 0 400 800 1200 1600 2000 Crit ica l P o w er [k W ] Mass Flux [kg/m2-s] Experimental (1.6 m) Experimental (0.8 m) M2-CISE4 (1.6 m) M2-CISE4 (0.8 m) Toshiba-2 Pex= 7 MPa Δhin= 50 kJ/kg Rf= 1.18 1.6 m 0.8 m
While inter-channel mixing and spacer grid effect cannot be analyzed without sub-channel analysis, it is worthwhile, at the current stage, to investigate more in details the effect of non-uniform APD profiles on critical power.
It is well known that a different APD may change the position of dryout occurrence and could affect the heat removal performance. However, quantifying the effect of non-uniform APD on critical power and including it into simple correlations are much more complicated. As mentioned earlier in section 3.1, the reason why M2-CISE4 does not have a specific term for the APD is because our annuli data displayed no significant impact of non-uniform axial heating on critical power. Moreover, unlike the departure from nucleate boiling (DNB) which is a local phenomenon, the dryout critical power should not be very dependent on local heat flux. The shape of an APD does affect the onset of nucleate boiling (ONB) point and thus the boiling length, which has been accounted for in the CISE4 formulation.
Experiments performed to investigate the non-uniform APD effect initially reported quite inconsistent results: some revealed non dependence of critical power on APD, others showed significant penalty from uniform to cosine shape APD. It turned out later that the confusing conclusions regarding the influence of APD were not due to lab-to-lab uncertainties, but rather other factors. One major factor is that the effect of axial heating condition depends not only on the peaking profile itself, but also on the channel geometry, presence and configuration of spacer grids, and flow conditions. The consensuses from various studies including Adamsson and Anglart (2010), Anglart (2010), Todreas and Rohsenow (1965), and Yang et al. (2006) are: (a) the absence of a strong dependence of dryout on APD: a different APD may change critical power by up to 15% at BWR type conditions; (b) in general, inlet-peak profiles yield the highest level of critical power; outlet-peak profiles yield the lowest; middle-peaked (cosine) profiles behave in between; uniform shape results in higher critical power than cosine and outlet-peak profiles but remains unclear when compared to inlet-peak cases. This partially explains the over-estimation of downstream-peaked (which would lead to the lowest critical power) 0.8 m bundle data by M2-CISE4. The RBWR employs a double-humped shape APD (Figure 4) which is not beneficial to
the critical power. The AC fuel bundle has a heated length of 1.35 m, versus 1.02 m for the shorter TB2.
The JAEA-B test (Liu et al., 2004) reported that under the same operating conditions, the double-humped axial power shape results in much lower critical quality compared to the uniform APD (JAEA-A test) as displayed in Figure 24. Figure 24 also compares predicted critical quality with M2-CISE4 between the two test sections. The difference in predicted results is significant: under-estimation of over 30% for JAEA-A, and slight over-under-estimation for JAEA-B. However, one cannot conclude from the presented results that such difference is due to APD only. In fact, multiple parameters come into play in this comparison: heated length, bundle geometry (hydraulic diameter, tightness), radial peaking, and APD. As discussed in the previous paragraph, the APD effect is supposed to alter critical power/quality by less than 15%. The radial power peaking should have very little impact on JAEA-A and B tests based on analysis in section 3.1. The heated length and bundle tightness effects are directly related to inter-channel mixing phenomenon, which requires sub-channel analysis. Furthermore, Nakatsuka et al. (2003) also reported much higher PECP values for the double-humped JAEA-B test than for the axially uniform JAEA-A test by using the Arai’s correlation developed with axially uniformly heated BAPL data, which are consistent with results using M2-CISE4 (Table VI).
Figure 24. JAEA-A & B experimental vs. predicted (M2-CISE4) critical quality. 0.0 0.1 0.2 0.3 0.4 0.5 0.6 0.7 0.8 0.9 0 300 600 900 1200 1500 Crit ica l Qu ali ty Mass Flux [kg/m2-s] Experimental (JAEA-A) Experimental (JAEA-B) M2-CISE4 (JAEA-A) M2-CISE4 (JAEA-B) JAEA-A & B Pex= 7.2 MPa ΔTin= 5 K JAEA-A gap = 1.0 mm De= 2.35 mm Lh= 1.8 m axially uniform Rf= 1.3 JAEA-B gap = 1.3 mm De= 2.86 mm Lh= 1.26 m axially double-humped Rf= 1.4
3.3.5. Effect of Radial Peaking Condition
The impact of radial peaking factor (Rf) on experimental critical power was discussed in section
3.1. Due to inconsistencies observed among test sections, a constant value of Rf = 1.1 that
corresponds to the RBWR hot bundle local peaking factor was used in M2-CISE4.
However, it is not appropriate to put a power ratio term in a quality formulation, properly speaking. Sub-channel analysis is required to get the local quality distribution inside a bundle and further improve the critical power prediction.
3.3.6. Recommendations
As the parametric studies above reveal, the effect of bundle tightness, heated length, non-uniform APD and radial heating cannot be perfectly captured by M2-CISE4 mainly because of the 1-D approach in which intra-assembly flow mixing is neglected and spacer grid modeling is missing. The sub-channel analysis will be able to take into account these two factors, and also the exact APD profile. Additionally, as introduced in section 1.2, the impact of APD on dryout critical power which may reach up to 15% could be properly represented in the mechanistic approach three-field model, along with other parameter effects.
3.4. Conclusion
The updated dryout critical power correlation, namely M2-CISE4, predicts better but still conservative results for tube and annulus data compared to its previous version (M1-CISE4). The 1-D critical quality - boiling length formulation only depends on bundle-averaged thermal hydraulic parameters and is not able to model inter-channel mixing and spacer grids which both have important consequences on tight bundle critical power. Hence, such parameter effects as bundle tightness, heated length, radial peaking, and APD cannot be entirely captured, and tight bundle dryout prediction with M2-CISE4 still shows significant scatter in PECP results with regard to the whole database.
It is important to mention that all the eight tight bundle dryout tests data have been retrieved from corresponding published papers (original data unavailable, unlike tubes and annuli). This creates an extra source of uncertainty (data extraction) in addition to existing and unavoidable uncertainties with experiments themselves.
In order to further improve the M2-CISE4 correlation, sub-channel analysis is necessary. The next chapter will present the sub-channel code VIPRE-01 and focus on its application for tight bundles. Results of radial quality distribution in VIPRE-01 for each bundle case will be incorporated in M3-CISE (Chapter 5), improved and ultimate version of M3-CISE4 based tight bundle critical power correlation.
Another dryout prediction methodology, the mechanistic approach three-field model, will be investigated and evaluated against experimental data (tubes, annuli, tight bundles) in Chapter 6.
4. Sub-channel Analysis of Tight Bundles
4.1. Objective
The assessment of the M2-CISE4 correlation reveals that a sub-channel level modeling of tight bundles is necessary if further improvement on dryout prediction is desired. A sub-channel code (such as VIPRE-01) is able to introduce higher mechanistic models and provide much more detailed local information (flow, quality, void fraction, temperature, etc.).
The purpose of this chapter is to characterize tight bundle radial quality distribution at the axial location of dryout to be included in our correlation (Chapter 5) via sub-channel analysis with the code VIPRE-01 (MOD-02). Section 4.2 will give a brief presentation of the code and its input layout; in sections 4.3 and 4.4, VIPRE-01 will be benchmarked against the computational fluid dynamics (CFD) code STAR-CCM+ for tight bundles under single-phase flow conditions and against sub-channel level experimental data and simulations in other work for tight bundles under two-phase flow conditions, respectively. The JAEA and Toshiba bundle modeling results will be presented and discussed in section 4.5.
4.2. Code Overview: VIPRE-01
4.2.1. Description
VIPRE-01 (Versatile Internals and Component Program for Reactors; EPRI) is a thermal-hydraulic and safety analysis code. It was developed on the strengths of the COBRA series of codes by Battelle Pacific Northwest Laboratories for the Electric Power Research Institute (EPRI) to help evaluate nuclear reactor core thermal-hydraulic parameters and safety limits including minimum departure from nuclear boiling ratio (MDNBR), critical power ratio (CPR), fuel and clad temperatures, and reactor coolant state in normal and assumed accident conditions.
VIPRE-01 MOD-01 was accepted by the U.S. NRC (Nuclear Regulatory Commission) for PWR licensing applications. VIPRE-01 MOD-02 is an improved and updated version of VIPRE-01 MOD-01, and was developed to address, in particular, issues related to generic BWRs. This up-to-date version has been benchmarked and qualified for both PWR and BWR applications.