HAL Id: hal-01370231
https://hal.archives-ouvertes.fr/hal-01370231v2
Submitted on 15 Nov 2016
HAL is a multi-disciplinary open access
archive for the deposit and dissemination of
sci-entific research documents, whether they are
pub-lished or not. The documents may come from
teaching and research institutions in France or
abroad, or from public or private research centers.
L’archive ouverte pluridisciplinaire HAL, est
destinée au dépôt et à la diffusion de documents
scientifiques de niveau recherche, publiés ou non,
émanant des établissements d’enseignement et de
recherche français ou étrangers, des laboratoires
publics ou privés.
Towards Road Traffic Management with Forecasting on
Wall Displays
Arnaud Prouzeau, Anastasia Bezerianos, Olivier Chapuis
To cite this version:
Arnaud Prouzeau, Anastasia Bezerianos, Olivier Chapuis. Towards Road Traffic Management with
Forecasting on Wall Displays. Proceedings of the 2016 International Conference on Interactive
Sur-faces and Spaces, Nov 2016, Niagara Falls, Canada. pp.119–128, �10.1145/2992154.2992158�.
�hal-01370231v2�
Towards Road Traffic Management with
Forecasting on Wall Displays
Arnaud Prouzeau
Anastasia Bezerianos
Olivier Chapuis
LRI, Univ Paris-Sud, CNRS, Inria, Universit´e Paris-Saclay
F-91405 Orsay, France
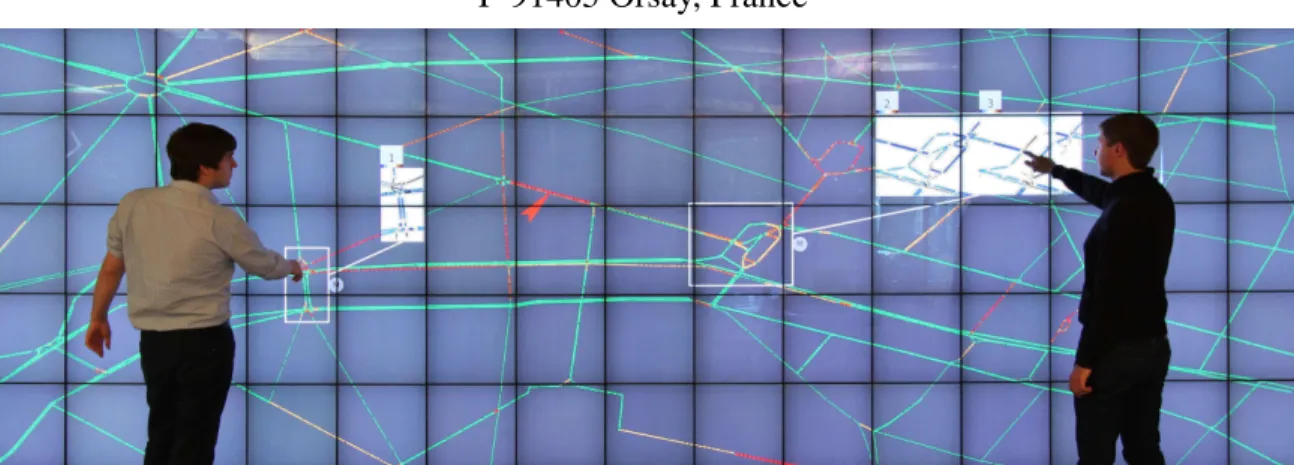
Figure 1. Visualization of traffic in a city with two “DragMagics” (white rectangles) showing one (left) and two (right) simulations associated with different possible interventions on the traffic. The simulation visualizations use difference color maps to highlight differences with the real traffic.
ABSTRACT
Road traffic control centers are of vital importance to modern cities. Interviews with controllers in two such centers identi-fied the need to incorporate the visualization of results from predictive traffic models with real traffic, to help operators choose among different interventions on the network. We ex-plore this idea in a prototype that runs on a wall display, and supports direct touch and input from workstations and mobile devices. Apart from basic functionality to manage the current traffic such as changing traffic light duration or speed limits, the prototype incorporates traffic simulations for forecasting results of possible actions, highlighting their differences to current traffic. Based on needs identified in our interviews, we offer two techniques that visually combine simulated and real situations, taking advantage of the large display space: multiple independent views and DragMagic, a variation of magic lenses. A preliminary laboratory experiment suggests that both techniques are viable design options, even for mon-itoring several simulations and areas of interest, contrary to expectations from previous work. However DragMagics are easier to master. An informal feedback session with our ex-perts showed promising early feedback.
Author Keywords
Traffic monitoring; wall display; road traffic model; traffic forecast; DragMag; magic lens
Arnaud Prouzeau, Anastasia Bezerianos & Olivier Chapuis. Towards Road Traffic Management with Forecasting on Wall Displays, In ISS ’16: Proceedings of the 2016 International Conference on Interactive Surfaces and Spaces, 119–128, ACM, November 2016.
©ACM, 2016. This is the author’s version of the work. It is posted here by permission of ACM for your personal use. Not for redistribution. The definitive version is published in ISS 2016, November 6–9, 2016, Niagara Falls, ON, Canada. 10.1145/2992154.2992158
ACM Classification Keywords
H.5.2 Information interfaces and presentation (e.g., HCI): User Interfaces – Graphical user interfaces.
INTRODUCTION
Traffic congestion in major cities and highways is a growing problem in most countries. Perturbations such as accidents and breakdowns, or exceptional events such as demonstra-tions, can overload a road network that may already be oper-ating at its limit, e.g. during rush hour. To prevent and to react efficiently to incidents and perturbations, road traffic in cities and highways is monitored in dedicated control centers. Even for experienced operators, it is often challenging to eval-uate the impact of an intervention on the network. While they are equipped with predefined traffic plans (sets of compatible interventions on a sector or area), it is still sometimes unclear which plan will work best for the current state of the network, in particular during exceptional events. This is where simu-lation models of road-traffic can help operators better under-stand and chose among possible intervention alternatives. Road-traffic is a complex system with multiple agents (cars) that can behave in a non-deterministic manner. Researchers approximate road-traffic using methods from physics [16] or statistics and machine learning [43]. Their simulations can perform short-term traffic forecasting, identify problematic sectors with high-risk of traffic-congestion, and test new con-cepts to improve road-traffic such as dynamic adjustment of speed limits. Nevertheless, there is little work that looks at incorporating these results visually in traffic control centers. Following interviews and observations of road-traffic control centers, we extracted user needs and designed a prototype system for road-traffic monitoring that runs on a touch
en-abled ultra high-resolution wall display1. Taking advantage
of their high resolution and large real-estate, our prototype extends the visualizations currently used in road-traffic con-trol centers, to allow operators to concurrently explore and visualize results from multiple simulations testing alternative interventions on the network, both in a local and global scale. We propose two techniques for viewing multiple simulations in combination with real traffic: (i) multiple views [21, 41, 45] to show the global state of the network; and (ii) DragMagic, a combination of DragMags [46] and magic lenses [8], to vi-sualize localized sectors (Figure 1). We adapt and combine these techniques to visualize and compare several forecast vi-sualizations using wall displays in control centers.
To better understand the performance of these techniques in our context, we compared them in a lab experiment. Partici-pants performed well in comparison tasks of up to 6 different simulations, contrary to previous findings [30] that predicted decreased performance with the increase of comparisons. Our results also suggest that DragMagic is easier to master and may be beneficial when the number of simulations to com-pare is high, but that both techniques are viable alternatives. Early feedback on our prototype from experts also indicates a preference for DragMagic.
Our contributions are: (i) The user-centered design motivat-ing a wall display prototype, buildmotivat-ing on interviews and ob-servations of expert users, and the needs derived from them. (ii) Combining interaction and visualization techniques to present multiple simulated and real situations in the context of traffic management, something not seen in previous work. (iii) The first controlled study to evaluate these visualization techniques using an adapted situation-awareness task.
BACKGROUND
We discuss wall displays and Multi-Display Environments (MDE) for control rooms, and road traffic visualization.
Wall Displays & MDE for Control Rooms
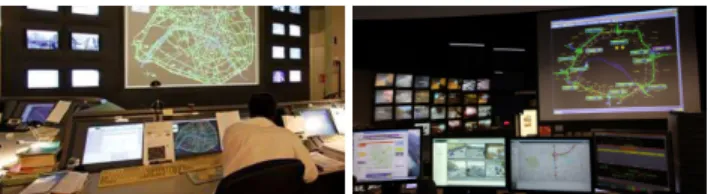
Control rooms are used to monitor complex systems like tele-scopes [28], power plants [26] or transportation networks [39]. They are usually equipped with a large display show-ing an overview of the situation and general information for all operators, and with individual workstations where opera-tors act on the system (Figure 2).
Designers of such systems have recognized early on the im-portance of human factors and interaction in their work, and in particular the benefit of visualization walls and other shared displays. For instance, Smith et al. [38] study the con-trol room of the London subway and highlight that a shared visualization can improve group awareness and communica-tion in the team. And later, Starke et al. [39] studied how op-erators gathered and integrated information across displays in a simulated ”object in the road” scenario.
Shared displays in control rooms are often treated as large monitors, and interaction is done using mice and keyboards.
1 an earlier version of the prototype alone has been presented in
French as a Work in Progress (poster presentation) [31].
More recent work has focused on direct interaction with tabletops in crisis management [32, 13]. Others have com-bined tabletops and tangible tools in power plant control cen-ters [26], and tabletops and paper in air-traffic control [17]. Finally, recent work combined tabletops with shared vertical screens present in most control centers. For example, Bader et al. [5] combine a digital table map, a vertical screen with additional information, and a tablet to overlay personal infor-mation on the map. And Chokshi et al. [11] use tabletops to perform actions collaboratively on a central wall display. In the above work, operators interact with the wall display indirectly, through mice/keyboards or tabletops. In few ap-proaches, such as ours, interaction takes place directly on the wall displays. For example, in a scenario of police officers monitoring cars on a wall display, Ion et al. [19] use Drag-Mags to focus on an area, with cut-offs of interesting items outside it connected with a folded strip. Our approach differs from previous work in control rooms. Beyond directly inter-acting with the wall display [19], we further propose using the wall display as a central interactive surface where operators can solve problems, not just monitor situations.
Irrespective of interaction platform, this previous work often relies on general purpose interaction and visualization tech-niques related to focusing and monitoring one or more areas of interest, such as space folding [14], magic lenses [8], Drag-Mags [46] and multi-focus techniques [22, 25]. This is due to the need in such contexts to monitor several specific areas in detail, while still having an overview of the situation. For example Ion et al. [19] use DragMags with attached cut-offs; Schwarz et al. [37] use local semantic magnification with a Manhattan lens or a deported view on the wall, and multiple space-folds to visualize multiple areas with context-sensitive information at higher resolution [9, 37].
Our work poses visualization challenges that go beyond those seen in previous work, as it not only needs to allow operators to monitor multiple areas of interest simultaneously, but it also combines real data with simulation and forecasting visu-alizations. Thus the progress and results of one or even more simulations need to be viewed and understood concurrently with the actual road traffic data on multiple areas of interest.
Road Traffic Visualization
Trajectory visualization [2] focuses often on vessel traffic, marine [23, 34, 36] and air [18, 35], and on an a-posteriori analysis of movement patterns over long time periods, using sophisticated interaction and visualization mechanisms such as aggregating paths, brushing and linking views, advanced statistics on selections, etc.
Similarly, most work on road traffic focuses on a-posteriori analysis and visualization of traffic patterns. For example, Andrienko et al. [1] extract and visualize meaningful places within movement data, and cluster spatio-temporal events or trajectories. Tominski et al. [40] visualize trajectories at dif-ferent points in time, by stacking them on the 3rd dimension. For real time traffic data visualizations, Wang et al. [44] visu-alize macro-traffic data recorded by transportation cells, us-ing a combination of aggregated trajectories and of
individ-Figure 2. PC Lut`ece and PC Berlier traffic control centers in Paris.
ual views for each cell showing vehicle animations. Never-theless, the majority of modern traffic control centers, and studies conducted around them (see previous section), visual-ize real traffic data by coloring road segments based on traf-fic density or average vehicle speed, similarly to tools like Google Maps, Bing Maps, etc. As we saw, this visualization is often coupled with techniques that aid monitoring of dif-ferent locations on wall displays, most notably variations of Magic lenses [8] and DragMags [30, 46].
We also use visualization lenses, but for a different purpose. As our goal is to augment real time traffic with results of sim-ulations, lenses are used to provide side-by-side comparisons between the current situation and simulations in an area of interest. As an alternative to lenses, we also provide multiple juxtaposed views of the entire network [21, 41, 45], with real or simulated data. Another approach taken by Andrienko et al. [3] superimposed on a map the simulated results of road traffic bands in a time cube. Nevertheless, they focused on the simulation visualization and did not combine this visual-ization with real-time traffic. More recently, they presented a complete framework [4] to analyze road traffic, and model how additional cars will influence the network. To compare the impact of different possible interventions, they visualize results using difference maps, time cubes and statistics. Our work is orthogonal, as we focus on the user-centered design of a system to be incorporated in the shared wall of a control center, using visualizations to monitor multiple simulations and points of interest at a given time.
OBSERVATIONS AND INTERVIEWS
To understand the tasks, tools and needs of traffic operators, we visited two control centers: PC Lut`ece that handles traffic for the city of Paris (Figure 2 left), and PC Berlier (Figure 2 right) that monitors the P´eriph´erique, a motorway surround-ing Paris. We observed two operators in PC Lut`ece and in-terviewed one in depth (1h) as well as an operations engineer (1h); and we observed another two operators in PC Berlier and interviewed one (1/2h) and the operator supervisor (1h).
General Observations. Both control centers are furnished with a large shared visualization wall showing the mon-itored network, surrounded by smaller screens with live camera feeds from the streets in PC Lut`ece, and from the P´eriph´erique and its tunnels in PC Berlier. Road segments are colored depending on traffic congestion from green (no con-gestion), to yellow, orange, and red (high congestion). Gray is used to indicate segments with faulty loop detectors. Arrows are used to highlight areas in which an intervention was done, either by the system (green arrow) or by an operator (yellow arrow if the system agrees with the intervention and red if it disagrees). Individual operator workstations are located in
front of the wall, also displaying the network visualization (see Figure 2), alerts and other statistical information. Due to the small scale and resolution of their monitors (w.r.t. the scale of the monitored network), operators tend to focus on localized areas of the network in their workstations, using mouse and keyboard to navigate. While they look at their in-dividual workstations more, they all use the wall as an aware-ness monitor to acquire the “big picture” of the network state.
PC Lut `ece. An automated system (SURF3) manages the traffic lights for approximately 1500 Parisian intersections, with more than 800.000 cars and 2.5 million pedestrian move-ments daily. It includes a library of ”Traffic Light Plans” (a collection of consistent traffic light durations), and automati-cally choses the most appropriate plan, depending on the cur-rent traffic situation, the day of the week and the time of day. Under normal conditions (outside special events) the priority is public transport and pedestrian flow.
Operators can switch plans for specific sectors, or change traffic light duration of individual intersections for specific events or when incidents occur. Our interviewees explained that operators have a lot of experience in handling incidents in the city and can very accurately predict the impact of their actions and interventions in a local scale, such as a crossroad. Nevertheless, they explained it is difficult to access the impact of actions at a more global scale, e.g., it is often unclear how a change in a crossroad will impact other connected crossroads in the local sector or even the entire network.
PC Berlier. The center manages the traffic flow in the P´eriph´erique motorway (IPER-REPER system), that hosts daily approximately 1.2 million car movements of commuters between Paris and its suburbs (60% of traffic in the region, 2002). Operators have to constantly monitor traffic in the motorway and its tunnels in order to spot incidents and con-gestions. To optimize traffic flow, they can activate/deactivate lanes and reroute drivers using variable message signs, in par-ticular since they face almost daily maintenance of lanes that requires reflow of traffic. To ensure safety in tunnels, opera-tors can trigger and follow emergency plans, including evacu-ation, activation of smoke control systems, or closing tunnels in coordination with firefighter forces on the ground. Our interviewees explained that a rerouting plan is in place for closing off sections of the motorway or tunnels. But they are hard pressed to apply it as it is difficult to assess the im-pact of such a drastic measure in each traffic situation. They described an incident with a tunnel flooded in both directions for 11 hours, where they considered applying this plan but could not risk it without a clear picture of potential global effects on the rest of the network.
The operator supervisor organizes shifts, oversees the good operation of the center and is involved in training new opera-tors. She added that face the challenge of boredom: monitor-ing traffic feeds and messages from the public to detect inci-dents early is monotonous and operator attention can wander, and she felt that occasional task switching, such as forecast planning, could increase operator interest and focus.
Other Control Centers. Road-traffic control centers around the world use different technologies and methods. In Paris, the traffic light control cycle is controlled by timing plans, while dynamic modification of the green light duration is not allowed. Other centers, like in London (SCOOT system2)
allow such modifications. Interestingly, some centers started using predictive modeling to assess the impact of incidents and to help decision-making, such as in the Piemont Control Center in Italy (PTV Optima3 software). However, to our knowledge no control center combines forecasting and real-time traffic visualizations.
Motivation and User Needs. Our interviews and knowledge of existing centers suggest that: (i) It would be beneficial to incorporate visualization of predictive models with real-time monitoring tools, as the impact of actions is often hard to pre-dict. (ii) Operators should be provided with likely outcomes of their interventions both globally on the entire network, and locallyon specific sectors or intersections. (iii) Forecast visu-alizations increase the amount of information to be displayed, but are needed periodically, not on a constant basis. Given the advances in wall displays, i.e., their interactive support and their ability to display a large amount of information, wall displays can be a good platform for the next generation of road traffic systems, going beyond awareness monitors to also incorporate forecast analysis and visualization when needed. Current control center setups also suffer from divided atten-tion issues [37], with operators monitoring live camera feeds, the entire network on the visualization wall, and interacting through their individual workstations. If we consider addi-tionaly visually displaying the results of predictive models, the already challenging task of monitoring real-time traffic can become increasingly difficult. As such, for our prototype we decided to show the visualization of the prediction mod-els on the main visualization, and test the limits of how many such prediction models users can comfortably monitor.
PROTOTYPE
In order to explore solutions for integrating the results of forecasting models to real-time traffic monitoring, we im-plemented a set of visualizations and interaction techniques within a functional prototype. The prototype is developed using Java and the ZVTM Cluster library [29] that allows it to run simultaneously on desktops and on a wall driven by a computer cluster. Several desktop computers can share the view seen on the wall, but at different scales, as is currently done in control centers. On desktops, operators interact with mice and keyboard and their actions are mirrored on the wall. On the wall we support two types of inputs: direct touch, and indirect touch using mobiles and tablets via the Smar-ties toolkit [10]. This dual input enables implicit zooming and context switching through movement [6, 7], leverages the benefits of wall displays in high information density tasks [24], and provides new opportunities for collaborative data analysis [20]. Such interaction requires physical navigation
2
http://www.scoot-utc.com/ 3 http://vision-traffic.ptvgroup.com
Figure 3. View of ”Place de la Concorde” in Paris on our prototype.
[6], that could fatigue operators working long hours. We in-stead envision they’ll be used occasionally: operators gener-ally sit in front of their workstation, but when they address critical incidents or conduct planning sessions, they get up and interact with the wall. Focusing on a single shared screen could better support group work and awareness [15], and re-duce the visual attention switch that occurs in MDE [33].
Traffic data and modeling
In our prototype, we represent each road network as a directed graph, with roads as links and intersections as nodes. The to-pography of existing road networks is extracted from Open-StreetMap data, or can be generated artificially (randomly) given a number of intersections and a desired road density. Our system can process and display real-time streaming traffic-density data (e.g. data from the SURF3 system). To predict the evolution of current traffic, or of possible oper-ator interventions, our prototype also models traffic. Roads are assigned speed limits, and intersection traffic-lights are assigned a duration. The duration of multiple lights (e.g. on a single road) can be synchronized as a group.
The current forecasting model is an extension of the Nagel and Schreckenberg one [27] developed by Chrobrok et al. [12]. It is based on cellular automata, and can model road networks with several lanes. At each intersection cars have a predefined probability of taking one of the available roads; this probability is calculated using real data, or the network topology favoring multi-lane roads.
A given state of the network can be cloned and used to run a forecasting model (accelerated) to (i) see a likely outcome of the current traffic, or (ii) see and compare the impact of possible interventions that adjust different parameters of the network (e.g. speed limit, lane closing, traffic light duration). Our model is only a simplification of real road traffic, and more complex models have been developed in the field of traffic prediction using real-time data (e.g [4]). Nevertheless, our goal is not to develop a more accurate model, but rather to focus on the design of interaction and visualization tech-niques that can combine real time data and data from (multi-ple) forecasting simulations. Thus the traffic model is a plug-in plug-in our prototype, so as to be able to plug-incorporate and test different models in the future.
Figure 4. Context aware tool-palettes for modifying road (left) and in-tersection settings (right).
Real Traffic, Visualization & Interaction
To visualize real-time data, we follow the conventions used in traffic control that operators are familiar with. Traffic den-sity is represented by a progressive color scale: green (fluid), yellow, orange and red (saturated). Depending on data avail-ability, individual cars can also be displayed as circles with a line representing their direction and speed vector (Figure 3). Operators can invoke context-aware tool palettes (left click for mouse, long tap for touch) to manage roads or intersec-tions. For a road they can alter the speed limit, open or close individual (or all) lanes, and report accidents (Figure 4-left). For an intersection, they can act on light duration: change the proportion of red/green light time, change the cycle du-ration, or change the current timing plan with another (Fig-ure 4-right). These changes can either be applied immedi-ately to the traffic, or clone the traffic and create a forecast visualization (discussed next).
Operator interventions on real traffic are reported on the map with arrows. By selecting an intervention arrow they can undo the action, or ”lock” it so that it cannot be undone, sup-pressing the marker.
Forecasts, Visualization & Interaction
We are interested in combining real traffic visualization, with likely forecasts of the potential future of this traffic, or of the impact of an intervention (e.g., closing a lane or changing light duration), calculated by traffic models. When opera-tors invoke the tool palette to intervene on real traffic, instead of applying their changes, they can choose to instead start a forecast simulation. This clones the state of the real traffic and models the possible outcome of applying the changes, or the predicted outcome of the current situation sped-up. Operators can intervene further on a forecast visualization, by changing road or intersection settings in the same way they do in the real-time visualization. They can choose to apply their changes to this particular forecast visualization, to the real traffic, or even clone the forecast simulation and apply the changes to the clone. Thus, they can generate multiple branching alternative simulations if desired.
As operators often want to compare the result of forecasts to the baseline traffic to see if there is an improvement, we use difference maps (as Lampe et al. [23]): colors do not indicate an absolute measure (e.g. density), but rather a positive or negative distance from a baseline situation (real traffic). The selection of an appropriate color map is important to highlight differences [42]. We use a diverging color scheme, adapted
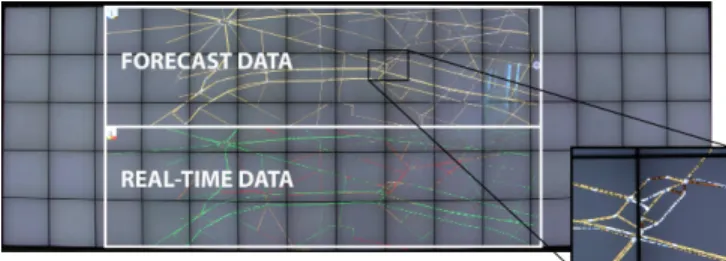
Figure 5. Global visualization of real traffic (bottom) and forecast (top) using MultiViews. A difference color map is used in forecast (cutout).
to be clearly visible on a wall (Figure 5 top & Figure 6 Drag-Magic views). Three blue hues indicate improvement, three brown deterioration, and white color indicates a similar traffic density. These 7 colors represent all the possible amplitudes of the difference between real traffic and forecasts.
Based on our interviews, operators need to see two types of forecast results: Global, that show the forecast for the en-tire network; or Local, that are focused on a few neighboring roads and intersections, that we call an ”area of interest”.
Global (MultiViews). When operators are interested in fore-cast visualizations focusing on global outcomes, they can cre-ate a new view of the entire network for each simulation, fol-lowing the idea of small multiples [21]. One view always represents the real time traffic, while the others are forecasts calculated by the predictive model (Figure 5).
Apart from using the tool palette, operators can also create new global forecast visualizations by tracing a vertical line inside a simulation to ”split” its view, and create a perfect clone of it. Simulations are laid out on the wall using a grid optimization algorithm.
On the top left corner, global forecast visualizations have a unique identification number based on the order in which they were spawned, and a legend explaining the color range used in the view. They also have a button for invoking a tool palette, through which operators can change simulation set-tings, such as setting the prediction time frame with a slider from 0 to 30 minutes (a time duration considered to provide reliable results for our forecasting algorithm).
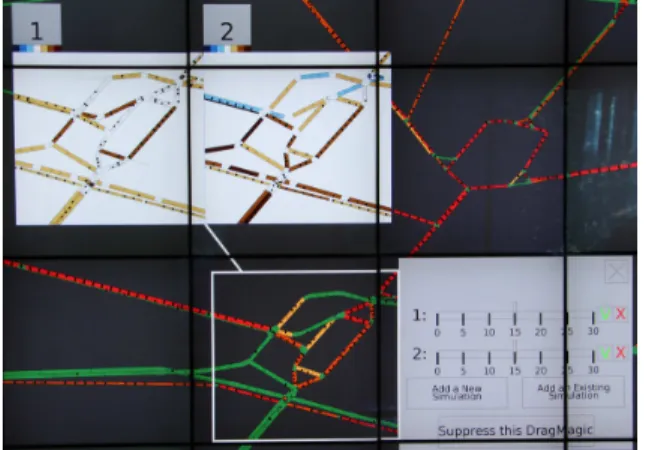
Local (DragMagic). When operators want to focus on par-ticular areas of interest, they can invoke a variation of magic lenses [8, 25] that displays the forecast only for that area. This local view is placed at an offset position to avoid obscuring the real traffic at this area. A DragMagic can also be created by tracing a corner shaped gesture to define the area to be cloned in the DragMagic. As with a DragMag [46], the fore-cast visualization can be dragged, and is linked visually to the area of interest that is itself highlighted. Several forecast visualizations of different intervention simulations, focusing on the same area of interest, can be displayed side-by-side to show the possible outcomes (Figure 6).
Similarly to the global forecast visualization, DragMagics have a number identifying the simulation they are displaying, and a button to invoke the settings palette (Figure 6). This can be useful if operators want to monitor the results of a single simulation on more than one area of interest. It can be used
Figure 6. A DragMagic with two forecast visualizations (top left) linked to its area of focus (inside white rectangle), and its menu open (right).
for example to aid operators visualize the impact of an ac-tion on critical areas not directly linked to the locaac-tion of the action, that may be far away. Such areas include vital path-ways for access to hospitals, sensitive locations such as long tunnels, or central traffic hubs.
MULTIPLE VIEWS VS. DRAGMAGIC
An important and novel functionality of our prototype is the visualization of forecasts in combination with real traffic, us-ing MultiViews to provide a global view of the models’ pre-diction for the entire network, and DragMagic to visualize locally the predictions for specific areas.
MultiViewsare well adapted for situations where operators need to see the impact for the entire network, as they show global forecasts. When they are interested in a single small area of the network, DragMagics are better for showing local effects. However, the situation is more complex when opera-tors need to consider several areas of interest (critical areas) on the network. Due to the higher number and sparsity of areas of interest, this task is neither clearly local nor global, and thus it is unclear which technique fares best. DragMagic likely works well for few areas of interest, but as their number increases they approximate the entire network, and as such MultiViewsmay be better. Moreover, it is unclear how hard it is to follow multiple simulations running at the same time in order to decide between alternatives, using either technique. We thus designed an experiment to compare viewers’ perfor-mance using DragMagic and MultiViews for this intermediate case, varying the number of simulations and areas of interest. Our factors are: two techniques TECH, DragMagic and Mul-tiViews; number of simulations #SIMU, with 3 values {2, 4, 6} (to simplify, we consider real-time traffic as a simulation); and number of areas of interest #AOI, with 3 values {3, 5, 7}. In a trial, we showed participants several traffic simulations, where one (”simulation 0”) is considered the reality and is coded with the classic red to green color coding. The rest use difference maps with simulation 0 (see Prototype). In Multi-Views, on each simulation the areas of interest are highlighted using white rectangles. In DragMagic only simulation 0 is shown fully, and a DragMagic per area of interest is used to display the remaining simulations. For consistency, in the
ex-periment all areas of interest contained exactly two roads, and simulations were updated every 10 seconds.
The layout of MultiViews was such that simulations had the same size, and were as big as possible while fitting on the wall. DragMagics were positioned such that they were as close as possible of their area of interest, while not overlap-ping with other areas of interest or DragMagic.
In each trial, participants were asked four questions, sepa-rated by intervals of about 30 sec. Two questions were on the present state of the areas of interest, and two on their past history (inspired by tests accessing situation awareness that alternate and repeat questions on present and past, as in [19]): Qpres “At the present moment, which simulation is the best for
the areas of interest?”. Asked 1st and 3rd.
Qhist “From the beginning of this trial, which simulation was the
best for the areas of interest?”. Asked 2nd and 4th. When it was time for a question, an alarm rung, the simu-lations paused, and the question was displayed at the top of the wall. Participants gave their answer (the simulation num-ber) using a smartphone. They were instructed to be as fast as possible while minimizing errors. We explicitly told par-ticipants not to perform a detailed comparison, but to give us their overall impression, especially for Qpreswhere a detailed
comparison is tedious but possible. Trials lasted 2 minutes plus the time taken by participants to answer the questions. Our first working hypothesis is that:
H1 DragMagic will perform better than MultiViews, as viewers have to monitor a smaller area.
Following Plumlee and Ware [30] that link performance with the number of visual comparisons in a task, it is reasonable to hypothesize that increasing the number of simulations #SIMU
and areas of interest #AOI will decrease performance overall. However, our experiment was not designed to evaluate the effects of #SIMUand #AOI, but rather to evaluate a possi-ble interaction of TECH with #SIMUand #AOI. According to Plumlee and Ware [30] distance between comparisons can also deteriorate performance:
H2 DragMagic will perform better with a larger number of simulations #SIMUas the distance of the areas being com-pared is reduced; while MultiViews will perform better with more areas of interest #AOI, as its global view will be a good approximation of all the #AOI’s.
Experimental Design
Participants. Sixteen volunteers took part in the experiment (8 female, 8 male), aged 23 to 32, with normal or corrected-to-normal vision. As participants needed to tell the difference between several shades of the same color, they took the Ishi-hara Color Blindness test before the experiment to ensure they did not suffer from color-blindness. As our experiment is per-ceptual in nature (tracking of color changes over time) with no domain knowledge requirements, we believe that design-ing with experts and experimentdesign-ing initially with non-experts is valid for measuring perceptual situation awareness (simi-larly to previous work, e.g., [19]).
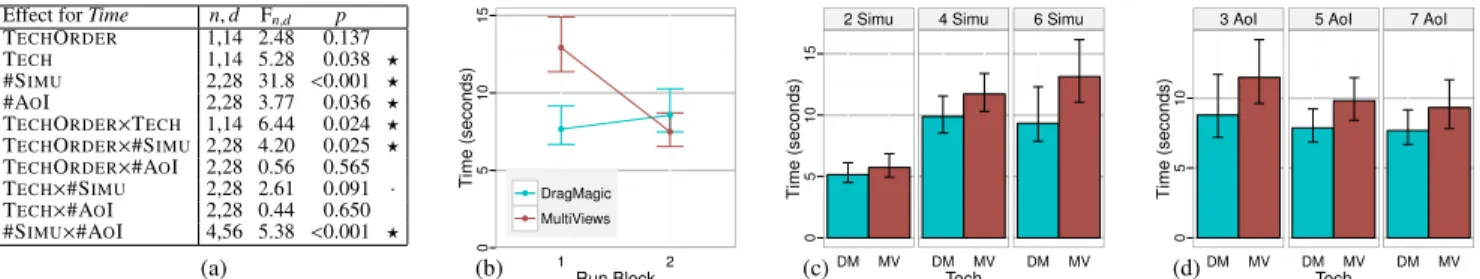
Effect for Time n, d Fn,d p
TECHORDER 1,14 2.48 0.137 TECH 1,14 5.28 0.038 ⋆ #SIMU 2,28 31.8 <0.001 ⋆ #AOI 2,28 3.77 0.036 ⋆ TECHORDER×TECH 1,14 6.44 0.024 ⋆ TECHORDER×#SIMU 2,28 4.20 0.025 ⋆ TECHORDER×#AOI 2,28 0.56 0.565 TECH×#SIMU 2,28 2.61 0.091 · TECH×#AOI 2,28 0.44 0.650 #SIMU×#AOI 4,56 5.38 <0.001 ⋆ ● ● ● ● 0 5 10 15 1 2 Run Block Time (seconds) ● ● DragMagic MultiViews
2 Simu 4 Simu 6 Simu
0 5 10 15 DM MV DM MV DM MV Tech Time (seconds)
3 AoI 5 AoI 7 AoI
0 5 10 DM MV DM MV DM MV Tech Time (seconds) (a) (b) (c) (d)
Figure 7. Time to answer for question Qpres: (a) Results of the degree 2ANOVAin the mixed model TECHORDER ×TECH×#SIMU×#AOI × Rand(PARTICIPANT) (there is no significant interaction of degree > 2, all p’s > 0.4); statistically significant results (p < .05) are starred, whereas a dot marks statistical trends (p < .1). (b) Time by TECHdepending on whether a technique was run in the 1stblock or in the 2ndone. (c) Time for each
TECHby #SIMU. (d) Time for each TECHby #AOI. In (c) and (d), DM stands for DragMagic and MV for MultiViews.
Apparatus. We used an interactive wall (5.9m × 1.96m wide, with a resolution of 14 400 × 4800 pixels), made of 75 LCD displays (21.6 inches, 3mm bezels each), seen in Figure 1. The wall was driven by a rendering cluster of 10 computers. The experimental software, built on our prototype, ran on a master machine connected to the cluster through 1Gbit Eth-ernet. Participants answered questions using a smartphone.
Procedure and Design. The experiment is a [2×3×3] within-participants design with factors TECH(MultiViews and Drag-Magic), #SIMU (2, 4 and 6) and #AOI (3, 5 and 7). We blocked by TECH and the order was counter-balanced be-tween participants: half started with DragMagic and half with MultiViews. For each TECH, a first trial was used to explain the task, questions and the visualization (e.g., color code, ar-eas of interest, simulation). Then participants conducted 3 training trials before proceeding to the 9 (=3×3) measured tri-als. For these 9 trials, the #SIMUincreased gradually (first 2, then 4 and 6). And for each simulation number condition, the #AOI also increases gradually (3, then 5 and 7). We started
with the a-priori easier tasks to try to reduce learning effects. The network used are the main roads in Paris city center. Us-ing our prototype we built 13 sets of simulations (4 for the training and 9 for the measured trials), by generating a large number of 2 min simulations and selecting ones with a similar number of color changes (about 1000 per simulation). Real traffic (sim 0) was also generated this way for consistency. To ensure a fair comparison across techniques, we took the orig-inal simulation sets, and built another 13 ones by changing the simulations order. TECHpresentation order was counter-balanced consistently with the sets.
Sessions lasted 1 hour, and at the end participants completed a questionnaire on strategy, workload (customized NASA TLX questionnaire) and preference.
Measures. We recorded the time to answer the questions Time, and participants’ answers. Time is important in a con-trol room context, as operators need to evaluate situations and act quickly. In our experiment, slower answer times can in-dicate that in some conditions assessing a situation is harder and requires more reflection. When two or more simulations are displayed, a given imperfect answer could be better than another, as simulations have an order when it comes to im-provement over the real situation. Thus, we define NError as: (R − 1)/(#S imu − 1) where R is the rank of the
simula-tion when ordered from best to worst. Using #SIMUensures we normalize the error per number of simulations. We also report on absolute number of errors per condition (Err).
Results
We first look at the results for Qpres, the results for Qhistare
similar and discussed next. We noticed that the presentation order of TECHhas an impact on the results, thus we report on the between-subject factor TECHORDER. Error bars in our images represent 95% CI computed with all the data points using BCa bootstrapping. For post-hoc tests we use paired t-test with Holm correction.
Time
Figure 7-a shows the detailed ANOVAfor Time. TECH has a significant effect on Time (DragMagic being faster), but we also have a significant TECH×TECHORDERinteraction. A post-hoc test shows that DragMagic is significantly faster than MultiViews (p = 0.007, a speed-up of 33%) for
partici-pants starting with MultiViews, but not for participartici-pants start-ing with DragMagic (p = 0.753, almost the same mean Time). See Figure 7-b. Thus, H1 is only satisfied when participants are mastering the techniques and task.
Note that the Time for DragMagic for both TECHORDERs, and for MultiViews when seen second are very similar, and all three significantly faster than MultiViews when seen first (p’s < 0.009). We see a positive learning transfer from Drag-Magicto MultiViews, while the time for DragMagic is similar irrespective of order indicating it is easier to master.
There is a significant effect of #SIMUand #AOI on Time, with significant interactions TECHORDER×#SIMUand #SIMU× #AOI, but no significant interaction with TECH (next para-graph). Post-hoc tests show that participants were overall faster with 2 simulations than with 4 and 6 (p’s < 0.001, no sig-nificant difference between 4 and 6 simulations,p = 0.648; see
Figure 7-c). When starting with MultiViews this difference between 2 simulations and 4 or 6 simulations are bigger than when starting with DragMagic (the TECHORDER×#SIMU
interaction). Surprisingly, when it comes to #AOI, partici-pants were overall significantly slower with 3 AoIs than with 7 AoIs (p = 0.025; no other significant difference between the AoIs; see Figure 7-d). This difference is mainly caused by the case of 6 simulations (the #SIMU×#AOI interaction) and suggests that participants were able to use the time in between questions to select and focus on a few promising simulations, reducing the number of comparisons at answer time.
The TECH×#SIMUinteraction is not significant (p = 0.091). However, the difference between the better performance of DragMagicover MultiViews grows with #SIMUand becomes significant with 6 simulations: 5.1s vs. 5.7sfor 2 simulations (p = 0.466),9.9s vs. 11.7sfor 4 (p = 0.146), and9.3s vs. 13.1sfor 6 simulations (p = 0.038). Thus, the first part of H2 is partially
confirmed. Results do not confirm the second part of H2, as there is no effect of #AOI on TECH.
Normilized Errors
Regarding normalized errors, the only significant result is an effect of #SIMU(F2,28 = 7.48, p = 0.002). Participants made
significantly more errors with 4 simulations (on average0.13) than with 2 simulations (on average0.06,p = 0.02. And trend for more errors with 4 simulations than with 6 simulations (average of0.08,p = 0.065). We note that statistical trends with absolute number of errors are similar, with the additional dif-ference between 2 and 6 simulations (p < .001). Mean absolute error was0.06, 0.27, 0.20for 2,4, and 6 simulations respectively. An important remark is that DragMagic and MultiViews ex-hibit very similar average normalized error, overall (0.087vs.
0.086), and also depending on whether they are seen first or second (0.106 vs. 0.097for block one and 0.068vs. 0.076for block two). The same holds for absolute error (0.18vs.0.185).
Thus, the above results on Time cannot be attributed to a speed-accuracy trade-off.
The QhistQuestion vs. the QpresQuestion
Result trends for Qhistare very similar to Qpres, we thus omit
a detailed presentation of the results. For instance, we have a significant TECHORDER ×TECH interaction (F1,14 = 5.43, p = 0.035), DragMagic is significantly faster than MultiViews for the participants starting with MultiViews (p = 0.002, a 26% speed-up), but not for the participants starting with DragMagic. Moreover, the Time for DragMagic for both TECHORDER and MultiViews for the participants starting with DragMagic are very close. Average errors are almost the same for the 4 conditions considered above.
Participants were overall significantly faster with Qpres than
with Qhist(p <0.001,6.5s vs. 9.2s), and made significantly less
errors (p <0.001,0.09 vs. 0.25). This is a reasonable result as Qhistis more complex since it relies more heavily on memory.
Subjective Results
Eleven out of sixteen participants preferred to use DragMagic over MultiViews, a slight – non significant – preference for DragMagic(χ2
1,16= 2.25, p = 0.134). Seven out of the eight
par-ticipants that started with MultiViews preferred DragMagic (χ2
1,8 = 4.5, p = 0.034), while from the participants that started
with DragMagic, four indicate a preference for DragMagic and four for MultiViews. Thus, TECH preference matches closely the results on time.
Regarding subjective mental workload, a TECHORDER × TECHinteraction is again present. Participants starting with MultiViewsreported a significantly higher mental workload for MultiViews than for DragMagic (p = 0.008,4.8 vs. 3.9on a
1−7scale). While for participants starting with DragMagic re-ported mental workload was similar between MultiViews (4.2) and DragMagic (4.1).
When reporting strategies, 10 participants explicitly men-tioned they always chose 2-3 promising simulations to focus on, even when more simulations were running.
Summary and Discussion
Participants starting with MultiViews were slower with this technique (without making less errors): participants starting with DragMagic were 33% faster with both DragMagic and with MultiViews, when compared to participants that started with MultiViews. The speed of DragMagic was fairly consis-tent across ordering conditions. The subjective results (pref-erence and mental workload) show a similar trend. Even if there is a learning effect on MultiViews, there is no such effect on DragMagic, which suggests that participants mastered the use of DragMagic faster than MultiViews. Moreover, using DragMagichas a positive learning impact on MultiViews. DragMagicexhibits slightly better performance than Multi-Viewsas the number of simulations increases, indicating that, as expected, reducing the distance between the simulations to be compared can be beneficial. Nevertheless, we did not measure any difference between MultiViews and DragMagic when the number of areas of interest increased.
Contrary to the model of Plumlee and Ware [30], we do not have a clear growing relation between Time and the number of comparisons needed to perform the task, in particular when it comes to the increase of areas of interests and number of simulations. This can be explained by the temporal nature of our task. Based on their comments, participants continuously compared simulations in the time between questions, not just at question time, and were thus able to identify and ignore ahead of time non-promising simulations, providing answers more quickly. Thus, the Plumlee and Ware model does not extend to tasks that have a temporal continuity.
When considering the traffic control context, our results in-dicate that both techniques can be effective for compari-son of simulation results of possible interventions, without a strong performance difference once users become familiar with them. We feel this shows both designs as viable alterna-tives in terms of performance, and thus designers can choose based on other criteria, like space requirements, positioning of operators in the control room, areas to be monitored, etc. Our study is perceptual in nature, thus we felt 16 non-expert participants were appropriate. Nevertheless, a larger number of participants could have provided more power to our results. Moreover, our study did not evaluate the interactive aspect of creating, managing and rearranging the DragMagic or the MultiViews. Finally, to ensure a realistic experiment duration, we fixed the time interval and changes between questions, but verifying that our results hold under varying intervals would strengthen our findings. These remain future work.
EARLY FEEDBACK FROM EXPERTS
A user feedback session was conducted with three of our orig-inal users, using a combination of a desktop demo and a video of the prototype used on the wall.
Our interviewees found the idea of interleaving the results of real time traffic data and model predictions very useful.
How-ever, all explained that these visualizations would not be used constantly, rather occasionally in situations when the results of possible actions are hard to predict. Operators mentioned they would most likely interact with them from their work-stations. Nevertheless, the operations manager explained that the setup of the walk-up and use wall (away from their work-station) could benefit operators in two ways: first by helping them focus on the task at hand without distractions such as camera feeds, etc. And second it could shift their attention away from the monotonous monitoring tasks, and thus allevi-ating boredom and improving overall performance.
All interviewees seemed to be more interested in the Drag-Magic visualization for comparing real and forecast data, as they give operators the information they need in the areas of interest ”and also the state of the traffic around it”.
Two operators thought separately of another use for our sys-tem not envisioned before. They felt our techniques can help them diagnose and predict problematic situations by compar-ing ”benchmark” traffic data (past data recorded under nor-mal conditions) with current traffic. As one explained, the system could suggest to operators to open the comparative visualizations when a big enough difference is detected. The visualizations could then provide context and help operators determine if the unusual behavior is a potential unreported incident that requires further investigation, or if the traffic sit-uation is deteriorating and requires intervention.
They also highlighted the need to incorporate some additional functionality, such as the ability to update messages on elec-tronic signs around the city and motorway for the public, and to integrate multiple global traffic light timing plans used cur-rently in the city that we did not have access to initially. One operator and the operations engineer are currently in-volved in the development of new systems that may include predictive models (without visualization). Both explained that our setup could also be very useful to their colleagues that work on improving traffic modeling for control centers. Their algorithms require careful tuning and they often need to run multiple small variations of them, that are hard to visu-alize concurrently on desktop screens.
CONCLUSION
We propose using interactive wall displays in road-traffic con-trol centers for interacting with real-time and simulated traffic data. After visiting two such centers, we designed a prototype that allows to monitor and act on the traffic (or on simula-tions) and, more importantly, to compare real traffic and sev-eral forecast simulations. To this end we use two visualization techniques: MultiViews and DragMagic, that we compared in a lab experiment in terms of situation awareness.
The results show that DragMagic is easier to master, but that both techniques are reasonable design options for control cen-ters, even for several simulations and areas of interest. It seems that the speed of monitoring tasks, that are temporal in nature, is not drastically affected by the number of compar-isons in multiple views (predicted by the Plumlee and Ware model [30]). Viewers can identify and ignore non-promising
forecasts, reducing the number of effective comparisons. Re-vising such models is interesting future work.
Expert users provided encouraging feedback and suggestions after seeing the prototype, appreciating in particular the use of DragMagic to follow forecast simulations while keeping the context of real traffic. They also found the prototype use-ful to compare real and past data to help identify possible problematic situations.
We next plan to study collaboration in control centers, in par-ticular the use of several DragMagics, and cases where some operators interact with the wall and others with their worksta-tion, a functionality we already support.
ACKNOWLEDGMENT
We thank P. Goatin, L. Charansonney and N. Acherar for their availability. We also thank C. Appert, E. Pietriga, O. Gladin and the members of theILDAteam. This research was par-tially supported by EquipEx Digiscope (ANR-10-EQPX-26-01).
REFERENCES
1. Andrienko G., Andrienko N., Hurter C., Rinzivillo S. & Wrobel S. From movement tracks through events to places: Extracting and characterizing significant places from mobility data. VAST ’11, IEEE (2011), 161–170. 2. Andrienko N. & Andrienko G. Visual analytics of
movement: An overview of methods, tools and procedures. Info. Vis. 12, 1 (2013), 3–24.
3. Andrienko N., Andrienko G. & Rinzivillo S. Exploiting spatial abstraction in predictive analytics of vehicle traffic. ISPRS Int. J. Geo-Inf. 4, 2 (2015), 591–606. 4. Andrienko N., Andrienko G. & Rinzivillo S. Leveraging
spatial abstraction in traffic analysis and forecasting with visual analytics. Info. Sys. 57 (2016), 172–194. 5. Bader T., Meissner A. & Tscherney R. Digital map table
with fovea-tablett®: Smart furniture for emergency operation centers. ISCRAM ’08, ISCRAM (2008), 2033–2034.
6. Ball R., North C. & Bowman D. A. Move to improve: promoting physical navigation to increase user
performance with large displays. CHI ’07, ACM (2007), 191–200.
7. Bezerianos A. & Isenberg P. Perception of visual variables on tiled wall-sized displays for information visualization applications. IEEE TVCG 18, 12 (2012), 2516–2525.
8. Bier E. A., Stone M. C., Pier K., Buxton W. & DeRose T. D. Toolglass and magic lenses: The see-through interface. SIGGRAPH ’93, ACM (1993), 73–80. 9. Butscher S., Hornbæk K. & Reiterer H. Spacefold and
physiclenses: Simultaneous multifocus navigation on touch surfaces. AVI ’14, ACM (2014), 209–216. 10. Chapuis O., Bezerianos A. & Frantzeskakis S. Smarties:
An input system for wall display development. CHI ’14, ACM (2014), 2763–2772.
11. Chokshi A., Seyed T., Marinho Rodrigues F. & Maurer F. ePlan multi-surface: A multi-surface environment for
emergency response planning exercises. ITS ’14, ACM (2014), 219–228.
12. Chrobok R., Hafstein S. F. & Pottmeier A. Olsim: A new generation of traffic information systems. Forschung und wissenschaftliches Rechnen, GWDG-Berichte Nr. 63(2004), 11–25.
13. Doeweling S., Tahiri T., Sowinski P., Schmidt B. & Khalilbeigi M. Support for collaborative situation analysis and planning in crisis management teams using interactive tabletops. ITS ’13, ACM (2013), 273–282. 14. Elmqvist N., Henry N., Riche Y. & Fekete J.-D.
Melange: Space folding for multi-focus interaction. CHI ’08, ACM (2008), 1333–1342.
15. Gutwin C. & Greenberg S. A descriptive framework of workspace awareness for real-time groupware. JCSCW 11, 3 (2002), 411–446.
16. Helbing D. Traffic and related self-driven many-particle systems. Rev. Mod. Phys. 73, 4 (2001), 1067–1141. 17. Hurter C., Lesbordes R., Letondal C., Vinot J.-L. & Conversy S. Strip’TIC: Exploring augmented paper strips for air traffic controllers. AVI ’12, ACM (2012), 225–232.
18. Hurter C., Tissoires B. & Conversy S. Fromdady: Spreading aircraft trajectories across views to support iterative queries. IEEE TVCG 15, 6 (2009), 1017–1024. 19. Ion A., Chang Y.-L. B., Haller M., Hancock M. & Scott S. D. Canyon: Providing location awareness of multiple moving objects in a detail view on large displays. CHI ’13, ACM (2013), 3149–3158.
20. Jakobsen M. R. & Hornbæk K. Up close and personal: Collaborative work on a high-resolution multitouch wall display. ACM ToCHI 21, 2 (2014), 11:1–11:34.
21. Javed W. & Elmqvist N. Exploring the design space of composite visualization. PacificVis ’12, IEEE (2012), 1–8.
22. Javed W., Ghani S. & Elmqvist N. Polyzoom: Multiscale and multifocus exploration in 2D visual spaces. CHI ’12, ACM (2012), 287–296.
23. Lampe O. D., Kehrer J. & Hauser H. Visual analysis of multivariate movement data using interactive difference views. VMV ’10, EG (2010), 315–322.
24. Liu C., Chapuis O., Beaudouin-Lafon M., Lecolinet E. & Mackay W. Effects of display size and navigation type on a classification task. CHI ’14, ACM (2014), 4147–4156.
25. Lobo M.-J., Pietriga E. & Appert C. An evaluation of interactive map comparison techniques. CHI ’15, ACM (2015), 3573–3582.
26. M¨uller J., Schwarz T., Butscher S. & Reiterer H. Back to tangibility: A post-wimp perspective on control room design. AVI ’14, ACM (2014), 57–64.
27. Nagel K. & Schreckenberg M. A cellular automaton model for freeway traffic. J. Phys. I 2, 12 (1992), 2221–2229.
28. Pietriga E., et al. Interaction design challenges and solutions for ALMA operations monitoring and control.
In SPIE 8451, Software and Cyberinfrastructure for Astronomy II, SPIE (2012), 10:1–10:16.
29. Pietriga E., Huot S., Nancel M. & Primet R. Rapid development of user interfaces on cluster-driven wall displays with jBricks. EICS ’11, ACM (2011), 185–190. 30. Plumlee M. D. & Ware C. Zooming versus multiple
window interfaces: Cognitive costs of visual comparisons. ACM ToCHI 13, 2 (2006), 179–209. 31. Prouzeau A., Bezerianos A. & Chapuis O. Surveillance
du trafic routier avec un mur d’´ecrans. IHM TeC ’15, ACM (2015), 6 pages.
32. Qin Y., Liu J., Wu C. & Shi Y. uEmergency: A collaborative system for emergency management on very large tabletop. ITS ’12, ACM (2012), 399–402. 33. Rashid U., Nacenta M. A. & Quigley A. Factors
influencing visual attention switch in multi-display user interfaces: A survey. PerDis ’12, ACM (2012), 1:1–1:6. 34. Riveiro M. Evaluation of normal model visualization for
anomaly detection in maritime traffic. ACM TIIS 4, 1 (2014), 5:1–5:24.
35. Scheepens R., Hurter C., van de Wetering H. & van Wijk J. Visualization, selection, and analysis of traffic flows. IEEE TVCG 22, 1 (2016), 379–388.
36. Scheepens R., Willems N., van de Wetering H.,
Andrienko G., Andrienko N. & van Wijk J. J. Composite density maps for multivariate trajectories. IEEE TVCG 17, 12 (2011), 2518–2527.
37. Schwarz T., Butscher S., Mueller J. & Reiterer H. Content-aware navigation for large displays in context of traffic control rooms. AVI ’12, ACM (2012), 249–252. 38. Smith P., Blandford A. & Back J. Questioning,
exploring, narrating and playing in the control room to maintain system safety. Cognition, Technology & Work 11, 4 (2009), 279–291.
39. Starke S., Cooke N., Howes A., Morar N. & Baber C. Visual sampling in a road traffic management control room task. In International Conference on Ergonomics & Human Factors, Taylor & Francis (2015), 503–511. 40. Tominski C., Schumann H., Andrienko G. & Andrienko
N. Stacking-based visualization of trajectory attribute data. IEEE TVCG 18, 12 (2012), 2565–2574. 41. Tufte E. R. The Visual Display of Quantitative
Information. Graphics Press, Cheshire, CT, USA, 1986. 42. Verma V. & Pang A. Comparative flow visualization.
IEEE TVCG 10, 6 (2004), 609–624.
43. Vlahogianni E. I., Golias J. C. & Karlaftis M. G. Short-term traffic forecasting: Overview of objectives and methods. Transport reviews 24, 5 (2004), 533–557. 44. Wang Z., Ye T., Lu M., Yuan X., Qu H., Yuan J. & Wu
Q. Visual exploration of sparse traffic trajectory data. IEEE TVCG 20, 12 (2014), 1813–1822.
45. Wang Baldonado M. Q., Woodruff A. & Kuchinsky A. Guidelines for using multiple views in information visualization. AVI ’00, ACM (2000), 110–119. 46. Ware C. & Lewis M. The dragmag image magnifier.