HAL Id: hal-01794028
https://hal-amu.archives-ouvertes.fr/hal-01794028
Submitted on 17 May 2018HAL is a multi-disciplinary open access archive for the deposit and dissemination of sci-entific research documents, whether they are pub-lished or not. The documents may come from teaching and research institutions in France or abroad, or from public or private research centers.
L’archive ouverte pluridisciplinaire HAL, est destinée au dépôt et à la diffusion de documents scientifiques de niveau recherche, publiés ou non, émanant des établissements d’enseignement et de recherche français ou étrangers, des laboratoires publics ou privés.
of organic food and body 2 weight change, risk of
overweight or obesity: Results from the NutriNet-Santé
Study
Emmanuelle Kesse-Guyot, Julia Baudry, Karen Assmann, Pilar Galan, Denis
Lairon
To cite this version:
Emmanuelle Kesse-Guyot, Julia Baudry, Karen Assmann, Pilar Galan, Denis Lairon. Prospective association between consumption frequency of organic food and body 2 weight change, risk of over-weight or obesity: Results from the NutriNet-Santé Study. British Journal of Nutrition, Cambridge University Press (CUP), 2017, �10.1017/S0007114517000058�. �hal-01794028�
Prospective association between consumption frequency of organic food and body 1
weight change, risk of overweight or obesity: Results from the NutriNet-Santé Study 2
Emmanuelle Kesse-Guyot1*, Julia Baudry1, Karen E Assmann1, Pilar Galan1, Serge 3
Hercberg1, 2, Denis Lairon3
4
1Sorbonne Paris Cité Epidemiology and Statistics Research Center (CRESS), Inserm U1153, 5
Inra U1125, Cnam, Paris 13 University, Nutritional Epidemiology Research Team (EREN),
F-6
93017 Bobigny, France ;
7
2Département de Santé Publique, Hôpital Avicenne, F-93017 Bobigny, France ; 8
3Aix Marseille Université, NORT ; Insem, UMR S 1062 ; Inra 1260, F-13385 Marseille, 9
France
10
*Correspondence: Email: e.kesse@eren.smbh.univ-paris13.fr 11
Equipe de Recherche en Epidémiologie Nutritionnelle (EREN)
12
SMBH Université Paris 13
13
74 rue Marcel Cachin, 93017 Bobigny, France
14
Running title: Organic food consumption and corpulence 15
Keywords: organic food, obesity, prospective cohort study, weight gain 16
Abbreviations: BMI: body mass index, OS: organic score, mPNNS-GS, PCA: Principal
Abstract 17
A lower body mass index (BMI) has been reported among consumers of organic foods but
18
this relationship has never been examined in a prospective design. Our aim was to
19
prospectively investigate the association between the frequency of organic foods and weight
20
change. We analyzed data from 62,224 participants of the NutriNet-Santé cohort (78%
21
women, mean age=45y) with information on consumption frequency of organic foods, dietary
22
intake, and repeated anthropometric data. For 16 products, participants reported their
23
consumption frequency of labeled organic foods (never, occasionally, most of the time). An
24
organic score (OS) with a maximum of 32 points was computed. The associations of the OS
25
(modeled as quartiles (Q)) with change in BMI during follow-up (on average 3·1 y), and with 26
the risk of overweight and obesity were estimated ANCOVA and multivariable logistic
27
regression. A lower BMI increase was observed across quartiles of the OS (mean difference
28
(95%CI) Q4 versus Q1= - 0·16 (-0·32, -0·01). An increase in OS was associated with a lower
29
risk of overweight and obesity (among non-overweight and non-obese participants at
30
inclusion): odds ratios (95%CI) Q4 versus Q1 were 0·77 (0·68, 0·86) and 0·69 (0·58, 0·82), 31
respectively. Concerning obesity risk, the association was stronger among participants with
32
higher adherence to nutritional guidelines. This study supports a strong protective role of
33
consumption frequency of organic foods concerning the risk of overweight and obesity that
34
depends on overall dietary quality. Upon confirmation, these results may contribute to
fine-35
tune nutritional guidelines by accounting for farming practices in food production.
Introduction 37
The global obesity epidemic, involving multifaceted origins, is a major public health issue (1).
38
Overweight and obesity contribute to the global burden of chronic diseases (2) - especially 39
type 2 diabetes and ischemic cardiovascular diseases (3), along with cancers (4,5).
40
Among the factors involved in the etiology of obesity, excess caloric consumption, sedentary
41
lifestyle and genetic susceptibility are well-recognized, but there is a growing concern for the
42
identification of novel factors involved such as gut microbiota (6) or environmental chemicals
43
(7-10). 44
Among the different dietary factors, organic food is of major interest since it presents multiple
45
features that could potentially protect from weight gain and obesity. Notably, compared to
46
conventional food, organic food has been suggested to present better nutritional values
47
concerning fatty acids profiles and specific micronutrients (11-13). Nonetheless, the possible
48
implications at an individual level in terms of daily nutrient intake are unknown due to the
49
lack of food composition tables accounting for farming practices. A small number of clinical
50
studies have been conducted that compared specific nutritional biomarkers according to the
51
type of diet (organic or conventional). However, due to short study durations, these studies
52
were not well-equipped to provide reliable results, and findings were inconsistent (14).
53
Organic foods are also characterized by a markedly low level or an absence of pesticide
54
residues, as repeatedly reported in food residue analyses (11,14,15) and in experimental studies
55
showing that adopting an organic diet leads to a drastic reduction in pesticide residues and
56
urine metabolites in children and adults (16-20). For most pesticide families (organochlorines
57
(now banned in the EU but still persistent), organophosphates, and pyrethrynoïds), a large
58
number of molecules have been recognized as endocrine disruptors (21), leading to possible 59
metabolic disorders (22). Indeed, a higher exposure to some of these compounds has been
60
associated with a higher risk for obesity or type 2 diabetes in humans (9).
In this context, consumption of organic foods might contribute to the management of weight
62
gain and of obesity risk. In a recent cross-sectional analysis based on the NutriNet-Santé
63
cohort, we showed that participants identified as regular consumers of organic food,
64
compared to non-consumers, presented reduced odds of being overweight or obese (-36% and
65
-62% in men and -42% and -48% in women, respectively) (23). Comparable findings were
66
reported in the German National Nutrition Survey II (NVS II), a nationwide food
67
consumption study conducted among 13,074 adults: German buyers of organic food exhibited
68
healthier lifestyles compared with non-buyers, and presented lower body weight (24). 69
To the best of our knowledge, no epidemiologic study has yet investigated the prospective
70
relation between consumption frequency of organic foods and the risk of overweight and
71
obesity. The main objective of the present study was thus to investigate the longitudinal
72
association between the frequency consumption of organic foods and change in body mass
73
index, the risk of overweight, and the risk of obesity in a very large adult cohort. Given our
74
previous finding that organic food consumers show a higher level of adherence to nutritional
75
recommendations (23) - especially a higher consumption of fruit and vegetables and a lower
76
consumption of animal products -a secondary objective was to explore a potential modifying
77
effect of the nutritional quality of the diet on the investigated associations.
78
Material and methods 79
Study population 80
The NutriNet-Santé is a web-based prospective observational cohort that was launched in
81
France in May 2009. The objectives, design and methodology have been described elsewhere
82
(25). The study was conducted according to the guidelines laid down in the Declaration of 83
Helsinki and was approved by the Institutional Review Board of the French Institute for
84
Health and Medical Research (IRB Inserm no. 0000388FWA00005831) and the “Commission
Nationale de l'Informatique et des Libertés” (CNIL no. 908450 and no. 909216). All subjects
86
signed an electronic informed consent.
87
Data collection and computation 88
Volunteers filled in self-administrated questionnaires using a dedicated website at baseline
89
and during follow-up on an approximately monthly basis. The baseline questionnaires,
90
inquired sociodemographic data and lifestyles, health status, physical activity,
91
anthropometrics and diet. These questionnaires were first pilot-tested and then compared to
92
traditional assessment methods or objectively validated (26-28). 93
Consumption frequency of organic products data 94
Two months after enrollment, volunteers were asked to provide information on their
95
consumption frequency of 16 labeled organic products (fruit, vegetables, soya, dairy products,
96
meat and fish, eggs, grains and legumes, bread and cereals, flour, vegetable oils and
97
condiments, ready-to-eat meals, coffee/tea/herbal tea, wine,
98
biscuits/chocolate/sugar/marmalade, other foods, dietary supplements). Initially, the
99
collection of these data was related to research questions focused on reasons for
non-100
consumptions. Consumption frequencies were presented in 8 modalities: (1) most of the time;
101
2) occasionally; 3) never (“too expensive”); 4) never (“product not available”); 5) never (“I’m
102
not interested in organic products”); 6) never (“I avoid such products”); 7) never (“for no
103
specific reason”); and 8) “I don’t know”). For each product, we allocated two and one points
104
to the “most of the time” and “occasionally” modalities, respectively (and 0 otherwise) - since
105
the objective of the present study was to focus on the level of frequency, and not on reasons
106
for non-consumption. The 16 dietary components were summed up to provide an organic
107
score (ranging from 0 to 32).
108
Anthropometric data 109
At enrollment and yearly after, participants were asked to report weight and height assessed
110
during a medical or occupational health examination by a physician, or from
self-111
measurement guided by standardized procedures (on flat surface, lightly dressed, and without
112
shoes). Self-reported anthropometric data have been shown to present an elevated
113
concordance with clinical assessment (26).
114
Body mass index (kg/m2) was calculated as weight divided by the square of height. Subjects
115
were classified as underweight or normal weight (BMI<25), overweight (including obesity;
116
BMI≥25), or obese (BMI≥30) according to the World Health Organization (WHO) reference
117
values (1).
118
Dietary data and physical activity 119
At baseline, quantitative dietary intakes were assessed using three 24-hour records (24HR),
120
randomly allocated over a two-week period, including two week-days and one weekend day,
121
using a validated method (27,28). Participants reported all foods and beverages consumed at
122
each eating occasion. Portion sizes were estimated with the help of photographs, derived from
123
a previously validated picture booklet (29) or directly entered as grams, volumes or purchased
124
units. Since alcohol is only episodically consumed by most individuals, alcohol intake was
125
calculated using either the 24HR or a frequency questionnaire for those identified as
126
abstainers in the three 24HR days. Moreover, since fish and seafood are infrequently
127
consumed by many individuals, the weekly consumption of this food group was assessed by a
128
specific frequency question. . Individual daily mean food consumption was calculated from
129
the three 24HR, weighted for the type of day (week or weekend day). Nutrient intakes were
130
calculated using the NutriNet-Santé composition table (30). Under-reporters were identified
131
and excluded using the validated method developed by Black (31). To assess nutritional diet
132
quality, a modified version of the validated PNNS-GS (without physical activity) was
133
computed. This modified score, the mPNNS-GS, reflects adherence to the official French
nutritional recommendations (32). The score includes 12 components: eight refer to
food-135
serving recommendations (fruit and vegetables; starchy foods; whole grain products; dairy
136
products; meat, eggs and fish; fish and seafood; vegetable fat; water vs soda) and four refer to
137
moderation in consumption (added fat; salt; sweets; alcohol). Moreover, points are deducted
138
for overconsumption of salt, added sugars, or when energy intake exceeds the estimated
139
energy needs by more than 5%.
140
In order to also account for a posteriori dietary patterns, we performed a principal component
141
analysis (PCA), on 31 aggregated food groups. Dietary patterns obtained by PCA are
142
independent linear combinations of the 31 food group consumptions, maximizing the
143
explained variance. Two dietary patterns were retained based on Cattel’s Scree plots and the
144
interpretability of the factors. Supplementary table S1 presents all factor loading coefficients
145
(corresponding to the correlations between the different food groups and the two dietary
146
patterns) > 0·3. For each participant, the individual pattern score was calculated by summing
147
the intake of the 31 food groups, weighted by their factor loading.
148
Covariates 149
At baseline, self-administered questionnaires were used to collect data including age, gender,
150
formal education (≤ high school diploma, high school, post-secondary graduate), occupation
151
(managerial staff, intermediate profession, employee/manual worker, retired, unemployed,
152
never employed/homemaker and self-employed), marital status (cohabiting or single),
153
income, number of children and smoking status (never, former and current). Income per
154
household unit was calculated by dividing the household’s total monthly income by the
155
number of consumption units (CU), using the following coefficients: 1 CU for the first adult
156
in the household, 0.5 CU for all other household members aged 14 or older and 0.3 CU for
157
children under 14 (33). The following categories of monthly income were used: <1,200,
1,200-158
1,800, 1,800-2,700 and >2,700 euros per household unit.
Physical activity was assessed by the International Physical Activity Questionnaire (IPAQ)
160
(34). Metabolic equivalents (MET) measured in minutes per week were computed. The 161
recommended IPAQ categories of physical activity were used: low (<30 min of brisk
162
walking/day), moderate (30 - <60 min/day of brisk walking /day or equivalent) and high (≥60
163
min of brisk walking /day or equivalent).
164
The inquired baseline health data included use of medication and self-reported history of
165
diseases (cancer, cardiovascular diseases, hypertension, dyslipidemia and diabetes).
166
Statistical analysis 167
For the present study, we used data from volunteers who were included before June 2014 and
168
initially aged 18-74 y. Among them, we selected those 1) who completed the organic
169
questionnaire, 2) with baseline anthropometric data and at least one measurement during
170
follow-up, 3) with available data to compute PNNS-GS and 4) who were not identified as
171
energy underreporters (Figure 1). Follow-up anthropometric data were collected until June
172
2015.
173
The participants included (N=62,224) into our analyses were compared to those excluded,
174
using Mann-Whitney-U tests and Chi square tests.
175
Baseline characteristics were presented by quartiles of the organic score. Values represent
176
means (±SD) or percentages, and P-values were calculated using linear contrast tests (for
177
continuous variables) or Chi square trend tests (for categorical variables).
178
The association of the organic score with BMI change was assessed by covariance analysis
179
(ANCOVA), modeling change in BMI as a percentage of the baseline value. Mean differences
180
(95% confidence intervals) were presented across quartiles of the organic score. Three
181
different models were performed. The first model was adjusted for baseline age and gender.
182
The second model was further adjusted for year and month of inclusion, follow-up duration,
183
occupation, marital status, education, monthly income per household unit, baseline use of
dietary supplements, the mPNNS-GS, PCA-extracted dietary patterns scores, energy intake,
185
physical activity and smoking status. The final model was further adjusted for history of
186
diseases (cancer, cardiovascular diseases, diabetes, hypertension and dyslipidemia).
187
In a second set of analyses, we estimated odds ratios (OR) and 95% confidence intervals (CI)
188
for becoming overweight or obese after exclusion of overweight and obese subjects at
189
baseline, respectively (leading to new study samples of n= 43,301 and n=56,806). Three
190
multivariate logistic regression models were computed with similar covariables to those used
191
in the covariance analysis.
192
A set of supplementary analyses was performed for the obesity risk outcome. First, stratified
193
analyses were conducted according to physical activity level/day brisk walking versus ≥30
194
min/day brisk walking or equivalent), use of dietary supplements (yes versus no), tobacco
195
status (never and former smokers versus current smokers), education level, and level of
196
adherence to nutritional guidelines (using tertiles of the mPNNS-GS). Second, we used an
197
alternative method of accounting for potential confounder bias: adjustment for a ‘propensity
198
score’ that contains information on potential confounders in a combined manner (35). To
199
obtain the propensity score, a multinomial logistic regression model was used to estimate the
200
predicted probability of organic food consumption (using quartiles of the 16-point organic
201
score) as a function of a wide range of factors (sociodemographic, health characteristics, food
202
group consumptions). Finally, we used inverse probability weighting to correct the estimates
203
for potential selection bias (36). All tests of statistical significance were two-sided and the type
204
I error was set at 5%. Statistical analyses were performed using SAS® software (version 9.3,
205
SAS Institute Inc, Cary, NC, USA).
206
Results 207
Comparison of included and excluded participants
Compared with excluded subjects, included subjects (N=62,224) were older, had a higher
209
education level and income, were less often smokers and less physically active. They also
210
presented a lower BMI and a higher nutritional quality of the diet (all P-values<0·05, data not 211
tabulated).
212
Baseline Characteristics of the sample
213
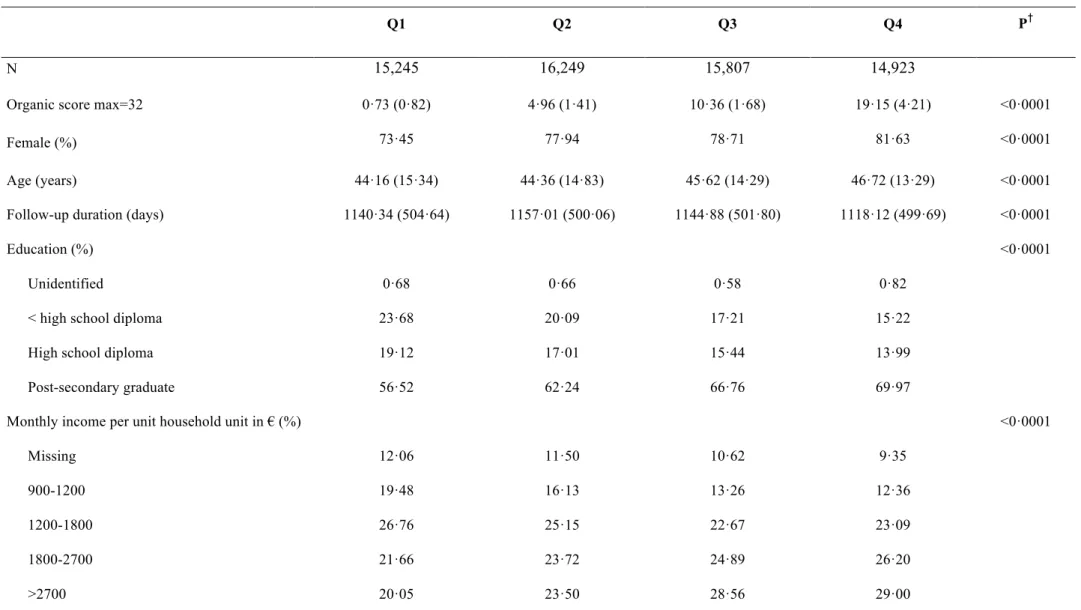
Baseline characteristics across quartiles of organic score are shown in Table 1. Higher levels
214
of the organic score were related to higher proportions of women, participants who were
215
cohabiting, former smokers, physically active participants, individuals reaching a
post-216
secondary educational level, and participants with a high income or occupational level. A
217
positive association was also observed with age, follow-up duration and the mPNNS-GS
218
(reflecting the nutritional quality of the diet), while there was a negative association with
219
energy intake, alcohol consumption and BMI.
220
Components of the organic score across quartiles of the organic score are shown in Table 2.
221
In the first quartile (Q1), participants mostly reported no consumption of any organic
222
products. In the 4th quartile (Q4), participants reported more frequently consuming organic
223
products, especially products of the following food groups: eggs, starchy food, vegetables,
224
vegetable oil, fruits and flour.
225
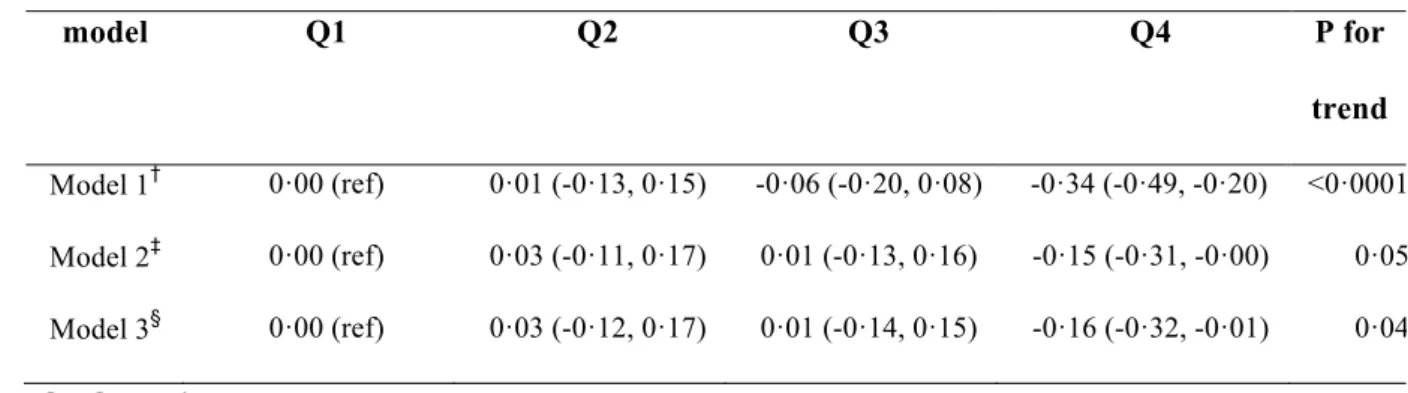
Then mean follow-up time in our study sample was 3·12 (SD=1·37) years. Results on the 226
prospective association between the organic score and change in BMI over time are presented
227
in Table 3. In the second model, higher organic score levels were related to a substantially
228
lower increase in BMI over time (mean difference Q4 versus Q1= -0·15; confidence interval=
229
--0·31, -0·01, P for trend =0·05). After further adjustment for history of chronic diseases
230
(third model), an even stronger association was observed (mean difference Q4 versus Q1=
-231
0·16; confidence interval= -0·32, -0·01, P for trend =0·04).
Results on the prospective association between the organic score and the risk of overweight
233
and obesity are presented in Table 4. In the fully-adjusted model, accounting for
234
sociodemographic data, lifestyles and history of chronic diseases, a linear decrease in the risk
235
of overweight was observed across quartiles of the organic score, with risk reduction of 23%
236
in Q4 compared to Q1. Findings concerning the risk of obesity were similar, with a risk
237
reduction of 31% in Q4 compared to Q1.
238
Stratified analyses are presented in Figure 2 and in Supplemental Table S2. We observed
239
that the association between the organic score and the risk of obesity was stronger among
240
participants with a higher nutritional quality of the diet. Overall, in the different stratified
241
analyses, the association between the organic score and the risk of obesity was observed in
242
each sub-group, except for dietary supplement users and participants with an intermediate
243
education level. Accounting for selection bias via inverse probability weighting did not
244
substantially modify our findings (data not shown). Models with additional adjustment for a
245
propensity score are presented in Supplemental Table S3. Here, the investigated associations
246
were attenuated but remained statistically significant.
247
Discussion 248
The present results show, for the first time, a strong negative association between the
249
consumption frequency of organic foods and BMI change over time, as well as a marked
250
reduction of the risk of overweight and obesity.
251
In stratified analyses, significant associations were observed in almost all investigated
252
subgroups, except for dietary supplement users and participants with an intermediate level of
253
education. Importantly, both participants with a low level of physical activity and participants
254
with a low education level presented a significantly lower risk of obesity with increasing
255
organic food consumption. It is noteworthy that the nutritional quality of the diet, estimated
256
by using an a priori dietary index reflecting adherence to the French nutritional guidelines (32),
appears to be a key effect modifier. Indeed, the strongest associations were observed among
258
participants presenting a high nutritional quality of the diet.
259
Consumption frequency of organic foods and the risk of obesity or overweight 260
We prospectively observed a markedly lower risk of obesity among subjects with a high
261
consumption frequency of organic foods. Previous investigations of data from the
NutriNet-262
Santé cohort have revealed that regular consumers of organic foods presented a healthier diet
263
and healthier lifestyle characteristics (related to physical activity and tobacco use) as
264
compared to irregular consumers or non-consumers. Moreover, regular consumers of organic
265
foods in the NutriNet-Santé study presented specificities with respect to chronic disease
266
history (23,37). After accounting for these potential confounders, the findings of the present
267
study were partially attenuated but the association remained strong and highly significant,
268
with a reduction in the risk of obesity of 37% after a 3·1 y follow-up. 269
A similar association was observed for overweight, although the strength of the association
270
was smaller.
271
Comparison of our results with the findings of other studies 272
No previous longitudinal study has investigated the association between organic food
273
consumption frequency and weight change or the risk of overweight and obesity, but a
274
potential beneficial link between body weight and organic food consumption or purchase has
275
been documented in several cross-sectional studies (23,24,38). For instance, a previous
276
investigation of NutriNet-Santé data (23) has shown that regular organic food consumers
277
showed a markedly lower probability of overweight (excluding obesity) and obesity
278
compared to non-consumers (-36% and -62% in men and -42% and -48% in women,
279
respectively). In addition, in the German National Nutrition Survey II (24), as compared to 280
non-buyers of organic food, buyers of organic food presented lower proportions of
281
overweight (35·5% versus 39·2%) and obesity (17·9% versus 22·5%). Our findings are also 282
concordant with a small Italian clinical study (including 100 healthy males and 50 males
283
suffering from chronic kidney disease, CDK) that reported a statistically significant reduction
284
in weight among CDK patients after introducing an organic diet for a 2-week period
285
(85·17±13·97 kg at baseline versus 79·52±10·41 kg after the 2-week intervention, p<0·05) (39). 286
Overall, the currently available cross-sectional or longitudinal surveys consistently reported
287
an association between higher organic food consumption and a lower BMI. The association
288
with a lower increase in BMI over time that we observed in the present study is of particular
289
interest as it supports a possible role of the organic-based diet in weight management among
290
all subjects, beyond the risk of overweight or obesity among initially normal weight (or
291
underweight) individuals.
292
Modulating effect of the nutritional quality of the diet 293
There is growing evidence supporting the observation that consumers of organic food present
294
a nutritionally healthier diet as well as other beneficial lifestyles such as lower alcohol
295
consumption, no smoking and a higher physical activity level (23,24,40,41). Thus, we
296
hypothesized that the link between consumption of organic foods and body weight might be
297
modulated by the overall nutritional quality of the diet. Indeed, we found that the strongest
298
reduction in obesity risk (related to a higher consumption frequency of organic foods) was
299
observed among participants with a healthier diet. Conversely, among participants with a less
300
healthy diet (susceptible to promote weight gain), the association between consumption
301
frequency of organic food and obesity risk was of smaller magnitude. It is well known that
302
unhealthy eating habits play a key role in the etiology of obesity (3). Therefore, the mode of
303
production of the foods consumed may be of secondary importance in these subjects. It is also
304
possible that their dietary patterns, which are low in fruit and vegetables, lead to less
305
contaminated diets.
Several hypotheses can be proposed to explain the differences in the risk of obesity between
307
organic food consumers and non-consumers who present a healthy diet. Because we adjusted
308
and then stratified for the global nutritional quality of the diet (using the mPNNS-GS score) in
309
our models, it is not probable that our results were biased by the fact that organic food
310
consumers present healthier diets. Other possible explanations include differences in organic
311
food and conventional food with respect to various nutritional compounds.
312
First, the results of a number of studies argue for a higher concentration of polyunsaturated
313
fatty acids (especially n-3 fatty acids) in organic dairy and meat products; and of antioxidants
314
(especially vitamin C and phenolic compounds) in organic plant foods (11-13). While observed
315
differences in nutrient content can vary by about 10-68% at the food level (not accounted for
316
in our study), it is possible that the overall variations of nutrient intake in an organic diet is
317
sufficient to affect weight management (42,43) . However, this remains to be further evaluated.
318
Another hypothesis is related to the fact that individuals with a higher adherence to the French
319
nutritional guidelines tend to consume more plant-based foods. It is well known that plant
320
foods are frequently contaminated by various pesticide residues (about 45% of the tested
321
samples in Europe) (44) because they are heavily sprayed with pesticides during conventional
322
agricultural production and storage. This hypothesis is in line with findings of human surveys
323
that have related obesity and type 2 diabetes to pesticide exposure (7,9,10,45,46). Thus, unlike the 324
consumption of pesticide-free or only slightly contaminated plant products (11,14,15), a high 325
consumption of conventionally grown plant foods may be related to adverse health effects
326
related to higher pesticide exposure.
327
Indeed, replacing conventional food by organic food has repeatedly been shown to drastically
328
reduce the level of organophosphate residues in human urines (16-20). A specific example of a 329
potential adverse health effect of contaminated fruit and vegetables is that high consumers of
330
conventional or contaminated fruits and vegetables presented a particularly low semen quality
(47,48). This reinforces the concept that different dietary profiles (with various degrees of intake 332
of contaminated food) lead to different levels of exposure to “obesogen” chemicals (9), but this
333
hypothesis needs to be investigated in future biomonitoring-based studies that compare
334
organic and conventional diets with various dietary profiles.
335
Potential mechanistic pathways explaining the association between organic food consumption 336
and body weight 337
Our findings may be interpreted in light of the reduced exposure to pesticides among organic
338
food consumers. Pesticides (prohibited in organic farming when they are synthetic) often
339
present endocrine-disrupting properties that cause developmental and reproductive
340
abnormalities via the modification of signaling processes (46). Besides, new scientific research
341
argues for a role of pesticides in metabolic disruption, (22) leading to obesity and type 2
342
diabetes (9). Mechanistic pathways depend on the type of pesticides. Previous studies have
343
shown an alteration of glucose and lipid metabolism by organochlorines (49). Moreover, 344
organochlorines have been shown to affect the control of adipogenesis through an alteration
345
of glucose transport and glycolysis, an alteration of mitochondrial activity, and of fatty acid
346
oxidation (49). Organophosphates have been shown to alter carbohydrate and lipid metabolism
347
by disrupting glucose homeostasis (49). In addition, some pesticides have been shown to affect
348
the regulation of eating behavior and the differentiation of adipocytes (50). 349
Further studies are necessary to better evaluate metabolic disruption and the “obesogen”
350
capacity of endocrine-disrupting chemicals contained in conventional foods.
351
Strengths and limitations 352
The main limitation of our study is that it is based on self-reported weight and height data.
353
However, these data have been shown to have a good concordance with data from clinical
354
assessments in a validation study (26). This validation study showed high intraclass correlation
355
coefficients, ranging from 0.94 for height to 0.99 for weight, and the concordance for BMI
classification was 93% (sensibility=88% and specificity=99%). Second, the generalizability
357
of our findings is limited since participants were volunteers involved in a long-term cohort
358
focused on nutrition and health. The individuals included in our study sample are thus likely
359
to be particularly health conscious. A final limitation pertains to the difficulty to disentangle
360
the role of overall dietary patterns from the role of organic food consumption, despite of the
361
extensive adjustment and stratification made. Since the design of our study is observational,
362
residual confounding cannot be ruled out. In particular, it is likely that unmeasured or only
363
indirectly measured factors, including genetic factors, ethnicity, environmental (e.g. food or
364
built environment) or psychological factors (e.g. occupational stress) may modify the
365
association between organic food consumption and obesity.
366
Our study also presents important strengths. First, the rich and accurately collected data
367
permitted to account for a broad range of potential confounders, including lifestyles and
368
health outcomes. Moreover, the very large sample size of our study enabled us to conduct
369
statistically powerful stratified analyses. Another important strength is the prospective design
370
of our analysis that implies a high level of evidence. Finally, the availability of accurate
371
dietary data allowed us to adjust for the nutritional quality of the diet, using a validated
372
dietary index.
373
Conclusion 374
This study, based on data collected in a very large prospective cohort, is the first to support a
375
prospective relation between consumption frequency of organic foods and body weight
376
change, as well as a strong negative association with the risk of overweight and obesity. The
377
overall nutritional quality of the diet may exert a modulating effect in these relationships, with
378
a stronger effect observed among those presenting a healthy plant-based diet. Further studies,
379
especially studies based on quantitative organic consumption data taking into account a
380
diversity of dietary profiles (plant based, western etc.), are needed to confirm these results. If
confirmed, these findings are of major interest from a public health point of view, as they
382
reinforce the need to fine-tune nutritional guidelines by accounting for the mode of food
383
production.
384
Acknowledgment 385
The authors Nathalie Arnault, Stephen Besseau, Laurent Bourhis, Julien Allègre, Than Duong Van, 386
Younes Esseddik, Cédric Agaesse, Claudia Chahine, Paul Flanzy, Mac Rakotondrazafy and Fabien 387
Szabo for their technical contribution to the NutriNet-Santé study. 388
Financial support 389
The NutriNet-Santé study is supported by the French Ministry of Health (DGS), the French
390
Institute for Health Surveillance (InVS), the National Institute for Prevention and Health
391
Education (INPES), the Foundation for Medical Research (FRM), the National Institute for
392
Health and Medical Research (INSERM), the National Institute for Agricultural Research
393
(INRA), the National Conservatory of Arts and Crafts (CNAM), and the University of Paris
394
13.
395
Conflict of Interest 396
None of the authors declares any conflict of interest.
397
Authorship 398
EKG: conducted the literature review and drafted the manuscript; EKG: performed analyses;
399
EKG, JB, KEA, PG, SH and DL: were involved in the interpretation of results and critically
400
reviewed the manuscript; and SH, PG and EKG: were responsible for the development of the
401
design and the protocol of the study. All authors read and approved the final manuscript.
Reference List 403
404
1. WHO (2000) Obesity: preventing and managing the global epidemic., vol. 894: World Health 405
Organization Technical Report Series. 406
2. WHO (2009) Global Health Risks. Geneva: WHO Technical Report. 407
3. WHO Europe (2007) The challenge of obesity in the WHO European Region. 408
4. Latino-Martel P, Cottet V, Druesne-Pecollo N et al. (2016) Alcoholic beverages, obesity, 409
physical activity and other nutritional factors, and cancer risk: A review of the evidence. 410
Crit Rev Oncol Hematol 99, 308-323.
411
5. American Institute for Cancer Research / World Cancer Research Fund (2007) Food, Nutrition, 412
Physical activity, and the Prevention of Cancer: a global perspective. Washington, DC:
413
American Institute for Cancer Research. 414
6. Hansen TH, Gobel RJ, Hansen T et al. (2015) The gut microbiome in cardio-metabolic health. 415
Genome Med 7, 33.
416
7. Lee DH, Porta M, Jacobs DR, Jr. et al. (2014) Chlorinated persistent organic pollutants, obesity, 417
and type 2 diabetes. Endocr Rev 35, 557-601. 418
8. Snedeker SM & Hay AG (2012) Do interactions between gut ecology and environmental 419
chemicals contribute to obesity and diabetes? Environ Health Perspect 120, 332-339. 420
9. Thayer KA, Heindel JJ, Bucher JR et al. (2012) Role of environmental chemicals in diabetes 421
and obesity: a National Toxicology Program workshop review. Environ Health Perspect 422
120, 779-789. 423
10. Lubrano C, Genovesi G, Specchia P et al. (2013) Obesity and metabolic comorbidities: 424
environmental diseases? Oxid Med Cell Longev 2013, 640673. 425
11. Baranski M, Srednicka-Tober D, Volakakis N et al. (2014) Higher antioxidant and lower 426
cadmium concentrations and lower incidence of pesticide residues in organically grown 427
crops: a systematic literature review and meta-analyses. Br J Nutr 112, 794-811. 428
12. Srednicka-Tober D, Baranski M, Seal C et al. (2016) Composition differences between organic 429
and conventional meat: a systematic literature review and meta-analysis. Br J Nutr, 1-430
18. 431
13. Srednicka-Tober D, Baranski M, Seal CJ et al. (2016) Higher PUFA and n-3 PUFA, conjugated 432
linoleic acid, alpha-tocopherol and iron, but lower iodine and selenium concentrations in 433
organic milk: a systematic literature review and meta- and redundancy analyses. Br J 434
Nutr, 1-18.
435
14. Smith-Spangler C, Brandeau ML, Hunter GE et al. (2012) Are organic foods safer or healthier 436
than conventional alternatives?: a systematic review. Ann Intern Med 157, 348-366. 437
15. Lairon D (2010) Nutritional quality and safety of organic food: a review. Agron Sustain Dev 30, 438
33-41. 439
16. Curl CL, Fenske RA & Elgethun K (2003) Organophosphorus pesticide exposure of urban and 440
suburban preschool children with organic and conventional diets. Environ Health 441
Perspect 111, 377-382.
442
17. Lu C, Toepel K, Irish R et al. (2006) Organic diets significantly lower children's dietary 443
exposure to organophosphorus pesticides. Environ Health Perspect 114, 260-263. 444
18. Bradman A, Quiros-Alcala L, Castorina R et al. (2015) Effect of Organic Diet Intervention on 445
Pesticide Exposures in Young Children Living in Low-Income Urban and Agricultural 446
Communities. Environ Health Perspect 123, 1086-1093. 447
19. Oates L, Cohen M, Braun L et al. (2014) Reduction in urinary organophosphate pesticide 448
metabolites in adults after a week-long organic diet. Environ Res 132, 105-111. 449
20. Curl CL, Beresford SA, Fenske RA et al. (2015) Estimating pesticide exposure from dietary 450
intake and organic food choices: the Multi-Ethnic Study of Atherosclerosis (MESA). 451
Environ Health Perspect 123, 475-483.
452
21. Mnif W, Hassine AI, Bouaziz A et al. (2011) Effect of endocrine disruptor pesticides: a review. 453
Int J Environ Res Public Health 8, 2265-2303.
454
22. Casals-Casas C & Desvergne B (2011) Endocrine disruptors: from endocrine to metabolic 455
disruption. Annu Rev Physiol 73, 135-162. 456
23. Kesse-Guyot E, Peneau S, Mejean C et al. (2013) Profiles of organic food consumers in a large 457
sample of French adults: results from the Nutrinet-Sante cohort study. PLoS One 8, 458
e76998. 459
24. Eisinger-Watzl M, Wittig F, Heuer T et al. (2015) Customers Purchasing Organic Food - Do 460
They Live Healthier? Results of the German National Nutrition Survey II. Eur J Nutr 461
Food Saf 5, 59-71.
462
25. Hercberg S, Castetbon K, Czernichow S et al. (2010) The Nutrinet-Sante Study: a web-based 463
prospective study on the relationship between nutrition and health and determinants of 464
dietary patterns and nutritional status. BMC Public Health 10, 242. 465
26. Lassale C, Peneau S, Touvier M et al. (2013) Validity of web-based self-reported weight and 466
height: results of the Nutrinet-Sante study. J Med Internet Res 15, e152. 467
27. Lassale C, Castetbon K, Laporte F et al. (2015) Validation of a Web-based, self-administered, 468
non-consecutive-day dietary record tool against urinary biomarkers. Br J Nutr 113, 953-469
962. 470
28. Lassale C, Castetbon K, Laporte F et al. (2015) Correlations between Fruit, Vegetables, Fish, 471
Vitamins, and Fatty Acids Estimated by Web-Based Nonconsecutive Dietary Records 472
and Respective Biomarkers of Nutritional Status. J Acad Nutr Diet. 473
29. Le Moullec N, Deheeger M, Preziosi P et al. (1996) Validation du manuel photos utilisé pour 474
l'enquête alimentaire de l'étude SU.VI.MAX. Cahier de Nutrition et de Diététique 31, 475
158-164. 476
30. NutriNet-Santé coordination (2013) Table de composition des aliments - Etude NutriNet-Santé. 477
Paris: Economica. 478
31. Black AE (2000) Critical evaluation of energy intake using the Goldberg cut-off for energy 479
intake:basal metabolic rate. A practical guide to its calculation, use and limitations. Int J 480
Obes Relat Metab Disord 24, 1119-1130.
481
32. Estaquio C, Kesse-Guyot E, Deschamps V et al. (2009) Adherence to the French Programme 482
National Nutrition Sante Guideline Score is associated with better nutrient intake and 483
nutritional status. J Am Diet Assoc 109, 1031-1041. 484
33. INSEE (Institut National de la Statistique et des Etudes Economiques) website (2012). 485
http://www.insee.fr/en/methodes/. 486
34. Hagstromer M, Oja P & Sjostrom M (2006) The International Physical Activity Questionnaire 487
(IPAQ): a study of concurrent and construct validity. Public Health Nutr 9, 755-762. 488
35. Ali MS, Groenwold RH & Klungel OH (2016) Best (but oft-forgotten) practices: propensity 489
score methods in clinical nutrition research. Am J Clin Nutr 104, 247-258. 490
36. Seaman SR & White IR (2011) Review of inverse probability weighting for dealing with 491
missing data. Stat Methods Med Res. 492
37. Baudry J, Mejean C, Peneau S et al. (2015) Health and dietary traits of organic food consumers: 493
results from the NutriNet-Sante study. Br J Nutr, 1-10. 494
38. Torjusen H, Brantsaeter AL, Haugen M et al. (2010) Characteristics associated with organic 495
food consumption during pregnancy; data from a large cohort of pregnant women in 496
Norway. BMC Public Health 10, 775. 497
39. De Lorenzo A, Noce A, Bigioni M et al. (2010) The effects of Italian Mediterranean organic 498
diet (IMOD) on health status. Curr Pharm Des 16, 814-824. 499
40. Oates L, Cohen M & Braun L (2012) Characteristics and consumption patterns of Australian 500
organic consumers. J Sci Food Agric 92, 2782-2787. 501
41. Petersen SB, Rasmussen MA, Strom M et al. (2013) Sociodemographic characteristics and food 502
habits of organic consumers--a study from the Danish National Birth Cohort. Public 503
Health Nutr 16, 1810-1819.
504
42. Lorente-Cebrian S, Costa AG, Navas-Carretero S et al. (2013) Role of omega-3 fatty acids in 505
obesity, metabolic syndrome, and cardiovascular diseases: a review of the evidence. J 506
Physiol Biochem 69, 633-651.
507
43. Meydani M & Hasan ST (2010) Dietary polyphenols and obesity. Nutrients 2, 737-751. 508
44. EFSA (European Food Safety Authority) (2015) The 2013 European Union Report on Pesticide 509
Residues in Food. EFSA J 13. 510
45. Lee DH, Steffes MW, Sjodin A et al. (2011) Low dose organochlorine pesticides and 511
polychlorinated biphenyls predict obesity, dyslipidemia, and insulin resistance among 512
people free of diabetes. PLoS One 6, e15977. 513
46. Heindel JJ, Newbold R & Schug TT (2015) Endocrine disruptors and obesity. Nat Rev 514
Endocrinol 11, 653-661.
515
47. Chiu YH, Afeiche MC, Gaskins AJ et al. (2015) Fruit and vegetable intake and their pesticide 516
residues in relation to semen quality among men from a fertility clinic. Hum Reprod 30, 517
1342-1351. 518
48. Juhler RK, Larsen SB, Meyer O et al. (1999) Human semen quality in relation to dietary 519
pesticide exposure and organic diet. Arch Environ Contam Toxicol 37, 415-423. 520
49. Androutsopoulos VP, Hernandez AF, Liesivuori J et al. (2013) A mechanistic overview of 521
health associated effects of low levels of organochlorine and organophosphorous 522
pesticides. Toxicology 307, 89-94. 523
50. Mostafalou S & Abdollahi M (2013) Pesticides and human chronic diseases: evidences, 524
mechanisms, and perspectives. Toxicol Appl Pharmacol 268, 157-177. 525
526 527
Table 2 Components of the organic score, across organic score quartiles, Nutrinet-Santé 533 study, N=62,224* 534 Q1 Q2 Q3 Q4 P† Fruits 0·06 (0·25) 0·57 (0·52) 0·95 (0·41) 1·49 (0·53) <0·0001 Vegetables 0·07 (0·27) 0·59 (0·55) 0·97 (0·48) 1·51 (0·54) <0·0001 Rice, pasta, other cereals 0·06 (0·23) 0·42 (0·51) 0·90 (0·50) 1·62 (0·52) <0·0001 Breads 0·05 (0·22) 0·36 (0·51) 0·82 (0·53) 1·44 (0·59) <0·0001 Flour 0·04 (0·20) 0·23 (0·45) 0·67 (0·62) 1·47 (0·65) <0·0001 Vegetable oils 0·04 (0·22) 0·27 (0·51) 0·74 (0·65) 1·58 (0·58) <0·0001 Dairy products 0·05 (0·23) 0·40 (0·54) 0·86 (0·58) 1·42 (0·65) <0·0001 Meats & seafoods 0·02 (0·14) 0·19 (0·41) 0·50 (0·54) 0·92 (0·66) <0·0001 Eggs 0·13 (0·36) 0·70 (0·70) 1·19 (0·70) 1·72 (0·54) <0·0001 Soja products 0·06 (0·24) 0·20 (0·44) 0·40 (0·59) 0·88 (0·76) <0·0001 Sweet products 0·03 (0·19) 0·33 (0·48) 0·76 (0·50) 1·38 (0·58) <0·0001 Tea, coffee, herbal tea 0·04 (0·19) 0·27 (0·47) 0·66 (0·59) 1·33 (0·67) <0·0001 Wines 0·03 (0·17) 0·14 (0·35) 0·29 (0·47) 0·65 (0·64) <0·0001 Ready-to-use dishes 0·01 (0·08) 0·06 (0·24) 0·19 (0·39) 0·39 (0·54) <0·0001 Dietary supplements 0·03 (0·18) 0·13 (0·36) 0·25 (0·49) 0·56 (0·68) <0·0001 Other dietary items 0·01 (0·12) 0·09 (0·30) 0·24 (0·45) 0·80 (0·80) <0·0001
Q ; Quartile
535
*Values are means (SD) of sub-score given that non-consumption, occasional, regular 536
consumption are coded 0, 1, 2, respectively.
537
†P for linear trend 538
Table 3 Association between organic score in quartile and BMI change over time, 539 Nutrinet-Santé study, 2009-2015, N=62,224* 540 model Q1 Q2 Q3 Q4 P for trend Model 1† 0·00 (ref) 0·01 (-0·13, 0·15) -0·06 (-0·20, 0·08) -0·34 (-0·49, -0·20) <0·0001 Model 2‡ 0·00 (ref) 0·03 (-0·11, 0·17) 0·01 (-0·13, 0·16) -0·15 (-0·31, -0·00) 0·05 Model 3§ 0·00 (ref) 0·03 (-0·12, 0·17) 0·01 (-0·14, 0·15) -0·16 (-0·32, -0·01) 0·04 Q; Quartile 541
*Values are mean differences (95% confident intervals). A negative value (-0
·xx) indicates 542
that the observed increase (expressed as a percentage of the initial anthropometric marker)
543
was lower of 0·xx in the respective quartile than in quartile 1 (ref). 544
†Model 1 is adjusted for age and gender. 545
‡Model 2 is model 1 further adjusted for month and year of inclusion, duration of follow-up, 546
occupation, marital status, education, monthly income per unit, dietary supplement use,
547
mPNNS-GS, PCA-extracted dietary patterns scores, energy intake, physical activity and
548
tobacco status.
549
§Model 3 is model 2 further adjusted for the history of chronic diseases. 550
Table 4 Prospective association between quartiles of the organic score and overweight or 551
obesity risk, Nutrinet-Santé study, 2009-2015*. 552 Model Q1 Q2 Q3 Q4 P for trend Overweight (N=3,259/40,042) Model 1† 1·00 0·94 (0·86- 1·04) 0·83 (0·75- 0·91) 0·62 (0·56- 0·69) <·0001 Model 2‡ 1·00 1·00 (0·91, 1·10) 0·93 (0·84, 1·02) 0·75 (0·67, 0·84) <·0001 Model 3§ 1·00 1·00 (0·91, 1·10) 0·93 (0·84, 1·03) 0·77 (0·68, 0·86) <·0001 Obesity (1,337/55,469) Model 1† 1·00 0·87 (0·75, 1·01) 0·79 (0·68, 0·91) 0·52 (0·45, 0·61) <·0001 Model 2‡ 1·00 0·93 (0·80, 1·08) 0·90 (0·78, 1·04) 0·66 (0·55, 0·78) <·0001 Model 3§ 1·00 0·94 (0·81, 1·09) 0·92 (0·79, 1·06) 0·69 (0·58, 0·82) 0·0001 *Overweight (including obesity) and obesity analyses were performed among participants who 553
were not overweight or obese at inclusion, respectively.Values are odds ratios (95% confident
554
intervals), using 1st quartile Q1 as the reference.
555
†Model 1 is adjusted for age and gender. 556
‡Model 2 is model 1 further adjusted for month and year of inclusion, delay of follow-up, 557
occupation, marital status, education, monthly income per unit, dietary supplement use,
558
mPNNS-GS, PCA-extracted dietary patterns scores, energy intake physical activity and
559
tobacco status.
560
§Model 3 is model 2 further adjusted for the history of chronic diseases.
Supplemental Table S1: Factor loading matrix, NutriNet-Santé study* 562
Variable Factor1 Factor2
Vegetables 0·65 0·14
Fruit 0·45 0·06
Broth 0·43 0·17
Coffee, tea, tisane 0·43 0·01
Soda -0·42 0·06
Croissants -0·37 0·03
Nuts 0·36 0·04
Fat and sweet products -0·35 0·07
Dried fruits 0·33 -0·03
Snacks -0·28 0·23
Soya products 0·28 -0·16
Meat and meat products -0·28 0·39
Seafood 0·27 -0·02
Dairy desserts -0·25 0·04
Bread and breakfast cereals 0·22 0·54
Cakes and pastries -0·18 0·15
Alcoholic beverages -0·18 0·34 Margarine 0·16 0·12 Flour 0·13 0·06 Eggs 0·12 0·02 Animal Fat 0·09 0·41 Dairy products 0·07 -0·09 Cheese -0·05 0·53 Potatoes 0·05 0·41 Vegetable oils 0·03 0·28 Starchy food 0·03 0·07 Meal substitutes 0·02 -0·16 Sauces -0·01 0·23 Sweet products -0·01 0·27
Water and non-sweet bevarages 0·01 0·14
Wine 0·01 0·42
*Absolute values < 0
·3 are not displayed in the table. 563
Supplemental Table S2 Prospective association between quartiles of the organic score 564
and obesity risk, stratified analyses, Nutrinet-Santé study, 2009-2015*,†. 565
Q1 Q2 Q3 Q4 P for
trend Education
< high school diploma 1·00 1·21 (0·91, 1·61) 0·88 (0·65, 1·19) 0·73 (0·52, 1·04) 0·04 High school diploma 1·00 0·80 (0·56, 1·14) 0·97 (0·69, 1·35) 0·82 (0·55, 1·20) 0·48 Post-secondary graduate 1·00 0·95 (0·78, 1·15) 0·92 (0·75, 1·12) 0·69 (0·55, 0·87) 0·003 Physical activity
<30 min/day brisk walking 1·00 0·68 (0·51, 0·90) 0·76 (0·58, 1·01) 0·53 (0·38, 0·74) 0·001 ≥30 min/day brisk walking or equivalent 1·00 0·97 (0·80, 1·18) 0·90 (0·73, 1·10) 0·74 (0·59, 0·92) 0·01 Smoking status
Never or former smokers 1·00 0·95 (0·81, 1·11) 0·90 (0·76, 1·06) 0·72 (0·59, 0·86) 0·001
Current smokers 1·00 0·74 (0·51, 1·06) 0·95 (0·65, 1·38) 0·55 (0·36, 0·86) 0·04
Dietary supplement users
yes 1·00 1·16 (0·94, 1·45) 1·05 (0·84, 1·32) 0·79 (0·61, 1·03) 0·11
no 1·00 0·92 (0·75, 1·12) 0·75 (0·60, 0·95) 0·67 (0·52, 0·85) 0·0003
*Obesity analyses were performed among participants who were not obese at inclusion 566
(N=56,806). Values are odds ratios (95% confident intervals), using 1st quartile Q1 as the
567
reference.
568
†Models are adjusted for age, gender, month and year of inclusion, delay of follow-up, 569
occupation, marital status, education, monthly income per unit, dietary supplement use,
570
mPNNS-GS, PCA-extracted dietary patterns scores, energy intake physical activity, tobacco
571
status and for the history of chronic diseases.
Supplemental Table S3 Prospective association between quartiles of the organic score 573
and obesity risk, sensitive analysis, Nutrinet-Santé study, 2009-2015*. 574 Model Q1 Q2 Q3 Q4 P for trend Model 1† 1·00 0·87 (0·81, 0·94) 0·79 (0·73, 0·85) 0·52 (0·48, 0·57) <·0001 Model 2‡ 1·00 0·93 (0·87, 1·01) 0·91 (0·84, 0·98) 0·67 (0·61, 0·72) <·0001 Model 3§ 1·00 0·95 (0·88, 1·02) 0·92 (0·86, 0·99) 0·70 (0·64, 0·76) <·0001
*Obesity analyses were performed among participants who were not obese at inclusion 575
(N=56,806). Values are odds ratios (95% confident intervals), using 1st quartile Q1 as the
576
reference.
577
†Model 1 is adjusted for age and gender and propensity score. 578
‡Model 2 is model 1 further adjusted for month and year of inclusion, delay of follow-up, 579
occupation, marital status, education, monthly income per unit, dietary supplement use,
580
mPNNS-GS, PCA-extracted dietary patterns scores, energy intake physical activity and
581
tobacco status.
582
§Model 3 is model 2 further adjusted for the history of chronic diseases.
Figure 1. Participants of the NutriNet-Santé selected for the present analyses, 2009–2015 584
585 586
Figure 2. Prospective association between organic score in quartile and risk of obesity 587
stratified according the nutritional quality of the diet, Nutrinet-Santé, 2009-2015* 588
589
*Values are odds ratios (95% confident intervals) using the 1st quartile (Q1) as the reference, adjusted for age,
590
gender, month and year of inclusion, delay of follow-up, occupation, marital status, education, monthly income
591
per unit, dietary supplement use, mPNNS-GS, PCA-extracted dietary patterns scores energy intake, physical
592
activity, tobacco status andhistory of chronic diseases.
Table 1 Baseline characteristics of the sample across organic score quartiles, Nutrinet-Santé study, 2009-2014, N=62,224* 528
Q1 Q2 Q3 Q4 P†
N 15,245 16,249 15,807 14,923
Organic score max=32 0·73 (0·82) 4·96 (1·41) 10·36 (1·68) 19·15 (4·21) <0·0001
Female (%) 73·45 77·94 78·71 81·63 <0·0001
Age (years) 44·16 (15·34) 44·36 (14·83) 45·62 (14·29) 46·72 (13·29) <0·0001
Follow-up duration (days) 1140·34 (504·64) 1157·01 (500·06) 1144·88 (501·80) 1118·12 (499·69) <0·0001
Education (%) <0·0001
Unidentified 0·68 0·66 0·58 0·82
< high school diploma 23·68 20·09 17·21 15·22
High school diploma 19·12 17·01 15·44 13·99
Post-secondary graduate 56·52 62·24 66·76 69·97
Monthly income per unit household unit in € (%) <0·0001
Missing 12·06 11·50 10·62 9·35
900-1200 19·48 16·13 13·26 12·36
1200-1800 26·76 25·15 22·67 23·09
1800-2700 21·66 23·72 24·89 26·20
Occupational categories (%) <0·0001 Non employed 5·60 5·35 5·18 5·84 Retired 21·66 20·35 21·40 20·31 Employee/Manual worker 23·22 19·82 16·67 14·29 Intermediate profession 16·20 17·44 17·42 18·53 Managerial staff 17·82 21·47 25·48 28·26 Never employed 13·93 13·92 12·17 10·43
Craftsman, shopkeeper, business owner, farmer
1·58 1·66 1·68 2·34
Dietary supplement use (%) 35·52 45·55 51·58 62·13 <0·0001
Cohabiting (%) 80·89 81·88 83·22 86·32 <0·0001 Tobacco status (%) <0·0001 Former smoker 33·05 33·09 35·51 37·69 Current smoker 15·29 15·31 14·46 13·12 Never smoker 51·66 51·60 50·03 49·19 Physical activity (%) <0·0001 Missing 15·12 14·36 12·85 11·96 Low 15·12 14·36 12·85 11·96 Medium 27·65 27·92 30·04 31·9
High 33·67 37·15 38·33 39·5
Energy intake (kcal/d) 1942·90 (514·75) 1914·76 (487·92) 1908·50 (491·42) 1894·24 (474·50) <0·0001
% Carbohydrates 42·59 (6·89) 42·93 (6·81) 43·05 (6·94) 43·43 (7·11) <0·0001
% Lipids 39·22 (6·61) 38·95 (6·46) 38·96 (6·58) 39·45 (6·72) 0·0017
% Proteins 17·87 (3·95) 17·80 (3·92) 17·67 (4·01) 16·81 (3·92) <0·0001
Alcohol consumption (g/d) 8·65 (14·11) 8·27 (13·16) 8·22 (12·23) 7·63 (11·20) <0·0001
mPNNS-GS 7·60 (1·62) 7·87 (1·62) 8·15 (1·60) 8·44 (1·58) <0·0001
Body mass index (kg/m²) at baseline 24·50 (4·87) 23·96 (4·56) 23·71 (4·31) 23·00 (3·90) <0·0001
Obesity‡ (%) at baseline 11·79 9·42 7·96 5·58 <0·0001
Body mass index (kg/m²) at follow-up 24·72 (4·92) 24·17 (4·62) 23·91 (4·40) 23·13 (4·00) <0·0001
Obesity‡ (%) at follow-up 12·62 10·04 8·78 6·06 <0·0001
Abbreviations: Q; Quartile
529
*All variables were assessed at baseline, except when listed as “at follow-up” 530
†P for linear contrast 531
‡Body mass index ≥30 kg/m²