HAL Id: inserm-02908210
https://www.hal.inserm.fr/inserm-02908210
Submitted on 28 Jul 2020
HAL is a multi-disciplinary open access
archive for the deposit and dissemination of
sci-entific research documents, whether they are
pub-lished or not. The documents may come from
teaching and research institutions in France or
abroad, or from public or private research centers.
L’archive ouverte pluridisciplinaire HAL, est
destinée au dépôt et à la diffusion de documents
scientifiques de niveau recherche, publiés ou non,
émanant des établissements d’enseignement et de
recherche français ou étrangers, des laboratoires
publics ou privés.
with Treg accumulation in breast cancer patients
Nicolas Gonzalo Núñez, Jimena Tosello Boari, Rodrigo Nalio Ramos, Wilfrid
Richer, Nicolas Cagnard, Cyrill Anderfuhren, Leticia Niborski, Jeremy Bigot,
Didier Meseure, Philippe de la Rochere, et al.
To cite this version:
Nicolas Gonzalo Núñez, Jimena Tosello Boari, Rodrigo Nalio Ramos, Wilfrid Richer, Nicolas Cagnard,
et al.. Tumor invasion in draining lymph nodes is associated with Treg accumulation in breast cancer
patients. Nature Communications, Nature Publishing Group, 2020, 11 (1), pp.3272.
�10.1038/s41467-020-17046-2�. �inserm-02908210�
Tumor invasion in draining lymph nodes is
associated with Treg accumulation in breast
cancer patients
Nicolas Gonzalo Núñez
1,7,9
, Jimena Tosello Boari
1,9
, Rodrigo Nalio Ramos
1
, Wilfrid Richer
1
,
Nicolas Cagnard
2
, Cyrill Dimitri Anderfuhren
3
, Leticia Laura Niborski
1
, Jeremy Bigot
1
, Didier Meseure
4,5
,
Philippe De La Rochere
1
, Maud Milder
4,5
, Sophie Viel
1
, Delphine Loirat
1,5,6
, Louis Pérol
1
,
Anne Vincent-Salomon
4,5
, Xavier Sastre-Garau
4,8
, Becher Burkhard
3
, Christine Sedlik
1,5
,
Olivier Lantz
1,4,5
, Sebastian Amigorena
1,5
& Eliane Piaggio
1,5
✉
Tumor-draining lymph node (TDLN) invasion by metastatic cells in breast cancer correlates
with poor prognosis and is associated with local immunosuppression, which can be partly
mediated by regulatory T cells (Tregs). Here, we study Tregs from matched tumor-invaded
and non-invaded TDLNs, and breast tumors. We observe that Treg frequencies increase with
nodal invasion, and that Tregs express higher levels of co-inhibitory/stimulatory receptors
than effector cells. Also, while Tregs show conserved suppressive function in TDLN and
tumor, conventional T cells (Tconvs) in TDLNs proliferate and produce Th1-in
flammatory
cytokines, but are dysfunctional in the tumor. We describe a common transcriptomic
sig-nature shared by Tregs from tumors and nodes, including CD80, which is significantly
associated with poor patient survival. TCR RNA-sequencing analysis indicates trafficking
between TDLNs and tumors and ongoing Tconv/Treg conversion. Overall, TDLN Tregs are
functional and express a distinct pattern of druggable co-receptors, highlighting their
potential as targets for cancer immunotherapy.
https://doi.org/10.1038/s41467-020-17046-2
OPEN
1Institut Curie, PSL Research University, INSERM U932, F-75005 Paris, France.2Paris-Descartes Bioinformatics Platform, 75015 Paris, France.3Institute of
Experimental Immunology, University of Zurich, Winterthurerstr. 190, CH-8057 Zurich, Switzerland.4Institut Curie, PSL Research University, Departement
de Biologie des Tumeurs, F-75005 Paris, France.5Centre d’Investigation Clinique Biotherapie CICBT 1428, Institut Curie, Paris F-75005, France.6Institut
Curie, PSL Research University, Departement d’Oncologie Medicale, F-75005 Paris, France.7Present address: Institute of Experimental Immunology,
University of Zurich, Winterthurerstr. 190, CH-8057 Zurich, Switzerland.8Present address: Institut de Cancerologie de Lorraine Department of Biopathology,
6, avenue de Bourgogne CS 30519, 54519 Vandoeuvre-lès-Nancy cedex, France.9These authors contributed equally: Nicolas Gonzalo Núñez, Jimena Tosello.
✉email:eliane.piaggio@curie.fr
123456789
I
n human breast cancer, regional LNs are frequently the
first site
of metastasis. From a clinical standpoint, the tumor invasion of
tumor-draining LNs (TDLNs) is an important step in disease
progression, and is a prognostic indicator of the risk of recurrence
and of poor survival
1–3. However, recent clinical trials in breast
cancer indicate that LN resection does not increase the patients’
overall survival
4,5. From an immunologic standpoint, little is known
about the consequences of tumor metastasis on the LN’s immune
functions. However, it is clear that tumors develop a broad array of
immunosuppressant mechanisms. This fact raises the question of
whether the invasion of TDLNs during tumor spreading produces
an accumulation of immunosuppressive cells—like FOXP3+ CD4+
regulatory T cells (Tregs)—and imparts a tolerogenic
micro-environment
1,2,6,7. At present, most of our knowledge of the
immune status of breast cancer patients comes from the analysis of
primary tumor and blood samples, whereas data on the immune
characteristics of TDLNs are scarce
8–11.
Tregs expressing the transcription factor Foxp3 maintain
self-tolerance and homeostasis of immune system but also limit
sterilizing immunity and dampen antitumor immunity
12,13. In
breast cancer increased numbers of tumor-infiltrating Tregs
correlate with reduced survival
12,14,15. The balance between Tregs
and Tconvs largely defines the outcome of the immune response.
Tregs are highly heterogenous; they can arise in the thymus or
can emerge in the periphery from Tconvs. Furthermore, upon
activation, Tregs can acquire different phenotypes, associated to
different functions. Thus, based on the expression of some
che-mokine receptors and transcription factors, Tregs, similar to T
helper cells (Th) can be further classified in Tr1, Tr2, Tr17,
Tfr
13,16,17. Only a few studies have analyzed the phenotype
8,12and function of the Tregs present in the TDLNs of patients with
breast cancer
18, and the available data suggest that high
fre-quencies of total CD4+ T cells and low frefre-quencies of Tregs
18–20are associated with a good prognosis. However, a comprehensive
global analysis of the phenotype and function of Tregs in
tumor-invaded (I) TDLNs, non-tumor-invaded (NI) TDLNs, and primary
luminal breast cancer tumors (T) is still missing.
The immunotherapeutic blockade of immune checkpoints, such
as PD-1/PD-L1 and CTLA-4, has given impressive clinical results
and manageable safety profiles in various tumor types
21, 22. In
patients with breast cancer, one of the most encouraging
immu-notherapies is anti-PD-1/PD-L1 monotherapy; it achieves an
objective response rate of between 12 and 21%
23. However, a
CTLA-4-blocking antibody has shown only limited clinical
ben-efit
24. The expression pattern of immune checkpoints of Tregs and
Tconvs in luminal breast cancer has been poorly studied
12,25.
Thus, considering that checkpoint-blocking antibodies can act not
only during the effector T-cell phase in the tumor bed
26, but also
during T-cell priming in the TDLNs, it is important to understand
the immune status of the T cells (including Tregs), that can also be
targeted by these antibodies.
In the present study, we use high-dimensional
flow cytometry,
functional assays, T-cell receptor (TCR) repertoire analysis, and
RNA sequencing to characterize the immune phenotype, function
and dynamics of Tregs present in paired I and NI TDLNs, and
tumor; and identified CD80-expressing Tregs as a subset of Tregs
associated with bad prognosis in breast cancer patients. These data
bring insights into the immunomodulatory mechanisms associated
to the presence of the tumor, and should be instrumental to guide
the rationalized design of improved immunotherapies.
Results
“Bona fide” memory Treg cells accumulate in metastatic
TDLNs. We characterized and compared the immune profile of
Tregs from paired NI and I TDLNs from patients with breast
cancer. As reference, we also analyzed the Tconvs present in the
primary tumor, which have already been partly
character-ized
12,25,27. To this end, we immune profiled freshly resected NI
and I TDLNs and primary tumors from patients with luminal
breast cancer having undergone standard-of-care surgical
resec-tion (Fig.
1
a). The patients’ clinical and pathological data are
summarized in Supplementary Table 1.
TDLNs were classified as NI or I, based on the absence or
presence of metastatic tumor cells (identified as EPCAM+ and
CD45−). The flow cytometry results were confirmed by
pathologic assessment (Fig.
1
b, c). We evaluated the overall
distribution of the different immune cell populations in the three
tissues. Using an unsupervised data analysis (see methods), we
identified eight main clusters, including B cells, Tconvs, Tregs,
CD8+ T cells, no CD4+ CD8+ T cells, fibroblast/endothelial
cells, tumor cells, and other leukocytes (Fig.
1
d, e and
Supplementary Fig. 1b). All clusters were subsequently confirmed
by manual gating (Supplementary Fig. 1b–c). Quantification of
the different populations (Supplementary Fig. 1d–f and
Supple-mentary Table 2) indicated that the only population that
significantly changed between NI and I TDLNs was the Tregs
(Fig.
1
f). Although there is some heterogeneity within samples,
for 10 out of 14 patients the proportion of Tregs among total
CD45+ T cells was higher in the I TDLN, compared with the NI
one (p < 0.05). Also, we observed that in the primary tumor, Tregs
constitute an important proportion of the whole T-cell infiltrate,
reaching up to 19% of CD45+ cells.
We next analyzed the impact of nodal metastasis on the naïve/
memory phenotype of Tregs in the TDLNs. As reported by
Sakaguchi and colleagues
28,29, Tregs and Tconvs can be classified
based on the expression of CD45RA and FOXP3 as: (I) naive
Tregs, (II) effector Tregs (Eff Treg), (III) FOXP3+ non-Tregs
(recently activated Tconvs), (IV) memory Tconvs, and (V) naive
Tconvs (Fig.
2
a). We observed that I TDLNs contained higher
frequencies of Eff Tregs (p < 0.01), and lower proportions of naive
Tconvs (p < 0.05) than NI TDLNs, for most of the patients
studied. In the tumor, the CD4+ T-cell compartment was
characterized by very low proportions of naive cells and relatively
high proportions of Eff Tregs and memory Tconvs
12,30. These
results let us hypothesize that tumor cells in the TDLNs (i) may
be recognized by naive Tregs/Tconvs, which then acquire an Eff
Treg phenotype; and/or (ii) may be involved in the accumulation
of Eff Tregs that circulate from the tumor to the TDLNs.
Tregs in TDLNs show distinct immune checkpoint molecules.
Little information exists on the pattern of expression of druggable
immune checkpoint molecules on Tregs from TDLNs and tumor
of patients with breast cancer
12,25. Given that immune checkpoint
molecules were barely detected in naive T cells (Supplementary
Fig. 2a), we performed their analysis on the memory T-cell
compartment. Among the Tregs of the three tissues, a very high
frequency expressed the co-inhibitory receptors PD-1 and
CTLA-4 (Supplementary Fig. 2a–c) and the costimulatory receptors
ICOS and GITR (Fig.
2
d and Supplementary Fig. 2c); and a lower
fraction expressed OX40 (Fig. Supplementary Fig. 2c). Invasion of
TDLNs correlated with higher frequencies of Tregs expressing
ICOS, GITR, OX40, and PD-1, increased frequencies of Tregs
with double expression of PD-1 and ICOS (PD-1+ ICOS+ Tregs)
(accompanied by a decrease in the PD-1-ICOS− Tregs) (Fig.
2
e),
and no significant difference for CTLA-4 expression (always very
high) (Fig.
2
b–d and Supplementary Fig. 2c). In the tumor, even
higher frequencies of Tregs expressing each of the measured
checkpoints were observed (Fig.
2
b–d and Supplementary
Fig. 2c). These results suggest that in the presence of tumor cells,
higher proportion of Tregs get activated and express immune
checkpoints, and underscore that antibodies targeting these
molecules could act not only during the effector phase in the
tumor, but also during priming, in the TDLNs.
As T-cell subsets with opposed immune function can be
modulated by therapeutic Abs with agonistic, antagonistic, or
depleting functions, it is of interest to understand the differential
expression of positive and negative immune checkpoints on
effector Tconvs and CD8+ T cells, and on suppressive Tregs
(Supplementary Fig. 2A and 3). At all sites, Tregs were the most
prevalent T-cell subset population expressing costimulatory
CD8 CD4
EpCAM CD19 CD3
FOXP3
d
e
b
Gated on living cellsCD45-APC-Cy7
EPCAM-Percpe710
NI I
Tumor Cells Tumor Cells T 50 μm 50 μm 50 μm NI I T T T P P
c
Gated on living cells Gated on living cells CD45 Expression 1.00 0.75 0.50 0.25 0.00 NI I T NI I T 0.1 1 10 100 % among CD45+ cells Treg
*
**
*
a
Cluster 1 Cluster 2 Cluster 3 Cluster 4 Cluster 5 Cluster 6 80 60 40 20 0 Surgical resection (fresh material) Process 20 20 0 –20 20 20 0 0 –20 –20 –20 0 20 –20 0 20 20 0 –20 20 0 –20 20 0 –20 20 0 –20 20 0 –20 20 0 –20 20 0 –20 20 0 –20 20 0 –20 10 0 –10 tSNE2 tSNE2 –20 –20 –10 0 10 20 (I) Invaded LN Primary tumor (T) Non-invaded LN (NI) -Imaging -Functional test -TCRseq -Multicolor FACS -Single cell High-dimensional analysis and clustering identificationCell suspension
T cell cluster
-RNAseq
NI1Tcov NI2Tcov NI1Treg NI2Treg
TNFRSF11A SEMA7A CD8B CD8A CADM1 CD244 CXCR3 CCR1 FOXM1 IFNLR1 IRF9 IL18R1 IL15RA Tcells CD molecules Cell adhesion molecules Chem receptors Forkhead boxes Interferon receptors Interleukin receptors Interferon reg. factors
N = 14 B cells CD4+ Eff Treg CD4+ T conv CD8+ T cells Fibroblast/endotelial Other leucocytes Tumor cells No CD4+/CD8+ T cells
f
50 μmFig. 1 Overall distribution of immune cell populations in NI and I TDLNs, and tumor. a Flowchart of the study design. Non-invaded (NI) and invaded (I)
TDLNs, and the primary tumor (T) were collected and samples were split and processed for hematoxylin–eosin staining or for flow cytometry analysis,
functional tests or transcriptome and TCR sequencing.b A representativeflow cytometric analysis of EPCAM+ CD45+ cell populations in NI and I TDLNs
and primary tumors.c Representative hematoxylin–eosin staining of NI TDLNs (left panel), I TDLNs (middle panel), and primary tumors (right panel)
(P: peritumor area; T: tumor area; arrows: leukocytes) from one out of three independent experiments with similar results.d Samples were stained with
EpCAM, CD45, CD19, CD3, CD8, CD4, and FOXP3 and analyzed by FACS, and shown is a t-SNE map displaying randomly selected cells from TDLNs and
primary tumors.e t-SNE map showing the FlowSOM-guided clustering of NI, I, and T cells. Each color represents a cluster and is associated with a different
immune population.f Frequencies of Tregs among CD45+ cells in TDLNs and tumor (NI vs I TDLNs p = 0.0134; NI TDLN vs T p = 0.004; I TDLN vs T p =
(ICOS, GITR, and OX40) and co-inhibitory (PD-1, CTLA-4)
immune checkpoint molecules (Fig.
2
b–e and Supplementary
Fig. 2c–e). Also, Tregs showed the highest mean fluorescence
intensities (MFIs) values for ICOS, OX40, GITR, CTLA-4, and
PD-1 (Supplementary Fig. 2a). Tregs also expressed the highest
levels other Treg cell-associated molecules, such as Ki-67,
HELIOS, CD25, and CD39 (Supplementary Fig. 2a–b), which
could represent additional druggable targets. The higher CD39
expression in tumor and I LN Tregs than the NI LN counterparts
(Supplementary Fig. 2b), indicates that the presence of tumor
cells triggers the activation of Tregs and imprints a potential
higher suppressive function.
a
FOXP3-AF488
CD45RA-PE-Cy5
I=Naïve Treg II= Eff Treg III= FOXP3+ non-Treg IV= Memory T conv V= Naïve T conv I 2.1 II 1.9 III 8.4 IV 55 V 30.5 NI I Gated on CD4+ T cells I 2.2 II 3.6 III 9.6 IV 57 V 25.5 I 0.3 II 9.2 III 6.8 IV 80 V 2.1 T PD-1 NI I T NI I T NI I T 0 25 50 75 100 125
% among each fraction
0 25 50 75 100 125
% among each fraction
0 25 50 75 100 125
% among each fraction
Eff Treg Foxp3+ non-Treg Memory Tconv N = 14 * *** ** * *** *** ** ** *** CTLA-4 NI I T NI I T NI I T Eff Treg Foxp3+ non-Treg Memory Tconv N = 14 ** *** ** *** PD-1-BV711 NI I T Eff Treg FOXP3+ Non-Treg Memory Tconv MFI 2203 2405 2660 2063 2249 2745 2374 2757 2842 * * * * *
b
CTLA-4-PE NI I T Eff Treg FOXP3+ Non-Treg Memory Tconv MFI 1048 1008 1398 904 847 1348 949 854 1313 ** ** ** * ** **d
c
ICOS NI I T NI I T NI I T Eff Treg Foxp3+ non-Treg Memory Tconv * N = 14 * * *** * * FOXP3+ Non-Treg Memory Tconv ICOS-Percpe710 NI I T Eff Treg MFI 1148 1380 1433 819 892 1007 868 961 837 * *f
ICOS-Percpe710 PD-1-BV711 T I NI 32.9 1.7 34.0 31.4 57.3 0.9 26.6 15.3 82.7 3.8 8.3 5.2 NI I T NI I T NI I T NI I T 0 50 100 % among Tregs *ICOS-PD1+ ICOS+PD1+ ICOS+PD1– ICOS-PD1–
N = 14 * ** ** *** ** *
e
Gated on Eff TregICOS+PD1+ ICOS-PD1+ ICOS+PD1- ICOS-PD1-ICOS+PD1+ ICOS-PD1+ ICOS+PD1- ICOS-PD1-ICOS+PD1+ ICOS-PD1+ ICOS+PD1- ICOS-PD1-GITR ICOS OX40 CTLA-4 PD-1 NI I T CD8+ T cells Eff Treg Foxp3+ non-Treg Memory Tconv 0 2040 6080 Frequency Value NI I T NI I T NI I T NI I T NI I T NI I T NI I T NI I T NI I T 0.1 1 10 100 % among CD4+ T cells **
Naive Treg Eff Treg Foxp3+
Non-Treg Memory Tconv Naïve Tconv N=14 *** *** *** ** * *** ***
Tregs in TDLN and tumor have conserved suppressive
func-tion. Tregs can show an unstable phenotype and lose their
sup-pressive function in pro-inflammatory microenvironments
31,32.
We evaluated whether NI, I TDLNs and tumor, represent pro- or
antiinflammatory microenvironments in which Tregs exert their
functions. Ex vivo whole-cell suspensions from the three tissues
were stimulated and T-cell proliferation was analyzed. As shown
in Fig.
3
a, Tconvs from NI and I TDLNs highly proliferated;
however, Tconvs from the tumor stopped dividing after a few
cycles. Upon phorbol 12-myristate 13-acetate (PMA)-ionomycin
stimulation, the frequency of IFN-γ+ Tconvs was significantly
higher in I versus NI TDLNs (Fig.
3
b), and only a small fraction
of all the T cell produced IL-17A. To assess whether Tregs from I
TDLN -where Tconvs are more pro-inflammatory- maintain
their suppressive function, we performed classical suppression
tests. Tregs from both I TDLNs and the tumor had similarly
proficient suppressor functions (Fig.
3
c).
Overall, these results indicate that: (i) Tregs from both TDLNs
and the tumor had conserved ex vivo suppressor functions, and
(ii) that although Tconvs from I TDLNs readily produce
pro-inflammatory cytokines, the Tregs there do not, indicating that
they did not acquire pro-inflammatory function in invaded breast
cancer LNs.
I TDLNs show higher proportions of Tr1 and Tfr cells.
Pub-lished transcriptomic signatures of Tregs from different tissues
indicate that Tregs constitute a heterogeneous population shaped
by microenvironmental cues
12,25,33. Indeed, the role of cytokines
and chemokines present in the microenvironment influences the
terminal differentiation of tumor-specific Tconvs with different
polarization patterns, functional specialization, and migration
capacities. In addition, mouse studies have suggested that Tregs
may also co-opt transcriptional programs adapted to regulate
Th1, Th2, or Th17 responses
13,16,17.
To assess the functional diversity of Tconvs and Tregs present in
both I and NI TDLNs, we analyzed CD4+ T-cell chemokine
receptors pattern (as described in
16,34). We
first evaluated the
phenotype of Tconvs (CD4+ CD127+ CD25−) as Th1 (CXCR3+),
Th2 (CXCR3−CCR6−CCR4+), Th17 (CXCR3−CCR6+CCR4+
CCR10−), Th22 (CXCR3−CCR6+CCR4+CCR10+), and T
folli-cular helper cells (Tfh, PD-1
highCXCR5+) (Fig.
4
a). Among Tconvs
(Fig.
4
b), Th1 cells were the most abundant population. Compared
with NI TDLNs, I ones showed higher proportions of Th1 (p < 0.01)
and Tfh cells (p < 0.05), and lower proportions of Th22 cells (p <
0.05). Around 10% of Tconvs were Th2 cells (with no differences
between NI and I TDLNs) and very few of them expressed CRTh2,
a marker of a subset of lineage-committed Th2 cells
34. Finally, Th17
cell proportions were similar in NI and I TDLNs (Fig.
4
b).
We observed that Tregs from TDLNs followed a similar
chemokine receptor pattern as Tconvs. And also, similar to
Tconvs, compared with NI TDLNs, in I TDLNs there were
significant higher proportions of Th1-like Tregs (p < 0.05),
Th22-like Tregs (p < 0.05) and Tfh-Th22-like Tregs (Tfr) (p < 0.05),
respectively. Similar frequencies of Th2-like Tregs and
Th17-like Tregs were found in NI and I TDLNs (Fig.
4
c). The strikingly
similar pattern of helper Tconv and helper-like Treg phenotype
was reflected by a strong positive correlation of the frequencies of
Th1 vs Th1-like (r
2= 0.23; p = 0.008), Th2 vs Th2-like (r
2= 0.36;
p
= 0.0005), Th22 vs Th22-like (r
2= 0.41; p = 0.007), and Tfh vs
Tfr (r
2= 0.92; p < 0.0001) populations; but not of Th17 vs
Th17-like (r
2= 0.08; p = 0.23) (Fig.
4
d). The permeabilization step
required for FOXP3 staining is not compatible with labeling of
chemokine receptors, except for CXCR3 and CCR4. We further
studied the expression of these two receptors in the CD4+ T-cell
subsets as described in Fig.
2
a. We observed that the frequency of
CXCR3+ cells was significantly increased among Eff Tregs
(57.9% vs 67.5%, P < 0.01), FOXP3+ non-Tregs (38.9% vs 47%,
P < 0.01) and memory Tconvs (42.3% vs 53.5%, P < 0.01) from
the I compared with NI TDLNs (Supplementary Fig. 4a) and we
observed similar frequencies of CCR4+ CD4+ T-cell
subpopula-tions in I vs NI TDLNs (Supplementary Fig. 4b). We analyzed the
expression of T-bet and GATA3, two canonical molecules
associated with Th1-like and Th2-like functions, respectively
(Supplementary Fig. 4c–d). In I TDLNs we observed the
frequency of T-bet+ Tregs was higher and the frequency of
GATA3+ Tregs was lower compared with NI TDLNs. These
results suggest that nodal invasion by the tumor induces a
Th1-biased phenotype of Treg cells, and point to a shared migrational
imprinting program with effector (Th1) Tconvs, like previously
described
16,34.
In all, Tconvs and Tregs from TDLNs follow similar
phenotypic and functional specific programs, reinforcing the
concept that the ability of Tregs to maintain local immune
homeostasis depends on their appropriate colocalization with
Tconvs.
Tregs with shared TCRs are found in TDLNs and tumors. The
TCR repertoire has been used to explore the clonal diversity and
trafficking patterns among TDLNs and tumor of total T cells
35.
To go deeper in CD4+ T cells subsets, we performed
high-throughput sequencing of the TCR-β CDR3s of Tregs
(CD25
highCD45RA−) and Tconvs (CD25−CD45RA−) (see
methods) obtained from the NI and I TDLNs for
five patients and
from primary tumors for three of these patients (the distribution
of the sequenced TCR-β CDR3s for the entire set of samples
are summarized in Supplementary Table 3). The cumulative
Fig. 2 Naive/memory phenotype and immune checkpoint expression of T cells in TDLNs, and tumor. Cell suspensions of TDLNs cells and tumors were
stained for CD3, CD4, CD8, CD45RA, FOXP3, PD-1, CTLA-4, and ICOS.a Representativeflow cytometric analysis (left panel) and frequency (right panel)
of cells distinctively expressing CD45RA and/or FOXP3 among CD4+ T cells in TDLNs and tumor (Naive Treg: NI TDLN vs T p = 0.0023; I TDLN vs T p =
0.0004; Eff Treg: NI vs I TDLNsp = 0.0017; NI TDLN vs T p = 0.0004; I TDLN vs T p = 0.0009; naive Tconv: NI vs I TDLNs p = 0.0494; NI TDLN vs T
p = 0.0002; I TDLN vs T p = 0.0001). Wilcoxon matched-pairs signed rank test. b–d Representative histograms and frequencies of b PD-1 (memory
Tconv: NI vs I TDLNsp = 0.0436; NI TDLN vs T p = 0.0009; I TDLN vs T p = 0.0012; Foxp3+ non-Treg: NI vs I TDLNs p = 0.0203; NI TDLN vs T p =
0.0001; I TDLN vs Tp = 0.0002; Eff Treg: NI vs I TDLNs p = 0.0031; NI TDLN vs T p = 0.0002; I TDLN vs T p = 0.0017), c CTLA-4 (memory Tconv: NI
TDLN vs Tp = 0.0023; I TDLN vs T p = 0.0004; Foxp3+ non-Treg: NI TDLN vs T p = 0.0031; I TDLN vs T p = 0.0004) and d ICOS (memory Tconv: NI vs
I TDLNsp = 0.0107; FOXP3+ non-Treg: NI vs I TDLNs p = 0.0295; NI TDLN vs T p = 0.0009; I TDLN vs T p = 0.0245; Eff Treg: NI vs I TDLNs p = 0.0101;
NI TDLN vs Tp = 0.0436) expression among the indicated CD4+ T cell subpopulations. Wilcoxon matched-pairs signed rank test. e Representative flow
cytometric analysis (upper panel) and frequency (lower panel) of ICOS and/or PD-1 among Eff Tregs (ICOS-PD-1+: NI TDLN vs T p = 0.0031; I TDLN vs T
p = 0.0022; ICOS + PD-1+: NI vs I TDLNs p = 0.0215; NI TDLN vs T p = 0.0245; ICOS + PD-1-: NI TDLN vs T p = 0.0134; ICOS-PD-1-: NI vs I TDLNs p =
0.0023; NI TDLN vs Tp = 0.0006). Wilcoxon matched-pairs signed rank test. f Heatmap displaying the frequency of expression of OX40, GITR, ICOS,
CTLA-4, and PD-1 on the indicated T-cell subpopulations in TDLNs and tumor (N = 12). Red and blue indicate higher and lower expression frequencies,
b
Ratio memory Tconv : Eff Treg
c
Ratio memory T Conv: Eff Treg
Eff Treg I Eff Treg T 1:1 2:1 4:1 8:1 16:1 32:1 CFSE T I 10.0 100 80 Modal 60 40 20 0 100 80 Modal 60 40 20 0 100 80 Modal 60 40 20 0 100 80 Modal 60 40 20 0 100 80 Modal 60 40 20 0 100 80 Modal 60 40 20 0 100 80 Modal 60 40 20 0 100 80 Modal 60 40 20 0 100 80 Modal 60 40 20 0 100 80 Modal 60 40 20 0 0102 103 104 105 0102 103 104 105 0102 103 104 105 0102 103 104 105 0102 103 104 105 0102 103 104 105 0102 103 104 105 0102 103 104 105 0102 103 104 105 0102 103 104 105 0102 103 104 105 0102 103 104 105 28.0 49.0 58.2 59.8 62.6 13.0 24.7 41.7 51.0 59.7 59.2 Proliferation index CFSE Gated on CD4+ T cells NI I T NI I T 0 100 0.8 0.6 0.4 0.2 0.0 0 10 20 30 40 200 300 400 Division inde x CD4+ T cells *
*
NI = 13 I = 14 T = 10a
IFNγ−V450 IL-17-BV71 1 28 2.2 0.5 9 Eff Treg Memory Tconv 0.3 0 Iso NI I NI I 0 20 40 60 % ofIFN-γ+ among each fraction
** Eff Treg N = 11 Memory Tconv IFNγ NI I NI I 0 5 10 15 20
% of IL-17A+ among each fraction
N = 11 IL-17A Eff Treg Memory Tconv 100 80 60 40 20 0 100 80 60 40 20 0
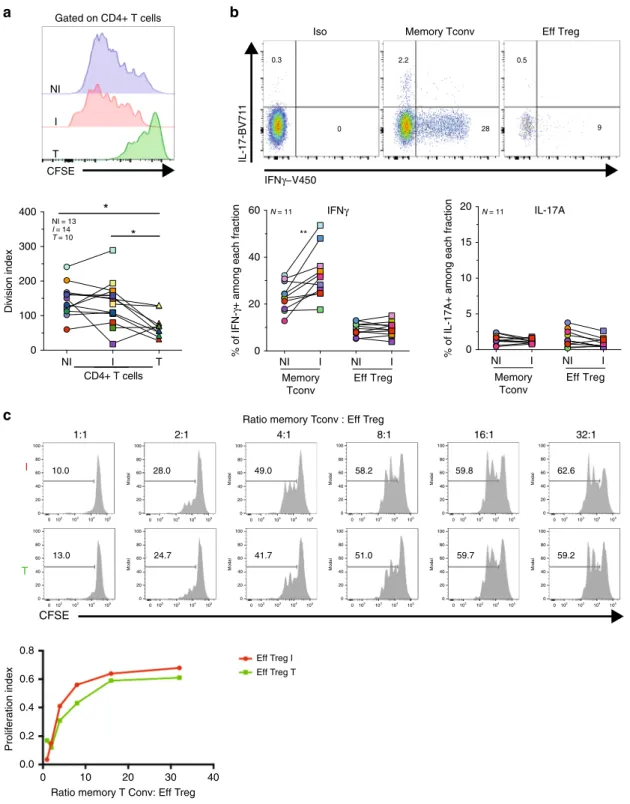
Fig. 3 Analysis of CD4+ Tconv and Treg function in TDLNs. Axillary TDLNs cells and tumors were stained with CFSE, ex vivo stimulated with anti-CD3/
CD28 beads for 96 h, and stained with CD3, CD4, CD8, and FOXP3.a Representative histograms showing CFSE dilution (left panels) and the division
index (right panels) of CD4+ T cells in TDLNs and tumor (p = 0.0156 NI TDLN vs T; p = 0.0273 I TDLN vs T). Wilcoxon matched-pairs signed rank test.
b Cell suspensions of TDLNs were ex vivo stimulated with PMA/Ionomycin for 4 h and stained for CD3, CD4, IFN-g, and IL-17A. Shown is a representative flow cytometric analysis (upper panel) and frequency (lower panel) of IFN-γ and IL-17 among gated CD4+ T cell subpopulations from TDLN (p = 0.0029
NI vs I TDLNs).c Evaluation of the suppression of autologous memory Tconv (CD4+ CD25−) proliferation by Tregs (CD4+ CD25high) sorted from
fresh I TDLNs (I) and the corresponding primary tumor (T). Cells were cultured for 4 days in the presence of anti-CD3/CD28 beads. Histograms show the CFSE dilution (upper panel) and proliferation index of Tconvs in the presence or absence of Tregs at the indicated ratios (lower panel).
Representative histograms (N = 1) from one out of two independent experiments with similar results. Wilcoxon matched-pairs signed rank test, *p < 0.05,
frequency of TCR-β CDR3s in each sample (Fig.
5
a, c and
Sup-plementary Fig. 5a and 5c–d), indicates that Tregs were more
clonally expanded than Tconvs in all tissues; and that the TCR
repertoire of Tregs and Tconvs were less diverse in the tumor
than in the TDLNs, suggesting an accumulation of tumor-specific
CD4+ T cells in the tumor. Next, to analyze the TCR repertoire
overlap among the three different tissues, for two patients we
could identify the top 100 most expanded CDR3s of the Tregs or
Tconvs present in the tumor (likely enriched in tumor-specific
clones) and study their distribution in the NI and I TDLNs
(Fig.
5
b, d and Supplementary Fig. 5b). For Tconvs in each
patient, 10.5% and 4.5% out of the 100 top tumor clones were
found in the I TDLNs, and 1% and 3.4% of the 100 top tumor
clones were observed in the NI TDLN (Fig.
5
b). For Tregs, 1.9%
and 17.5% of the top 100 tumor clones were observed in the I
TDLN and 2.6% and 1.6% of the 100 top tumor clones were
observed in the NI TDLN (Fig.
5
d). These results suggest that
tumor-specific Tconvs and Tregs clones recirculate between the
tumor and the TDLNs.
Tumor-specific Tregs can originate in the thymus (tTreg) or
they can arise from conversion of Tconvs into
“peripheral-induced” Treg, (pTreg)
36,37.Peripheral Treg induction in TDLNs
has been demonstrated in mouse models
38but it has been poorly
studied in humans
12,25. To assess the pTregs presence, we
evaluated the TCR repertoire overlap between Tregs and Tconvs.
This analysis revealed that Tconvs and Tregs with shared TCRs
Correlation Tfh Tfh-like 0.0 0.5 1.0 1.5 2.0 2.5 0 5 10 15
Tfh-like among Treg
Tfh among Tconv Correlation Th22-Th22-like 0.0 0.2 0.4 0.6 0.8 0.0 0.5 1.0 1.5 2.0
Th22-like among Treg
Th22 among Tconv Correlation Th17-Th17-like 0 1 2 3 4 5 0 2 4 6
Th17-like among Treg
Th17 among Tconv Correlation Th2-Th2-like 0 10 20 30 0 5 10 15 20 25
Th2-like among Treg
Th2 among Tconv Correlation Th1-Th1-like 0 20 40 60 0 20 40 60 80 p = 0.005 r2 = 0.37 p = 0.005 r2 = 0.36 p = 0.23 r2 = 0.082 p = 0.007 r2 = 0.35 p = < 0.0001 r2 = 0.92
Th1-like among Treg
Th1 among Tconv
a
b
c
d
Tfh CCR6-BV605 CXCR5-APC PD1-BV711 Tfh-CXCR3-PE-CF594 CCR10-PE CCR4-PE-Cy7 Gated on CCR6-CXCR3-CRTH2-FITC CCR4-PE-Cy7 Gated on CCR6+CXCR3-Gated on Tconv/Treg Th22 Th17 Th2 Gated on TFH-Th1 0.01 0.10 1 10 100**
*
*
Th1 Th2 Th17 Th22 Tfh Non-polarize Tconv*
% among total T conv
0.01 NI l NI l NI l NI l NI l NI l NI l NI l NI l NI l NI l NI l 0.10 1 10 100 Treg
% among total Treg
*
*
*
Th1-like Th2-like Th17-like Th22-like Tfh-like Non-polarize
CD25-APC-Cy7
CD127-BV650
Tconv
Treg Gated on CD4+ T cells
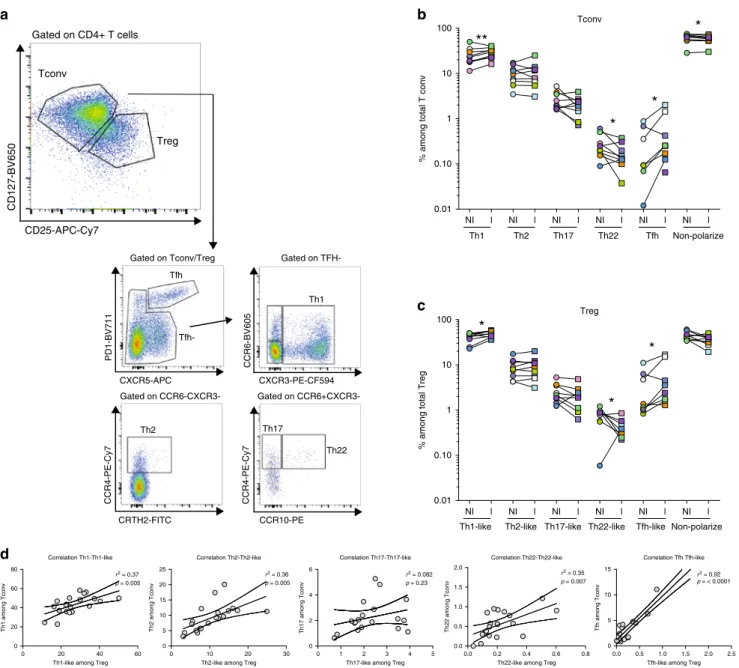
Fig. 4 CD4+ T-cell chemokine receptor patterns in TDLNs. Cell suspensions of TDLNs cells were stained for CD3, CD4, CD127, CD25, PD-1, CXCR5,
CCR6, CXCR3, CCR4, CCR10, and CRTH2.a Representativeflow cytometric analysis of CD4+ T-cell phenotype among gated CD4+ CD127+ CD25−
(Tconv) or CD4+ CD127lowCD25hi(Treg) cells in TDLNs.b, c Frequency of cells expressing the indicated chemokine receptor combinations among
b Tconv (Th1:p = 0.0078; Th22: p = 0.0371; Tfh: p = 0.0391; non-polarized: 0.0371in NI vs I TDLNs) and c Tregs (Th1-like: p = 0.0195; Th22-like: p =
0.0391; Tfh-like:p = 0.0312) in TDLNs. Wilcoxon matched-pairs signed rank test (n = 10) d Scatter plots and linear regression graphs of the correlation
between the frequency of Th1 vs Th1-like, Th2 vs Th2-like, Th17 vs Th17-like, Th22 vs Th22-like, and Tfh and Tfr populations. *P < 0.05; **P < 0.01 in TDLNs
(n = 20). The statistical significance of the correlation was determined using the Pearson’s correlation. Non-polarized: CD4+ T cells negative for the
were present within every tissue, with a mean of 17.6% of the total
Treg TCRs shared with the Tconvs in NI TDLNs, 14.3% in I
TDLNs, and 21.7% in tumors (Fig.
5
e and Supplementary
Table 4). Moreover, tumor-Treg clonotypes were shared in an
inter-tissue fashion with Tconvs, as 16.9% and 21.9% of the
tumor-Treg clonotypes were also found within Tconvs present in
NI and I TDLNs, respectively (Fig.
5
f). These data uncover that a
sizable proportion of Tregs in breast tumors are pTregs; however,
do not allow concluding whether conversion occurs in one given
organ or whether pTregs recirculate among the TDLNs and
the tumor.
Tregs from I TDLNs display unique transcriptomic features.
We performed RNA sequencing of bulk sorted Tregs and Tconvs
obtained from matched NI, I TDLNs, and tumors (see methods).
We observed 2985, 868, and 1800 differentially expressed genes
(DEGs, fold change 1.2, p < 0.05) between Tregs and Tconvs in NI
TDLNs, I TDLNs, and tumors, respectively (Fig.
6
a,
Supple-mentary Data 1). Pathway analysis of these three lists of DEGs
identified a series of canonical biological pathways (Fig.
6
b and
Supplementary Data 2). Among the top
five canonical pathways,
NI and I TDLNs shared Th1 and Th2 activation/polarization
pathways and the
“T-cell exhaustion signaling pathway”,
indi-cating chronic activation and polarization as main characteristics
of the CD4+ T cells in TDLNs. Differently, tumor CD4+ T cells
were principally associated with translational regulation
(“Reg-ulation of eIF4 and p70S6K Signaling” pathway), activation of the
Inositol phosphate pathway, and signaling mediated by
glu-corticoids; highlighting intrinsic differences with the lymph node
residing cells.
Then, we studied the molecular features shared by Treg and
Tconv (“common signature”) analyzing the DEGs common
between Tregs and Tconvs from all tissues; and to investigate
tissue adaptation, we used the lists of DEGs uniquely expressed
by Tregs or Tconvs of each tissue. The
“common Treg
signature” consisted of 121 genes (commonly upregulated
in the Treg/Tconv comparison of the three tissues,
“UUU” genes
in the Venn diagram of Fig.
6
a), included FOXP3, IL2RA,
TNFRSF9, TNFRSF1B, and ENTPD1 (Fig.
6
c), and was
sig-nificantly associated with “Regulatory T cells” and “IL-2 signaling
a
NI I T 0 20 40 60 80 100 1 10.5 100b
Memory CD4+ T conv Memory CD4+ T conv
I NI T 0 10 100 I NI T NI I T 3.4 4.5 100 Percentage 0 10 100 Percentage 0 10 100 Percentage Patient 1 Patient 2 Percentage 0 20 40 60 80 100 Percentage 0 20 40 60 80 100 Percentage 0 20 40 60 80 100 Percentage Patient 1 Patient 2
e
c
d
NI I T 2.6 1.9 100 NI I T 1.6 17.5 100 Number of clones 10 100 Number of clones 10 100 Number of clones 10 100 Number of clones 10 100 0 10 100Eff Treg Eff Treg
I NI T I NI T Percentage Patient 1 Patient 2 Patient 1 Patient 2
f
NI I T 0 10 20 30 40 % of shared TCR between Tregs/TconvsT-Tregs vs. NI-Tconv T-Tregs vs. I-Tconv 0 10 20 30 % of shared TCR between Tregs/Tconvs
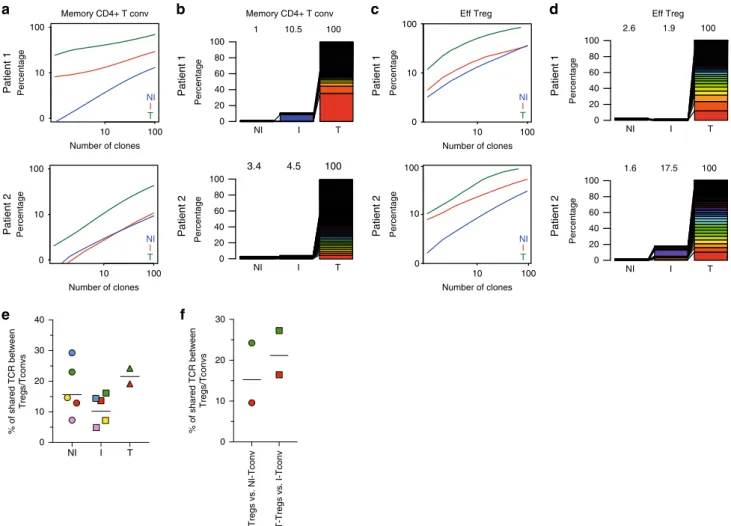
Fig. 5 Analysis of the TCR repertoire of CD4+ Tconvs and Tregs from NI and I TDLNs, and tumor. Next-generation sequencing-based high-throughput
TCR-β CDR3 analysis of bulk sorted T-memory CD4+ Tconvs and Tregs from matched NI and I TDLNs and the primary tumor. Graphs a–d display the
TCR-β CDR3 clones of memory CD4+ Tconv a, b; or effector Tregs c, d. Graphs a, c show cumulative frequencies of from NI TDLNs (blue), I TDLNs (red),
and the corresponding primary tumor (green), for two representative patients. Stacked bar chartb, d depict the usage frequencies of the top 100 tumor
TCR-β CDR3 sequences and their distribution in matched NI and I TDLNs for two representative patients. Numbers in the graphs indicate percentage of
shown TCR-β CDR3 sequences out of total TCR-β CDR3 sequences in the sample. e, f TCR repertoire overlap between Tregs and Tconvs. e Shown is the
number (%) of unique TCRs shared between Tregs and Tconvs among all Treg clones in TDLN (N = 5) and tumor (N = 2). f Shown is the number (%) of
unique TCRs shared between all tumor Tregs and Tconvs present in the NI or I TDLNs (N = 2). Each symbol is a sample, and samples from the same
pathways” as well as “TNFR2 signaling pathway” (EnrichR, #1,
Supplementary Data 3). The
“common Tconv signature” was
defined by 70 genes (“DDD” genes) including IL7R, CD40LG, and
IL2 (Fig.
6
c), and was significantly associated with “CD4+
T cells”, “FAS signaling pathway” as well as “TRAIL signaling
pathway” Fig.
6
c (EnrichR, #2, Supplementary Data 3). Analysis
of molecular signatures associated to each tissue revealed specific
programs: (i) Tregs from NI TDLN were characterized by 965
genes (“U” genes), contributing to the “Antigen processing and
presentation of exogenous peptide” and “DNA replication”
3-phosphoinositide biosynthesis Regulation of eIF4 and p70S6K signaling Superpathway of inositol phosphate compounds Glucocorticoid receptor signaling Role of macroph, fibroblasts and endothelial cells in rheumatoid arthritis
–log(p-value) T (1800)
a
c
Huntington's disease signaling 0 5 10 15 0 0 2 4 6 8 10 5 10 15 T cell exhaustion signaling pathway Th2 pathway Th1 and Th2 Activation pathway Molecular mechanisms of cancer NI (2985) T cell exhaustion signaling pathway Th1 pathway T helper cell differentiation Th2 pathway Th1 and Th2 activation pathway I (868)b
Ingenuity canonical pathwaysPositive z-score z-score = 0 Negative z-score No activity pattern available
d
Shared by 3 tissues
NI I T
NI1Treg NI2 NI2Tcov
T reg NI1Tc o v NI1 T reg NI2 T reg NI1Tc o v NI2Tc ov NI1 Tr e g NI2 T reg NI1Tc o v NI2Tc o v SIGLEC17P SLAMF1 CCR8 CX3CR1 NTRK1 HAPLN3 NCR3 CCDC141 HAVCR2 (TIM3) TTN IL1R2 IL2RA IL1R1 IL2RB CD177 F5 TRAV34 CSF2RB SELP RAB33A RTKN2 ENTPD1 CEP55 F LVCR2 CD74 PMCH LTA UTS2 CD70 F OXP3 TNFRSF13B TNFRSF8 TNFRSF4 TNFRSF9 TNFRSF18 TNFRSF1B CD226 IL7R IL2 SLC39A8 L PAR6 SERINC5 PTPN13 CTSL LTB4R KLRB1 TGFBI TNFSF8 CD40LG TNFRSF10D Tcells Cell adhesion Chemokine receptors Ig superfamily Interleukin receptors Plasma membrane Receptor ligands Transcrition regulator TNFR superfamily Ig superfamily Interleukin receptors Interleukins Plasma membrane Receptor ligands TNFR superfamily (GITR) (41BB) (OX40) (CD39)
Specific to each tissue Tcells Tconv Treg NI1 T reg NI2 T reg NI1Tc o v NI2Tc o v CD33 PCDH1 JAM2 CDHR3 ITGA3 CCL20 CCR3 SEMA3G FCRL1 PTGFRN HLA DQB2 MICB FCMR IL10RA DDR1 ANXA2 PTPRJ CD151 CD63 PARK7 LSP1 PPP4C RFTN1 GAPDH LGALS3 LGALS1 CALM3 CFLAR PSAP TRAF4 CD40 CD47 ALCAM ITGA10 CXCR5 MALT1 LRRN3 SEMA4D OBSCN IL11RA RAP1B PTK2B FYN NFKBIA SLC38A1 PRKCH IKZF3 SLC44A1 ACE TNFSF11 Tcells NI1 Tr e g NI2 T reg NI1Tc o v NI2Tc o v CADM1 CCR1 CXCR3 CD300LD SEMA7A IFNLR1 IRF9 IL15RA IL18R1 APOBEC3H CDC25C CDK1 EXO1 FOSL2 GLI3 HERPUD1 HIST4H4 MAPK8IP3 PM20D1 PTMS RCAN2 TOB2 TP73 CASP3 MLKL NBEAL2 NEDD9 NPC1 RAB24 SLC38A5 SLC41A1 SLC5A3 SEMA4A TNFRSF11A SPEG ACTN1 HIST1H1E PELI2 CEP170 CUBN KCNQ1 LZTS3 MYO16 PAK3 RPL36A SLC16A6 TCAF1 TGFA TRPC1 ZBTB33 Tcells Cell adhesion Chemokine ligand Interleukin receptors Plasma membrane Receptor ligands TNFR superfamily Plasma membrane Receptor ligands Chemokine receptors Ig superfamily Cell adhesion Chemokine receptors Ig superfamily NI I T Interleukin receptors Cell adhesion Interleukin receptors Others TNFR superfamily Plasma membrane Ig superfamily Ig superfamily TNFR associated factors NI1 T reg NI2 Tr e g NI1Tc o v NI2Tc o v CEACAM6 BTNL8 FLT1 PTPRT IL1RL1 IL1RN CLEC7A PARD6G PLCD3 PHACTR2 CLDN3 GRN CST3 ATP6V1E1 SDF4 HM13 CTNNB1 ECE1 ATRAID WDR1 JTB CGA WNT3 AGT EFNA3 TRAF3 TRAF2 ITGAL L1CAM SLAMF6 ITGAE ITGB7 GPA33 JAML XCL1 CCR2 CCR7 LRIG2 FGFR1 FCER1A IL17RA IL18RAP IL16 IL21 BMPR1A HMGB1 TGFB1 RGS2 TNFSF14 FASLG Tcells Cell adhesion Interleukin receptors Plasma membrane Receptor ligands TNFR-associated factors Plasma membrane Receptor ligands Ig superfamily Cell adhesion Chemokine ligands Ig superfamily Interleukin receptors Chemokine receptors Interleukins Chemokine Ligand IFN receptors IFN regulatory factors
Plasma membrane Others Tcells Tconv Treg –2 –1 012 –2 –1 012 –2 –1 012 –2 –1 012 –2 –1 012 –2 –1 012
Treg : Tconv DEGs
T (1800) NI (2985) U D U D U D U D U UU U D D D D U
U
U 465
549
D
965
932
D
U UU UD D U U U D DD D U U D D U U U D DD D U U U D D D D U D U D I (868)286
1897
1014
344 196 548 42 c(234) c(121) c(17) c(17) c(7) c(4) c(1) c(1) c(70) c(183) c(10) c(14) c(341) c(4) c(1) c(105)U 153
133
D
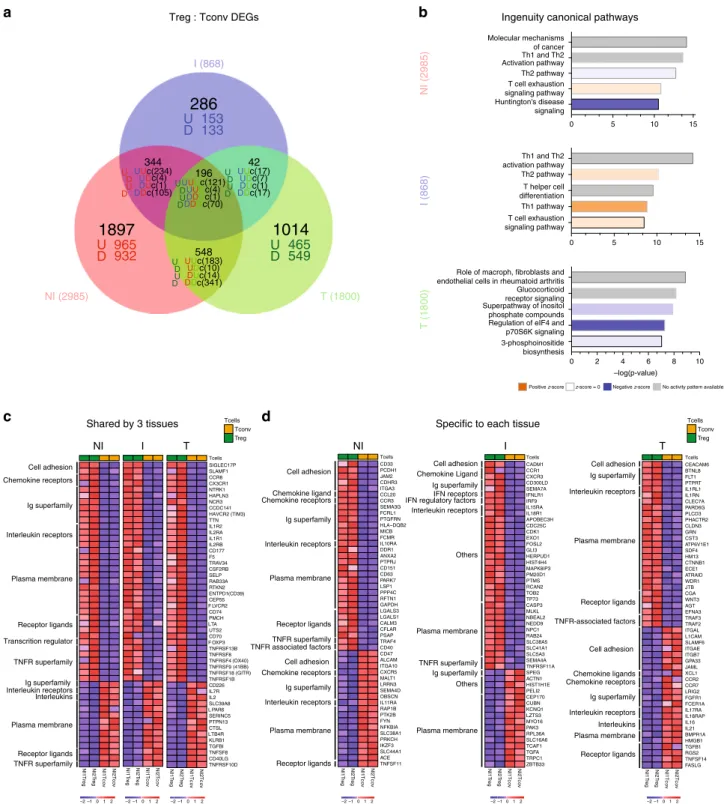
Fig. 6 Transcriptional analysis of CD4+ Tconvs and Tregs from NI and I TDLNs, and tumor. RNA-sequencing analysis of bulk sorted T-memory CD4+
Tconvs and Tregs from matched NI and I TDLNs and the primary tumor.a Venn diagram and b pathway analysis of differentially expressed genes (DEG,
fold change 1.2,p < 0.05) between Tregs and Tconvs in NI TDLNs, I TDLNs and tumors. c, d Heatmaps showing 50 DEGs common to Treg and Tconvs
from the three tissuesc or specific to each tissue d. Red and blue indicate higher and lower expression, respectively. Family gene names are indicated (left).
Cell adhesion: cell adhesion molecules. Ig superfamily: immunoglobulin superfamily domain containing. TNFR receptor superfamily: tumor necrosis factor receptor superfamily. TNFR-associated factors: tumor necrosis factor receptor-associated factors. IFN receptors: interferon receptors. IFN regulatory factors: interferon regulatory factors.
(EnrichR #3, Supplementary Data 3), reflecting basal replication
of Tregs in the LNs; (ii) Tregs from I TDLN were characterized
by barely 153 genes (“U” genes), associated to the biological
pathways:
“apoptosis”, “IL-12-mediated signaling events”, and
Type III IFN signaling (EnrichR #4, Supplementary Data 3), likely
reflecting Treg expansion and contraction in response to the local
production of pro-inflammatory signals like IL-12 and IFNs; (iii)
tumor Tregs uniquely displayed 465 genes (“U” genes)
participat-ing to a heterogeneous transcriptomic program comprisparticipat-ing the
pathways
“Oxidative phosphorylation”, “TNFR2 signaling”, and
“4-1BB signaling” (EnrichR #5, Supplementary Data 3), pointing
out to a differential metabolic state in the tumor and signaling
through TNFR2 and 4-1BB, previously associated to activated
Tregs in the tumor
39,40. Of note, tumor Tregs highly expressed
IL1RL1 and IL1RN, which have been associated to inhibition of
IL-1-mediated inflammation
41,42. These results suggest that Tregs
from the tumor and the TDLNs express a common gene
signature, but also exhibit distinct transcriptional cell fates
underlying tissue-specific adaptation. Fig.
6
c, d shows the
expression levels of characteristic markers of Tconvs and Tregs
cells selected by their influence on T-cell migration, function, or
target potential. For example, CCR8 is characteristic of Tregs
across tissues (as previously described
12), but other cell adhesion
molecules and chemokine receptors are differentially associated
to Tregs and Tconvs from the different tissues (Fig.
6
d). In more
detail, SIGLEC17P expression could be used by Tregs to circulate
among all tissues; CD33, PCDH1, JAM2, CDHR3, and ITGA3
would orchestrate migration/retention in NI TDLNs; CADM1 in I
TDLNS; and CEACAM6 in tumor. Of note, CEACAM6 expressed
by tumor Tregs, has been associated with cancer progression
43.
Also, Tregs from NI ad I TDLN share CD58, ITGAM, MCAM,
CEACAM4, SELPLG, and HMMR expression, which could ensure
recirculation among TDNLs; and Tregs from I TDLN and tumor
Tregs share ICAM1 expression, which could be responsible for
the migration among tissues with presence of tumor cells. Finally,
Tconvs from the tumor differentially expressed higher levels of
IGAL (LFA-1) than Tregs. These results underlie that different
molecular cues attract and retain the Treg and Tconv cells to the
TDLNs or to the tumor.
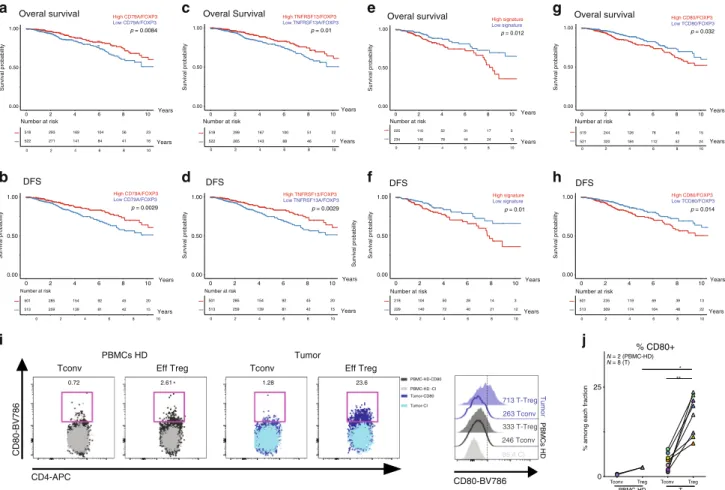
CD80-expressing tumor Tregs correlate with bad prognosis. To
evaluate the clinical relevance of DEGs highly expressed in Tregs
from TDLNs and tumors (Fig.
6
a) we investigated the impact of
these genes on tumor recurrence and survival using the breast
cancer archive from the Cancer Genome Atlas (TCGA-BRCA, see
methods). We
first assessed FOXP3 gene; the master transcription
factor of Tregs, and observed that FOXP3 mRNA expression level
per se has no impact in overall survival (OS) and disease
free-survival (DFS), as previously described
12(Supplementary
Fig. 6a–b). To identify genes which expression correlated with
FOXP3 across the TCGA-BRCA cohort, we calculated the gene:
FOXP3 mRNA ratio for all DEGs (see methods). We found 10
genes, in which mRNA levels were positively correlated with
FOXP3 reads (r > 0.5) and high mRNA:FOXP3 ratios were
asso-ciated with better OS and DFS, being CD79A and TNFRSF13B,
two molecules associated with B-cell activation
41, the most
sig-nificantly correlated ones (Fig.
7
a–d and Supplementary Fig. 6c).
Furthermore, we found a signature of three genes, namely CD80,
CCR8, and HAVCR2, which positively correlated with FOXP3
reads (Supplementary Fig. 6d) and which high mRNA:FOXP3
ratios were significantly associated with poor OS (p = 0,012) and
DFS (p
= 0.01) (Fig.
7
e, f). When considering these three genes
independently, only the CD80:FOXP3 mRNA high ratio was
significantly associated with a worse OS and DFS (Fig.
7
g, h). We
confirmed the high expression of CD80 on tumor Tregs at the
protein level by FACS (Fig.
7
i and Supplementary Fig. 6g), but
not in the I-TDLN because of the high variability among patients
(Supplementary Fig. 6e). We found that tumor Tregs showed a
higher frequency and MFI of CD80 than Tconv and peripheral
Tregs from healthy donors (HD) (Fig.
7
j). Of note, we detected
CD80 expression in Tregs, both at the mRNA (RNA sequencing)
and at the protein level (fluorescence-activated cell sorting
(FACS)); as CD80 can be acquired by Tregs by trogocytosis
44or
transendocytosis
45,46, it is not possible to know whether the
CD80 protein observed in Tregs has been synthetized by the Treg,
has been acquired from the membrane of other cells, or both.
These results indicate that CD80-expressing Tregs could define a
subset of highly activated/suppressive Tregs associated with bad
prognosis. These results emerge as potential therapeutic targets
for breast tumor-associated Tregs.
Discussion
Studies on Tregs in breast cancer showed that the proportion of
blood FOXP3+ CD4+ T cells is increased compared with healthy
donors
47,48and that in the tumor high proportions of FOXP3+
CD4+ T cells—detected by immunohistochemistry (IHC)—are
associated with a bad prognosis
14,15,25,49. Data quantifying Tregs
in breast cancer-TDLNs, is scarce
18, and has been mainly
obtained by FOXP3 detection by IHC that do not allow
the distinction between the suppressive CD4+ CD25+
FOX-P3high T and the non-suppressive CD4+ CD25+
FOXP3low-T cells
12,18,19,50. Our
flow cytometry results establish that the high
proportions of Tregs observed in TDLNs and in the primary
tumor microenvironment constitute
“bona fide” Tregs. Although
Tregs can lose their phenotypic stability and functions in
pro-inflammatory microenvironments
13,32,51, we found that even in
the presence of activated IFN-γ-producing CD4+ T cells, Tregs
in I TDLNs maintained their ex vivo suppressor capacity and had
a stable phenotype (as judged by the low levels of cytokine
pro-duction). Moreover, Tregs in TDLNs and in the tumor expressed
high levels of CTLA-4, ICOS, GITR, and OX40, phenotype
associated to a high suppressive capacity. It is noteworthy that
although the Tconvs showed signs of dysfunction in the tumor,
the suppressor Eff Tregs did not, highlighting the latter’s ability to
adapt to the tumor microenvironment. One explanation to this
observation could be that Tregs are more proficient than Tconvs
to survive and function in the presence of hypoxia, acidosis, and
nutrient deprivation
52, which can be assumed to be more
strin-gent in the tumor than in the I TDLNs, owing to differences in
tumor burden.
Our observations have several clinical implications. The
tran-scriptomic analysis of purely sorted Tregs and Tconvs identified
CD80-expressing Tregs as a subpopulation of Tregs associated to
bad prognosis in breast cancer, which represents a candidate for
the design of immunoregulatory therapies, and merit further
analysis to better understand its role in the biology of
tumor-associated Tregs. Also, we found that Tregs from luminal breast
cancer patients showed a distinct pattern of highly expressed
costimulatory and co-inhibitory molecules, including PD-1,
CTLA-4, ICOS, GITR, OX40, and CD39, underscoring the value
of these molecules as targets for immunomodulation. As follows,
the non-depleting, anti-CTLA-4 Ab Tremelimumab (but not the
depleting Ab Ipilimumab) showed limited activity in metastatic
melanoma and breast cancer;
24,53,54what could be explained by
its low capacity to deplete CTLA-4-expressing Tregs. Also, our
data predict that depleting Abs that target ICOS, GITR, and
OX40 (such as the depleting anti-OX40 Ab MEDI6469
55) could
be good candidate drugs for patients with luminal breast cancer.
We observed that in TDLNs, Tregs and Tconvs show a similar
pattern of chemokine receptor expression, reinforcing the concept
that the ability of Tregs to maintain local immune homeostasis
depends on their appropriate colocalization with Tconvs
13. Along
these lines, Redjimi et al.
56also showed that the proportion of
CXCR3+ Tregs in ovarian tumors was directly correlated to that
of CXCR3+ Tconvs. In addition, in I TDLNs we detected a
significant increase of Th1 cells compared with NI TDLNs,
sug-gesting that nodal tumor invasion is associated to an
IFN-γ-mediated T-cell response, which has been linked to potent
anti-tumor responses
57,58. Moreover, a rich CD4+ Th1 signature in
breast tumors has been associated with a good prognosis
59. Also, I
TDLNs showed higher proportions of Tfh cells. Interestingly,
Faghih et al.
8identified Tfr and CD4+ T cells producing IFN-γ,
IL-4, and IL-17 in breast cancer tumors, and concluded that upon
metastasis in the TDLNs, the immune response becomes more
inhibited.
In line with our results, other studies found higher levels of
T-cell clonality in the tumors than in the blood and in juxtatumoral
tissues (and in the TDLNs in our study), with shared clones found
in tissues and tumors
12,25,35,60. Assuming that the
tumor-expanded clones are the tumor-specific ones, this observation
underscores an ongoing antitumor response, leading to an
accumulation of tumor-specific CD4+ T cells in the tumor.
Furthermore, the detection of shared
β-CDR3s between
tumor-expanded T-cell clones and T cells in TDLNs indicates circulation
between the tumor and the TDLNs, and underscores the potential
contribution of TDLNs as source of tumor-specific T cells that
might be modulated by immunotherapies. As suggested by
Zemmour et al.
61, Tregs with the same TCR have similar
tran-scriptional traits, implying that Tregs with shared antigenic
spe-cificity from tumors and TDLNs may also share an early
imprinted specific program that persists after priming and drive
them to anatomical locations with common environmental cues.
Furthermore, inter-tissue sharing of Treg clones could also be
indicative of a loco-regional suppression mechanism. Finally,
~20% of the tumor-Treg
β-CDR3s were shared with Tconv cells,
pointing out that an important fraction of the Tregs could arise
through peripheral induction or conversion of CD4+ Tconv cells.
Along these lines, although Helios is not a marker exclusively for
thymic Tregs, the high level of Helios expression in tumor and
TDLN Tregs (Supplementary Fig. 2) could reflect in situ
per-ipheral Treg differentiation. Although the use of the same TCR in
different subsets is suggestive but not demonstrative of a
common clonal origin, it has been recently shown in a mouse
model
38that monoclonal CD4+ T-cell may become effector,
anergic, or Treg in the TDLNs as soon as 7 days after priming. Of
note, in all the analyzed tissues Tregs were more clonally
expanded that Tconvs, probably reflecting their more self-reactive
repertoire.
We identified a group of 121 common genes that characterize
Tregs in breast tumors, NI, and I TDLNs, and a list of
distinctive genes associated to each location, pointing out their
tissue adaptation. NI TDLN-Tregs are characterized by a
++++++++++ + ++
+++++++++++++ ++++++++++
Overal survival Overal survival
DFS Overal survival DFS Overal Survival +++++++++++++++++++++++++++++++++++++++++++++++++++++++++++++++++++++++++++++++++++++++++++++++++++++++++++++++++++++++++++++++++++++++++++++++++++++++++++++++++++++++++++++++++++++++ +++++++++++++++++++++++++++++++++++ ++++++++++++++++++++++++++++++++++++ +++++++++++ +++++++++ ++++ +++++++++++ ++++++++++ +++ + ++++++++++++++++++++++++++++++++++++++++++++++++++++++++++++++++++++++++++++++++++++++ +++++++++++++++++++++++++++++++++++++++++++++++++++++++++++++++++++++++++++++++++++++++++++++++++++++++++++++++++++++ ++++++++++++++++++++++++++ ++++++++++ +++++++++++++++ ++++++++++ + +++++++++++++++++ ++ ++ + 0.00 0.50 1.00 0 2 4 6 8 10 + + 518 293 169 104 56 23 522 271 141 84 41 16 0 2 4 6 8 10 + + + ++++++++++++++ ++++++++++++++++++++++++++++++++++++++++++++++++++++++++++++++++++++++++++++++++++++++++++++++++++++++++++++++++++++++++++++++++++++++++++++++++++++++++++++++++++++++++++++++ +++++++++++++++++++++++++++++++ ++++++++++++++++++++++++++++++++++++++++++++++++++ +++++++ ++++++ ++++++++++++ + ++ + + + + + +++++++++++++++++++++++++++++++++++++++++++++++++++++++++++++++++++++++++++++++++++++++++++++++++++++++++++++++++++++++++++++++++++++++++++++++++++++++++++++++++++++++++++++++++++++++++++++++++++++ +++++++++++++ +++ ++++++++++ ++++++++++++ ++++++++++++++ ++ + ++++ + + ++++++++ +++++ + +++++ ++ ++ + 0 2 4 6 8 10 518 299 167 100 51 22 522 265 143 88 46 17 0 2 4 6 8 10 Years Years ++++++++++ + +++++++++++++++++++++++++++++++++++++++++++++++++++++++++++ +++++++++++++++++++++++++ +++++++++ +++++++++ +++++ +++ ++ +++++ + ++ ++ + + +++ + + + + + +++++++++++++ +++++++++++++++++++++++++++++++++++++++++++++++++++++++++++++++++++++++++++++ +++++++++++++ ++++++ +++ +++++++++++++++ ++++++++ + ++ +++ +++++ +++ + + ++ ++++++ + + p = 0.012 0 2 4 6 8 10 225 110 52 31 17 3 234 146 78 44 24 13 0 2 4 6 8 10 Number at risk +++++++++++++++++++++++++++++++++++++++++++++++++++++++++++++++++++++++++++++++++++++++++++++++++++++++++++++++++++++++++ ++++++++++++++++++++ ++++++++++++++++++++++++++++++++++++++++++++++++++++++++++++++++++++++++ +++++ +++++ ++++ +++++++++++++++++++++++ +++ + + ++++++++++ +++++ ++++ + ++ +++ ++++++++++++++ +++++++++++++++++++++++++++++++++++++++++++++++++++++++++++++++++++++++++++++++++++++++++++++++++++++++++++++++++++++++++++++++++++++++++++++++++++++++++++++++++++++++++++++++++++++++++++++++++++++++++++ +++++++++++++++++++++++ +++++++++++ ++++++++++++++++++++ +++++++++ ++ +++++ ++++++ ++++++++ + + 0 2 4 6 8 10 519 244 126 76 45 15 521 320 184 112 52 24 0 2 4 6 8 10 p = 0.032 Years Years Survival probability 0.00 0.50 1.00 Survival probability 0.00 0.50 1.00 Survival probability 0.00 0.50 1.00 Survival probability Number at risk Number at risk Number at risk
Years Years Years Years p = 0.01 1.00 DFS +++++++ ++++++++++++++++++++++++++++++++++++++++++++++++ +++++++++++++++++++++++++++++++++ ++++++++++++ + ++ ++++ +++ + ++ ++ + + +++ + + + + +++++++++++++++++++++++++++++++++++++++++++++++++++ +++++++++++++++++ ++++++++++ +++++++++++++++++++++ ++ ++++ ++++ + ++ +++ ++++++++ + +++++++ + + 0 2 4 6 8 10 218 104 50 28 14 3 229 140 72 40 21 12 0 2 4 6 8 10 +++++++++++++++++++++++++++++++++++++++++++++++++++++++++++++++++++++++++++++++++++++++++++++++++++++++++++++++++++++ ++++++++++++++++++++ ++++++++++++++++++++++++++++++++++++++++++++++++++++++++++++ +++++++++++++++ +++++ ++++ ++++++++++++ ++++++++++ +++ + + ++++++++ +++++++ +++ + ++++ ++++++++++++++ +++++++++++++++++++++++++++++++++++++++++++++++++++++++++++++++++++++++++++++++++++++++++++++++++++++++++++++++++++++++++++++++++++++++++++++++++++++++++++++++++++++++++++++ ++++++++++++++++++++++++++++ ++++++++++++++++++ +++++ ++++++++++++++++++++++++++++++++++++++ ++ ++ ++ ++++++ ++++++++ + + + 0 2 4 6 8 10 501 235 119 69 39 13 513 309 174 104 48 22 0 2 4 6 8 10 p = 0.01 Years Years
Number at risk Number at risk
Years Years p = 0.014 +++++++++++++++++ ++++++++++++++++++++++++++++++++++++++++++++++++++++++++++++++++++++++++++++++++++++++++ ++++++++++++++++++++++++++++++++++++++++++++++++++++++++++++++++++++++++++ +++++++++++ +++++++++++++++++++++++++++++ +++++++++++++++++++++++++++++++ ++++++++++++++++++ ++++++ +++++ ++++++++++++ + + + +++++++++++++++++++++++++++++++++++++++++++++++++++++++++++++++++++++++++++++++++++ +++++++++++++++++++++++++++++++++++++++++++++++ ++++++++++++++++++++++++++++++++++++++++++++++++++++++++++++++ +++++++++++++++++++ +++++++++++ ++++++++++++++++++++++++ ++ +++++ + + ++++++++ ++++++ +++++ ++ ++ + 0.00 0.50 0 2 4 6 8 10 0 2 4 6 8 10 501 285 154 92 45 20 513 259 139 81 42 15 0 2 4 6 8 10 Number at risk Years Years p = 0.0029 +++++++++++++++++ +++++++++++++++++++++++++++++++++++++++++++++++++++++++++++++++++++++++++++++++++++++++++++++++++++++++++++++++++++++++++++++++++++++++++++++++++++++++++++++++++++++++++++++ ++++++++++++++++++++++++ +++++ +++++++++++++++++++++++++++++++ ++++++++++++++++++ ++ ++++ ++ +++ ++++++++++++ + + + ++++++++++++++++++++++++++++++++++++++++++++++++++++++++++++++++++++++++++++++++++++++++++++++++++++++++++++++++++++++++++++++++++++++++++++++++++++++++++++++++++++++++++++++++++++++++++++++++ +++++++++++++++++++ +++++++++++ ++++++++++++++++++++++++ ++ +++++ + + ++++++++ ++++++ +++++ ++ ++ + 501 285 154 92 45 20 513 259 139 81 42 15 0 2 4 6 8 10 Number at risk Years Years p = 0.0029 DFS
f
h
b
d
i
713 T-Treg 333 T-Treg 85,4 CI Eff Treg CD4-APC CD80-BV786 CD80-BV786 Tconv 0.72 2.61 1.28 23.6 Eff Treg Tconv Tumor-CD80 Tumor-CI PBMC-HD-CD80 PBMC-HD -CI 263 Tconv 246 Tconve
g
a
c
PBMCs HD Tumor PBMCs HDj
% CD80+Tconv Treg Tconv Treg
0 25
% among each fraction
N = 2 (PBMC-HD) N = 8 (T) ** T PBMC-HD * Tumor Survival probability 1.00 0.00 0.50 Survival probability 1.00 0.00 0.50 Survival probability 1.00 0.00 0.50 Survival probability Survival probability p = 0.0084 High TNFRSF13/FOXP3
Low TNFRSF13A/FOXP3 High signatureLow signature High CD80/FOXP3Low TCD80/FOXP3
High CD79A/FOXP3
Low CD79A/FOXP3 High TNFRSF13/FOXP3Low TNFRSF13A/FOXP3 High signatureLow signature
High CD80/FOXP3
Low TCD80/FOXP3
High CD79A/FOXP3
Low CD79A/FOXP3
Fig. 7 Clinical outcome of differentially expressed genes normalized toFOXP3 expression. a–h OS (upper panels) and DFS (lower panels) of patients
with breast cancer stratified by “high” or “low” median intensity of the expression level of CD79, TNFRSF13B, “CD80, CCR8, and HAVCR2 signature” and
CD80 normalized to FOXP3 expression, in TCGA breast cancer data set. i Representative flow cytometric analysis of CD80 expression on Tconv and Treg
cells from HD PMBCs (left panels) or tumor (right panels) and representative histogram of CD80 MFI levels in the different subpopulations.j Frequency of
CD80+ CD4+ Tconvs or Tregs in HD PBMCs (N = 2) or tumors CD45+ cells (N = 8). PBMC-Treg vs tumor-Treg p = 0.044. Mann–Whitney test.

![Rôles et mécanismes d'action du récepteur AT[indice inférieur 2] de l'angiotensine II d'un modèle cellulaire neuronal au tissu prostatique humain l'importance du contexte](data:image/gif;base64,R0lGODlhAQABAIAAAP///wAAACH5BAEAAAAALAAAAAABAAEAAAICRAEAOw==)