1
Supplements
S1. Modelled ice thickness and volume with GlabTop
The thickest ice (>100 m) is found at the principle valley glaciers which are the Mer de Glace, and its 5
tributaries (Tacul and Leschaux glaciers), the Argentière and Miage glaciers, but also at the tongues of the Tré la Tête, Tour and Talèfre glaciers (Fig. S1).
Figure S1. Predicted ice thickness with GlabTop and the ASTER DEM (left) and IGN DEM (right).
10
The accumulation zones of the Mer de Glace (Vallée Blanche and Géant glacier), the Plateau du Trient, Saleina, Triolet and Pré de Bar glaciers also have ice thickness > 100 m. Ice thickness > 250 m was modelled at some locations of the Tacul, Leschaux and Argentière glaciers based on the IGN DEM, surrounded by large areas of ice > 200 m, which is also found in the flat area of the Tré-la-Tête glacier. Simulations on the ASTER DEM resulted in thinner predicted ice, barely exceeding 200 m at locations 15
2 where predicted ice is > 250 m on the IGN DEM. The thickest ice was predicted with the RGD DEM (Fig. S2).
Figure S2. Summary statistic of the ice thickness modelled with the ASTER and IGN DEM, and of
the differences in ice thickness results. The lowest and highest boundaries of the boxes respectively 20
display the 1st and 3rd quartile (Q1 and Q3) of the observations. The lowest and highest whiskers
respectively show Q1-((Q3-Q1)×1.5]) and (Q3+((Q3-Q1)×1.5)). The dots are the outliers. The red squares display the mean values.
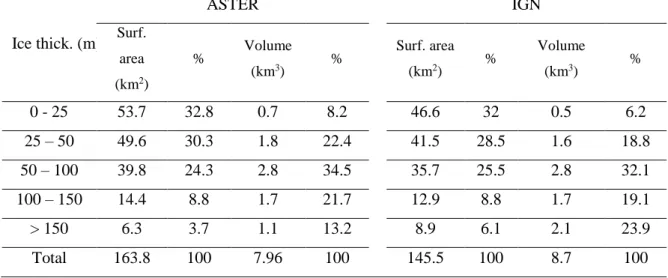
More than half of the glacier surface area is underlain by ice thinner than 50 m, and 75% is < 80 m (Fig. 25
3 left; Tab. 1). This general pattern is consistent between DEMs, but locally, the ice thickness may vary by 10-20 m, depending on the DEM used to run GlabTop, while differences > 100 m are rare (Fig. 3 right). The surface area and volume represented by the thickest ice (> 150 m) also greatly differ between the DEMs, while these parameters are more consistent for thinner ice (Tab. S1). The Argentière glacier and the Mer de Glace as well as their tributaries, respectively account for 9 and 19.5% of the glacier 30
3 Ice thick. (m) ASTER IGN Surf. area (km2) % Volume (km3) % Surf. area (km2) % Volume (km3) % 0 - 25 53.7 32.8 0.7 8.2 46.6 32 0.5 6.2 25 – 50 49.6 30.3 1.8 22.4 41.5 28.5 1.6 18.8 50 – 100 39.8 24.3 2.8 34.5 35.7 25.5 2.8 32.1 100 – 150 14.4 8.8 1.7 21.7 12.9 8.8 1.7 19.1 > 150 6.3 3.7 1.1 13.2 8.9 6.1 2.1 23.9 Total 163.8 100 7.96 100 145.5 100 8.7 100
Table S1. Glacier surface area and volume calculated for 6 ice thickness classes and the 2 DEMs. 35
Statistics are not provided for the RGD DEM because it does not cover the Swiss and Italian sides of the massif.
The mean ice thickness peaks at 1900 m a.s.l. with a value > 150 m with the IGN DEM (Fig. S3) and decreases to reach a minimum value of 20 m between 3500 and 3700 m a.s.l., but increases again up to 40 m at 4600 m a.s.l. The glacier surface area follows a totally different pattern, with a peak at 3000 m 40
a.s.l. and sharp decrease above and below, to respectively 3700 and 2300 m a.s.l., followed by gradual decrease towards the highest and lowest elevations. The glacier volume mostly follows the distribution of the surface area, despite a slightly more irregular pattern below the elevation of the maximum value reached at 2900-3000 m.
Comparison of modelled glacier bed topography with measured glacier bed elevation at the Argentière 45
glacier shows that predicted ice thickness is often underestimated, and may be up to twice thinner than the measured thickness.
4 Figure S3. Distribution of the ice volume, surface area and mean thickness for elevation interval of 100
m, calculated with Glabtop with the ASTER and IGN DEMs. Statistics are not provided for the RGD 50
5
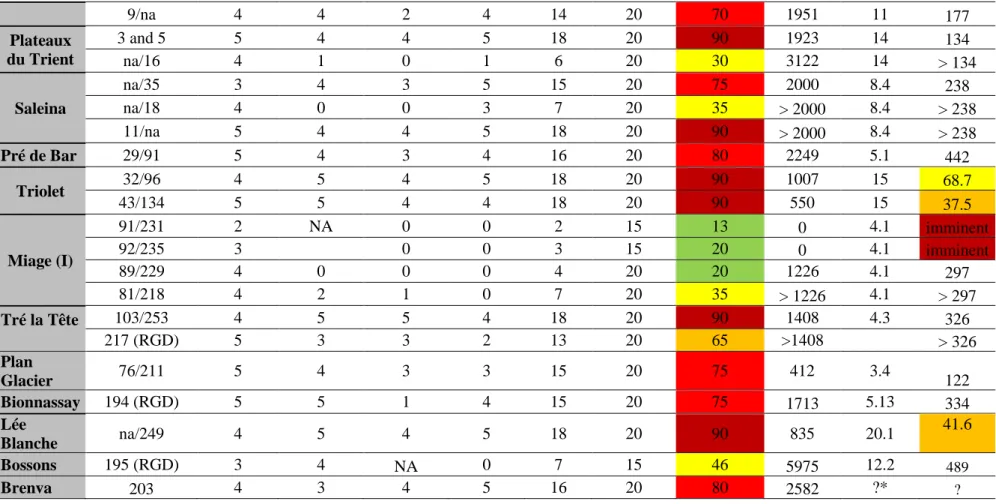
S2. Characteristics and analysis of predicted GBOs with GlabTop
Glacier ID (IGN/ASTER) Criterion (i) Criterion (ii) Criterion (iii) Criterion (iv) Total value Maximum value Percentage of filled value Length change (m) Retreating rate per year Number of years before potential lake formation Mer de Glace, Tacul, Leschaux 27/86-93 5 3 3 2 13 20 65 2198 9.1 242 146 (RGD) 3 5 4 4 16 20 80 > 2198 9.1 > 242 63 4 4 3 4 15 20 75 > 2198 9.1 > 242 64 5 4 3 3 15 20 75 > 2198 9.1 > 242 61 5 2 0 2 9 20 45 > 2198 9.1 > 242 67 5 2 1 4 12 20 60 > 2198 9.1 > 242 142 4 2 2 2 10 20 50 > 2198 9.1 > 242 42-37/132 4 to 5 2 to 3 2 4 16 20 80 > 2198 9.1 > 242 38/113 4 to 5 1 to 2 2 1 13 20 65 > 2198 9.1 > 242 40/127 4 to 5 1 to 2 4 0 10 20 50 > 2198 9.1 > 242 156 5 1 3 1 10 20 50 > 2198 9.1 > 242 132 (RGD) 4 4 1 5 14 20 70 > 2198 9.1 > 242 54-58/159 4 5 4 4 17 20 85 > 2198 9.1 > 242 Talèfre 33/103 4 5 5 NA 14 15 93 0 8.34 Imminent 30/89 5 3 3 0 11 20 55 1594 8.34 191 Argentière na/38 4 2 3 2 11 20 55 542 5.7 95.8 12 and 44 4 5 3 5 17 20 85 268 5.7 47.4 13/47-50 5 4 3 4 16 20 80 1676 5.7 296 16-20/59-61 5 2 2 3 12 20 60 > 1676 5.7 > 296 21/63 5 2 1 1 9 23 39 > 1676 5.7 > 296 24/65-66 5 3 1 3 12 20 60 > 1676 5.7 > 296 Tour 6-7 and 18 4 5 4 3 16 20 80 689 11 62.3
6 9/na 4 4 2 4 14 20 70 1951 11 177 Plateaux du Trient 3 and 5 5 4 4 5 18 20 90 1923 14 134 na/16 4 1 0 1 6 20 30 3122 14 > 134 Saleina na/35 3 4 3 5 15 20 75 2000 8.4 238 na/18 4 0 0 3 7 20 35 > 2000 8.4 > 238 11/na 5 4 4 5 18 20 90 > 2000 8.4 > 238 Pré de Bar 29/91 5 4 3 4 16 20 80 2249 5.1 442 Triolet 32/96 4 5 4 5 18 20 90 1007 15 68.7 43/134 5 5 4 4 18 20 90 550 15 37.5 Miage (I) 91/231 2 NA 0 0 2 15 13 0 4.1 imminent 92/235 3 0 0 3 15 20 0 4.1 imminent 89/229 4 0 0 0 4 20 20 1226 4.1 297 81/218 4 2 1 0 7 20 35 > 1226 4.1 > 297 Tré la Tête 103/253 4 5 5 4 18 20 90 1408 4.3 326 217 (RGD) 5 3 3 2 13 20 65 >1408 > 326 Plan Glacier 76/211 5 4 3 3 15 20 75 412 3.4 122 Bionnassay 194 (RGD) 5 5 1 4 15 20 75 1713 5.13 334 Lée Blanche na/249 4 5 4 5 18 20 90 835 20.1 41.6 Bossons 195 (RGD) 3 4 NA 0 7 15 46 5975 12.2 489 Brenva 203 4 3 4 5 16 20 80 2582 ?* ? 55
Table S2. Analysis of the predicted GBOs with GlabTop. * « ? » indicate that it is not possible to calculate a glaicer retreat rate due to glacier change in
7
S3. Characteristics and analysis of GBOs visually detected
Glacier ID Criterion (i) Criterion (ii) Criterion (iii) Criterion (iv) Total value Maximum value Percentage of filled value Length change (m) Retreating rate per year Number of years before potential lake formation Jetoula 1 4 5 1 2 12 20 60 164 1.8 90.2 Thoule 2 5 4 2 3 14 20 70 600 3.1 194.1176 3 5 5 2 3 15 20 75 323 3.1 104.5 Planpincieux 4 4 5 2 4 15 20 75 595 2.8 211.129 Glacier de Frebrouze 5 4 5 3 5 17 20 85 377 6.1 61.89552 Gruetta 6 3 5 3 3 14 20 70 197 1.5 130.02 Brouillard 7 3 5 0 0 8 20 40 227 Lée Blanche 8 3 5 0 0 8 20 40 304 20. 1 15.13122 3 3 1 0 7 20 35 2244 20. 1 111.6923 10 4 5 0 1 10 20 50 1755 20. 1 87.35294 11 4 5 0 1 10 20 50 1455 20. 1 72.42081 Estelette 12 3 5 1 2 11 20 55 365 12.7 28.61045 Brouillard amont 13 3 5 1 3 12 20 60 1170 3.5 333 Mont Blanc 14 4 5 2 1 12 20 60 ? ? ? 15 3 3 1 0 7 20 35 ? ? ? Dome 16 4 5 0 0 9 20 45 ? ? ? 17 3 5 1 1 10 20 50 ? ? ?
8 Bionnassay (Italy) 18 3 5 0 2 10 20 50 ? ? ? Tré la Tete 19 4 2 2 1 9 20 45 5870 4.3 1360.122 20 4 3 0 0 7 20 35 3025 4.3 700.9146 21 4 4 0 0 8 20 40 3809 4.3 882.5732 22 3 4 0 0 7 20 35 5429 4.3 1257.939 23 4 5 1 2 12 20 60 5519 4.3 1278.793 Bossons 24 4 5 1 2 12 20 60 5041 12.2 411.9527 25 4 3 1 3 11 20 55 3336 12.2 272.6194 26 4 5 1 1 11 20 55 1847 12.2 150.9376 Bionnassay 27 5 5 3 5 18 20 90 1239 3.8 324.7034 28 3 5 0 0 8 20 40 2941 3.8 770.7448 29 4 3 2 0 9 20 45 3530 3.8 925.1034 Bossons 30 4 5 0 0 9 20 45 6219 12.2 508.2194 31 5 5 0 1 11 20 55 4397 12.2 359.3247 32 3 5 2 4 14 20 70 384 12.2 31.38065 33 4 5 1 4 14 20 70 2500 12.2 204.3011 Pré de Bar 34 4 5 1 2 12 20 60 959 5.1 188.375 A neuve 35 5 3 2 10 15 66.67 508 5.3 96.30332 Treutse Bô 36 4 5 4 3 16 20 80 147 1.5 98 Tour 37 4 3 3 2 12 20 60 2524 11.0 228.3619 Tête Rousse 38 5 5 0 1 11 20 55 NA NA NA 39 4 5 3 NA 12 15 80 NA NA NA 60
Table S3. Analysis of the GBOs visually detected. * « ? » indicate that it is not possible to calculate a glacier retreat rate cecause teh concerned glacier is the