A CRISPR screen identifies a pathway
required for paraquat-induced cell death
The MIT Faculty has made this article openly available.
Please share
how this access benefits you. Your story matters.
Citation
Reczek, Colleen R, Kıvanç Birsoy, Hyewon Kong, Inmaculada
Martínez-Reyes, Tim Wang, Peng Gao, David M Sabatini, and
Navdeep S Chandel. “A CRISPR Screen Identifies a Pathway
Required for Paraquat-Induced Cell Death.” Nature Chemical
Biology 13, 12 (October 2017): 1274–1279 © 2017 Nature America,
Inc., part of Springer Nature
As Published
http://dx.doi.org/10.1038/NCHEMBIO.2499
Publisher
Nature Publishing Group
Version
Author's final manuscript
Citable link
http://hdl.handle.net/1721.1/116772
Terms of Use
Creative Commons Attribution-Noncommercial-Share Alike
A CRISPR screen identifies a pathway required for
paraquat-induced cell death
Colleen R. Reczek1, Kıvanç Birsoy2, Hyewon Kong1, Inmaculada Martínez-Reyes1, Tim
Wang3,4,5,6, Peng Gao7, David M. Sabatini3,4,5,6, and Navdeep S. Chandel8,*
1Department of Medicine, Northwestern University Feinberg School of Medicine, Chicago, IL 60611, USA
2Laboratory of Metabolic Regulation and Genetics, The Rockefeller University, New York, NY 10065, USA
3Whitehead Institute for Biomedical Research, Department of Biology, Massachusetts Institute of Technology, Cambridge, MA 02142, USA
4Howard Hughes Medical Institute, Department of Biology, Massachusetts Institute of Technology, Cambridge, MA 02139, USA
5Koch Institute for Integrative Cancer Research, Massachusetts Institute of Technology, Cambridge, MA 02139, USA
6Broad Institute of Harvard and Massachusetts Institute of Technology, Cambridge, MA 02142, USA
7Metabolomics Core Facility, Northwestern University Robert H. Lurie Comprehensive Cancer Center, Chicago, IL 60611, USA
8Department of Medicine, Northwestern University Feinberg School of Medicine, Chicago, IL 60611, USA
Abstract
Paraquat, a herbicide linked to Parkinson’s disease, generates reactive oxygen species (ROS) to cause cell death. Because the source of paraquat-induced ROS production remains unknown, we conducted a CRISPR-based positive selection screen to identify metabolic genes essential for
Users may view, print, copy, and download text and data-mine the content in such documents, for the purposes of academic research, subject always to the full Conditions of use: http://www.nature.com/authors/editorial_policies/license.html#terms
*Corresponding author: Navdeep S. Chandel (nav@northwestern.edu).
Communication with Editorial and Production offices: Navdeep S. Chandel, Northwestern University, Feinberg School of Medicine, McGaw Pavilion, Rm. M–334, 240 East Huron Street, Chicago, IL 60611, Phone: 312–503–2549, nav@northwestern.edu
AUTHOR CONTRIBUTIONS
C.R.R., K.B., D.M.S., and N.S.C. initiated the project and designed the research plan. C.R.R. and K.B. conducted the PQ positive selection and negative selection CRISPR–based screens. T.W. performed the bioinformatics analysis of the deep sequencing data. C.R.R. and H.K. generated clonal knockout and cDNA overexpression Jurkat and A549 cell lines. C.R.R. and H.K. prepared genomic DNA for sequencing the knockout clones. H.K. performed all western blot analyses and the A549 viability assays. C.R.R. assessed Jurkat cell viability. I.M.R. performed the ROS measurements using CM-H2DCFDA and Amplex red and assessed SOD1 activity. P.G. performed the mass spectrometry experiments to assess PQ uptake. C.R.R. and N.S.C. wrote the manuscript, with input from all authors.
HHS Public Access
Author manuscript
Nat Chem Biol
. Author manuscript; available in PMC 2018 April 23. Published in final edited form as:Nat Chem Biol. 2017 December ; 13(12): 1274–1279. doi:10.1038/nchembio.2499.
A
uthor Man
uscr
ipt
A
uthor Man
uscr
ipt
A
uthor Man
uscr
ipt
A
uthor Man
uscr
ipt
paraquat-induced cell death. Our screen uncovered three genes, POR (cytochrome P450 oxidoreductase), ATP7A (copper transporter), and SLC45A4 (sucrose transporter), required for paraquat–induced cell death. Furthermore, our results revealed POR as the source of paraquat-induced ROS production. Thus, our study highlights the use of functional genomic screens to uncover redox biology.
INTRODUCTION
Paraquat (1,1′-dimethyl-4,4′-bipyridinium dichloride, PQ; 1), an organic compound first synthesized in the late 19th century, has become one of the most widely used herbicides for its rapid contact-dependent killing of weeds and plants and its timely inactivation upon reaching the soil [1–3]. Occupational usage of the highly toxic chemical PQ has been shown to increase an individual’s risk for Parkinson’s disease [3–5], a neurodegenerative disorder characterized by loss of dopaminergic neurons, about 1.3 to 3.6-fold, with increased risk correlating to longer PQ exposure [6–8]. Moreover, mice exposed to PQ display pathological features reminiscent of Parkinson’s disease, including α-synuclein-containing aggregates [9] and apoptosis of the nigral dopaminergic neurons [10]. In humans, inappropriate use of PQ (e.g. voluntary or accidental ingestion), which preferentially accumulates in the lung, can lead to acute PQ poisoning and death as a result of pulmonary fibrosis, inflammation, and respiratory failure [1–3]. Plasma PQ concentrations as they relate to the time since PQ ingestion are used to fairly reliably predict a patient’s prognosis [1]. In a recent retrospective study of 2,136 patients with acute PQ poisoning, where the mean plasma PQ level on admission to the hospital was 26.67 μg/mL (104 μM) and the mean time from ingestion to hospitalization was 17.24 hours, the overall patient survival rate was 44% [11].
The reactive oxygen species (ROS)-generating capabilities of PQ have been linked to both its herbicidal activity and its toxicity to humans [1–3, 12]. PQ, which exists as a dication (PQ2+), can accept an electron from reducing equivalents such as NAD(P)H and be reduced to the PQ monocation radical (PQ•+) [1–3, 12]. The reduction of PQ2+ has been suggested to occur within both the cytosol and the mitochondria by numerous systems including NADPH oxidase, cytochrome P450 oxidoreductase, NADH:ubiquinone oxidoreductase
(mitochondrial complex I), mitochondrial NADH–quinone oxidoreductase, xanthine oxidase, nitric oxide synthase, and thioredoxin reductase [1, 3, 13–15]. In the presence of oxygen (O2), reduced PQ•+ is rapidly reoxidized back to PQ2+, converting O2 into the
superoxide radical (O2•–), a type of ROS [1–3, 12]. O2•– can subsequently be converted to a
second type of ROS, hydrogen peroxide (H2O2), by the enzymatic activity of superoxide
dismutases (SODs). H2O2, in turn, can form a third highly reactive type of ROS, the
hydroxyl radical (OH•), by undergoing Fenton chemistry with ferrous or cuprous ions (Fe2+ or Cu+). Currently, the source of O2•– production by PQ necessary for cell death is not clear.
The continuous redox cycling of PQ, given adequate amounts of NAD(P)H and O2, allows
for a concentration-dependent generation of ROS. Thus, in experimental models, PQ has been utilized to generate low levels of intracellular ROS to study the mechanisms of redox-dependent signaling [16], or it has been used to generate high levels of ROS to initiate toxicity and cause neurodegeneration and pulmonary fibrosis [17, 18].
A
uthor Man
uscr
ipt
A
uthor Man
uscr
ipt
A
uthor Man
uscr
ipt
A
uthor Man
uscr
ipt
In this study, we conducted a CRISPR-based positive selection screen to identify metabolic genes necessary for PQ-induced cell death. Our screen identified three genes, POR
(cytochrome P450 oxidoreductase), ATP7A (copper transporter), and SLC45A4 (sucrose transporter), as essential for PQ-induced cell death. Moreover, our results indicate that POR is the source of ROS generation required for PQ-induced cell death.
RESULTS
A positive selection CRISPR screen using PQ
To identify the source of ROS generation necessary for PQ-induced cell death, we conducted a CRISPR–Cas9-based positive selection screen for metabolic genes whose loss allowed cell survival in the presence of 110 μM PQ, a concentration of PQ that greatly decreases cell viability (Fig. 1a and Supplementary Results, Supplementary Fig. 1a) and is similar to the plasma concentration observed in patients with acute PQ toxicity [11, 19]. Human Jurkat T-acute lymphoblastic leukemia cells were transduced with a metabolic single guide RNA (sgRNA) library containing ~10 unique sgRNAs for each of the ~3,000 metabolic genes (~30,000 sgRNAs total) [20] and cultured in the presence or absence of 110 μM PQ for at least 10 days (Supplementary Fig. 1b). Following ~15 population doublings, genomic DNA was prepared and deep sequencing was performed to compare the abundance of all sgRNAs in the untreated and PQ-treated pool of cells. If a sgRNA knocked out a gene required for PQ-induced cellular toxicity, selection of the cells with 110 μM PQ would have no effect on cell viability; thus, the sgRNAs for that gene would be over-represented in the final PQ-treated surviving cell population, giving that particular gene a positive gene score (Supplementary Fig. 1c).
The screen revealed three strong hits. Among the genes whose loss conferred resistance to PQ, POR had the highest gene score (Fig. 1b). Interestingly, POR encodes cytochrome P450 oxidoreductase, a cytoplasmic-facing endoplasmic reticulum membrane-bound enzyme that accepts electrons from NADPH and donates them to cytochrome P450s [21]. The second-best scoring gene from the screen, ATP7A (Fig. 1b), encodes a predominantly trans-Golgi network localized P-type ATPase copper transporter which transfers cytoplasmic copper into the lumen of the Golgi [22, 23]. It is important to note that ATP7A can also translocate to the plasma membrane to export copper outside of the cell [23]. The third-best scoring gene, SLC45A4 (Fig. 1b), encodes a plasma-membrane-bound glycoside–pentoside–hexuronide cation symporter transporter family member involved in sucrose transport [24].
POR-, ATP7A-, and SLC45A4-null cells are resistant to PQ
To validate the positive selection screen results, we transiently transfected Jurkat cells with the Cas9 endonuclease and one of two independent sgRNAs targeting POR (sgPOR_1 or sgPOR_8) (Supplementary Fig. 1d). Thus, we generated two clonal POR-null Jurkat cell lines using CRISPR–Cas9 technology (POR_KO1 and POR_KO2) (Supplementary Figs. 1e and 8). In addition, we generated a clonal non-targeting Jurkat cell line as a control
(Supplementary Figs. 1e and 8). In agreement with the screen results, POR-null Jurkat cells were more resistant to higher concentrations of PQ than non-targeting control Jurkat cells (Fig. 1c). Moreover, when POR-null Jurkat cells were reconstituted with human POR cDNA
A
uthor Man
uscr
ipt
A
uthor Man
uscr
ipt
A
uthor Man
uscr
ipt
A
uthor Man
uscr
ipt
(Supplementary Figs. 1f and 8), sensitivity to PQ was restored (Fig. 1d). These results indicate that POR is required for PQ sensitivity in Jurkat cells. Given that the lung is the primary target organ for PQ toxicity [1], we also generated a clonal POR-null A549 lung cancer cell line (POR_KO) using sgPOR_6 (Supplementary Figs. 1d, 2a, and 9). Like POR-null Jurkat cells, the POR-POR-null A549 cells were much more resistant to PQ than A549 non-targeting control cells (Supplementary Fig. 2b), a phenotype which was reversed following re-expression of POR in the A549 POR-null clone (Supplementary Figs. 2c,d and 9). It is important to note that reconstitution of POR cDNA in both POR-null Jurkat and POR-null A549 cells increased expression of POR relative to non-targeting cells (Supplementary Figs. 1f and 2c); thus, these cells displayed an increased sensitivity to PQ.
Additionally, using sgATP7A_3 from the positive selection screen (Supplementary Fig. 3a), we generated a clonal ATP7A-null Jurkat cell line (ATP7A_KO) (Supplementary Fig. 3c) and examined cellular viability in the presence of various concentrations of PQ. Consistent with the screening results, ATP7A-null Jurkat cells displayed increased resistance to PQ compared to non-targeting control Jurkat cells (Fig. 1e). A clonal SLC45A4-null Jurkat cell line (SLC45A4_KO), generated using sgSLC45A4_2 (Supplementary Fig. 3b,d), was more viable than non-targeting control Jurkat cells at higher concentrations of PQ (Fig. 1f), again validating the screening results. Collectively, these findings are consistent with the screening results and suggest an essential role for POR, ATP7A, and SLC45A4 in facilitating PQ-induced cell death.
POR is necessary for PQ-induced cytosolic ROS generation
To determine whether POR, ATP7A, or SLC45A4 is required for PQ-mediated ROS generation, we exposed Jurkat cells to 150 μM PQ for 48 hours and measured intracellular ROS using the probe CM-H2DCFDA (2). Oxidation of CM-H2DCFDA, which requires
intracellular oxidants, produces the highly fluorescent product dichlorofluorescein (CM-DCF) [25]. Compared to non-targeting control cells, POR-null, ATP7A-null, and SLC45A4-null Jurkat cells displayed a markedly reduced oxidation of the CM-H2DCFDA dye by
PQ-induced ROS (Fig. 2a). Moreover, intracellular ROS levels were rescued when POR-null Jurkat cells were reconstituted with POR cDNA (Fig. 2b). In addition, we assessed whether POR, ATP7A, or SLC45A4 is necessary for the specific generation of H2O2 using Amplex
red in the presence of superoxide dismutase 1 (SOD1). Amplex red is a cell membrane impermeable reagent that reacts with H2O2 in the presence of peroxidase to produce
resorufin, a red-fluorescent product that can be measured [25]. Because H2O2 can diffuse
freely across the cell membrane, we examined the levels of H2O2 released into the
supernatant following PQ treatment by non-targeting control, POR-null, ATP7A-null, and SLC45A4-null Jurkat cells. As shown in Figure 2c, compared to non-targeting control Jurkat cells, POR-null, ATP7A-null, and SLC45A4-null Jurkat cells had reduced levels of PQ-induced extracellular H2O2 as measured by Amplex red. Reconstitution of POR cDNA in
the POR-null Jurkat clone was sufficient to rescue the levels of H2O2 released into the
supernatant (Fig. 2d). To examine the levels of intracellular H2O2 by Amplex red,
non-targeting control Jurkat cells, POR-null, ATP7A-null, and SLC45A4-null Jurkat cells were saponin-permeabilized and treated with 150 μM PQ for 1 hour. POR-null Jurkat cells had a significantly diminished intracellular H2O2 production compared to non-targeting control
A
uthor Man
uscr
ipt
A
uthor Man
uscr
ipt
A
uthor Man
uscr
ipt
A
uthor Man
uscr
ipt
Jurkat cells (Fig. 2e). However, loss of ATP7A had no effect on the levels of H2O2 in the
cytosol (Fig. 2e). As expected, because cell permeabilization was performed, knockout of the SLC45A4 transporter also had no effect on the production of intracellular H2O2 in the
presence of PQ (Fig. 2e). To further validate the requirement for POR in PQ-mediated H2O2
production, we assessed intracellular H2O2 levels in a POR-null Jurkat cell line reconstituted
with POR cDNA. As shown in Figure 2f, re-expression of POR cDNA was sufficient to restore intracellular H2O2 levels in the presence of PQ. These results were phenocopied in
the A549 cell lines (Supplementary Fig. 4), indicating that POR is the enzyme responsible for catalyzing PQ•+ formation and the subsequent generation of cytosolic ROS necessary for oxidative stress-induced cell death.
POR localizes to the endoplasmic reticulum [21]. Previous data implicated mitochondrial complex I (NADH:ubiquinone oxidoreductase) as the source of PQ-induced ROS production [13]. To determine whether complex I of the mitochondria is necessary for PQ-induced cell death, we generated a Jurkat cell line lacking the NDUFA6 gene (NDUFA6_KO), which encodes a subunit of mammalian mitochondrial complex I (Supplementary Figs. 5a,b and 10). Cells grown in glucose-free media enriched with galactose are dependent on their mitochondria for survival; therefore, we performed a galactose sensitivity assay on NDUFA6-null Jurkat cells to assess mitochondrial function in the absence of NDUFA6. As shown in Supplementary Figure 5c, NDUFA6-null Jurkat cells grown in
galactose-containing media had a drastically reduced cellular viability compared to cells grown in the presence of glucose, indicating that loss of NDUFA6 was sufficient to impair mitochondrial function. If the ROS-generating capabilities of PQ necessary for cell death require
mitochondrial complex I, NDUFA6-null Jurkat cells should be resistant to the concentrations of PQ tested. However, like non-targeting control Jurkat cells, NDUFA6-null Jurkat cells showed sensitivity to PQ (Fig. 3a). Furthermore, using mitochondrial-targeted paraquat (MitoPQ) (3) [26], which is more toxic than PQ (Supplementary Fig. 6), we determined whether POR, ATP7A, and SLC45A4 were required for MitoPQ-induced cell death. Because redox cycling of MitoPQ is reported to occur at the flavin site of mitochondrial complex I [26], sensitivity of POR-null Jurkat cells to MitoPQ was expected (Fig. 3b). Interestingly, the complex I NDUFA6-null Jurkat cells were also sensitive to MitoPQ at the various concentrations tested (Fig. 3b). In contrast, ATP7A-null and SLC45A4-null Jurkat cells showed slight protection against MitoPQ suggesting perhaps an increased antioxidant defense system in these cell lines (Fig. 3b).
PQ transport does not require POR, ATP7A, or SLC45A4
ATP7A and SLC45A4 proteins function as transporters [22–24]; therefore, it is possible they facilitate PQ uptake into cells. To assess PQ uptake, we performed mass spectrometry in the POR-null, ATP7A-null, and SLC45A4-null Jurkat cell lines. Consistent with our findings that POR is the source of PQ-mediated cytosolic ROS generation, knockout of POR in the two POR-null Jurkat clones had no effect on the ability of the cells to take up PQ (Fig. 3c). ATP7A-null and SLC45A4-null Jurkat cells were also capable of importing PQ (Fig. 3c), suggesting an alternative function, other than PQ transport, by which these proteins mediate PQ-induced cell death.
A
uthor Man
uscr
ipt
A
uthor Man
uscr
ipt
A
uthor Man
uscr
ipt
A
uthor Man
uscr
ipt
To better understand how loss of ATP7A and SLC45A4 protects cells from PQ-induced cell death, we examined the activity of the antioxidant SOD1. As shown in Figure 3d, ATP7A-null Jurkat cells, but not POR-ATP7A-null and SLC45A4-ATP7A-null cells, have a significantly increased level of SOD1 activity compared to non-targeting control Jurkat cells. Previous studies have demonstrated that ATP7A-null cells have higher intracellular copper levels [27]. It is possible that the increase in cytosolic copper levels of ATP7A-null Jurkat cells induces a mild stress, resulting in the increased activity of SOD1 and perhaps other antioxidant proteins to counterbalance PQ-induced ROS and allow for cell survival. Indeed, mammalian cells with an increased cellular content of SODs have displayed PQ resistance [28].
Moreover, when we examined the sensitivity of POR-null, ATP7A-null, and SLC45A4-null Jurkat cells to another redox cycler and pro-oxidant 2,3-dimethoxy-1,4-naphthoquinone (DMNQ; 4) (Fig. 3e), we observed significant protection in all three knockout cell lines (Fig. 3f), suggesting that POR, ATP7A, and SLC45A4 mediate DMNQ-induced cell death in a manner similar to PQ. Thus, POR can serve as a site of ROS generation for different redox cycling agents, while ATP7A and SLC45A4 are likely involved in suppressing antioxidant defense systems.
A negative selection CRISPR screen using PQ
We also conducted a negative selection CRISPR-based screen on Jurkat cells using the metabolism-focused sgRNA library [20] to identify genes whose loss sensitizes Jurkat cells to a low concentration of PQ (25 μM) (Supplementary Fig. 7a). This concentration of PQ does not affect Jurkat cell viability (Supplementary Fig. 1a). At the end of the culture period, we used deep sequencing to measure the abundance of all sgRNAs in the untreated and PQ-treated cells and compared it to the initial collected sample (Supplementary Fig. 7a). If a sgRNA targets a gene required for resistance to 25 μM PQ, then sgRNAs for that particular gene will be under-represented in the final PQ-treated surviving cell population, giving that particular gene a negative gene score (Supplementary Fig. 7b). Among the genes selectively required for resistance to PQ were SLC31A1, which encodes the plasma-membrane-bound CTR1 copper importer protein [29], and SOD1, which encodes the copper- and
zinc-dependent cytoplasmic antioxidant enzyme SOD1 [30] (Fig. 4a). Since copper is an essential cofactor for SOD1, these results highlight the importance of copper homeostasis for
resistance to PQ-induced cell death. Indeed, antioxidant deficiencies have been shown to potentiate the toxicity of PQ [2, 31]. To validate the results of the negative selection screen, we pharmacologically decreased intracellular copper levels in wildtype Jurkat cells by using the copper-chelating agent 2,3,2-tetraamine (Tet; 5). In the absence of PQ, Tet had little to no effect on the cellular viability of wild-type Jurkat cells (Fig. 4b). However, when wildtype Jurkat cells were treated with 25 μM PQ in combination with varying
concentrations of Tet, cellular viability was significantly reduced (Fig. 4b). Thus, copper deficiency synergizes with a sub-lethal concentration of PQ to induce cell death.
DISCUSSION
In this study, we used the power of CRISPR-based genetic screens to identify a pathway required for PQ-induced cell death. A positive selection CRISPR screen using a
concentration of PQ similar to the plasma concentration observed in patients with acute PQ
A
uthor Man
uscr
ipt
A
uthor Man
uscr
ipt
A
uthor Man
uscr
ipt
A
uthor Man
uscr
ipt
toxicity revealed three genes, POR, ATP7A, and SLC45A4, required for PQ-induced cell death. Cells individually lacking POR, ATP7A, or SLC45A4 were resistant to lethal concentrations of PQ, validating the positive selection CRISPR screen results.
Previously, POR has been suggested to mediate PQ toxicity [32, 33]. It is thought that POR initiates the redox cycling of PQ, and thus its ROS generation, by mediating PQ one-electron reduction [32, 34, 35]. It is important to note, however, that numerous other systems
including NADPH oxidase, NADH:ubiquinone oxidoreductase (mitochondrial complex I), mitochondrial NADH–quinone oxidoreductase, xanthine oxidase, nitric oxide synthase, and thioredoxin reductase have also been described as having this function and implicated in PQ-mediated toxicity [1, 3, 13–15]. Because the metabolic sgRNA library used in our CRISPR screen contains sgRNAs targeting the above-mentioned mitochondrial and
non-mitochondrial systems [20], the identification of POR as the top hit from our positive selection CRISPR screen demonstrates first-hand the usefulness of these screens to elucidate poorly understood mechanisms in redox biology.
Our data indicate that POR-mediated redox cycling of PQ results in the generation of cytosolic ROS, which induces oxidative stress and ultimately cell death. Surprisingly, our screen did not yield any mitochondrial proteins as possible sites of PQ reduction, although previous studies have demonstrated that mitochondrial complex I can potently induce ROS generation by PQ [13]. We directly tested this by generating cells deficient in the
mitochondrial complex I subunit NDUFA6. These cells were sensitive to PQ indicating that a functional mitochondrial complex I was not necessary for PQ-induced cell death. However, it is important to note that this result may be context-dependent. Perhaps when there is prolonged exposure to low concentrations of PQ, the proposed model of Parkinson’s disease, mitochondrial complex I is the site of PQ reduction and subsequent ROS generation [13, 36]. Indeed, POR-null cells were sensitive to MitoPQ, a mitochondrially targeted form of PQ [26], indicating that POR is not necessary for PQ-mediated toxicity if PQ accumulates primarily within the mitochondrial matrix.
Interestingly, we found that ATP7A-null and SLC45A4-null cells were slightly protected against the pro-oxidant MitoPQ, suggesting that perhaps loss of these proteins leads to an increased antioxidant capacity allowing for cell survival. Furthermore, we found that POR-null, ATP7A-POR-null, and SLC45A4-null cells were resistant to another pro-oxidant and redox cycler DMNQ, suggesting that these genes enhance DMNQ toxicity perhaps by a
mechanism similar to that of PQ. In support of our findings, POR has been reported to catalyze the one-electron reduction of DMNQ resulting in DMNQ-induced O2•– production
and cell death [37]. In addition, we found that POR, ATP7A, and SLC45A4 were not required for PQ uptake into cells. Together, our results indicate that POR is involved in redox cycling, and ATP7A and SLC45A4 are likely involved in suppressing antioxidant responses. Indeed, ATP7A-null cells were found to have a significantly increased level of SOD activity compared to non-targeting control cells. Thus, in the absence of ATP7A, the cells are more capable of detoxifying ROS, converting O2•– to H2O2. Because ATP7A is
involved in cytoplasmic copper efflux from cells [23], loss of ATP7A likely increases cytoplasmic copper levels, affecting the enzymatic activity of the copper-dependent
antioxidant SOD1 [30]. The importance of copper homeostasis was further supported by the
A
uthor Man
uscr
ipt
A
uthor Man
uscr
ipt
A
uthor Man
uscr
ipt
A
uthor Man
uscr
ipt
PQ negative selection CRISPR screen which yielded the genes SLC31A1, the high-affinity copper-uptake protein CTR1, and SOD1, loss of which sensitized cells to a sub–lethal concentration of PQ. Furthermore, pharmacologically chelating intracellular copper induced toxicity in cells exposed to this sub-lethal PQ concentration, supporting the screen results. It will be of interest to determine whether loss of these genes or the others identified in the PQ negative selection screen are linked to neurodegenerative diseases.
In summary, our unbiased screening approach identified POR as the source of PQ-mediated ROS generation. POR transfers an electron from NADPH to PQ2+ to generate reduced PQ•+, which can rapidly react with O2 to produce cytosolic O2•– and recycle PQ2+. ATP7A and
SLC45A4 were also identified and likely facilitate PQ toxicity by suppressing antioxidant responses. In addition, the importance of copper homeostasis as a key regulator of PQ-mediated cell death was unveiled in both our positive and negative selection CRISPR screens. Thus, our findings demonstrate the power of CRISPR-based screens to elucidate unknown mechanisms in redox biology.
ONLINE METHODS
Cell cultureJurkat cells were cultured in RPMI 1640 media (Corning) containing 11.1 mM glucose supplemented with 10% Nu Serum IV Growth Medium Supplement (Corning), 1%
GlutaMax (Gibco), and 1% Antibiotic–Antimycotic solution (Corning) containing penicillin, streptomycin, and amphotericin B. For the galactose sensitivity assay, Jurkat cells were also cultured in RPMI 1640 medium, no glucose (Gibco #11879020) supplemented with 10% dialyzed fetal bovine serum (Gibco), 11.1 mM galactose (Sigma), 1 mM methyl pyruvate (Sigma), 1% GlutaMax (Gibco), and 1% Antibiotic–Antimycotic solution (Corning) containing penicillin, streptomycin, and amphotericin B. A549 cells were cultured in Dulbecco’s Modified Eagle’s Medium (DMEM, Corning) supplemented with 10% Nu Serum IV Growth Medium Supplement (Corning), 1% GlutaMax (Gibco), 1% Antibiotic– Antimycotic solution (Corning) containing penicillin, streptomycin, and amphotericin B, and 1% HEPES (Corning). Cells were grown at 37°C in 5% CO2/95% humidity. Both the
Jurkat and A549 cell lines were from ATCC and are not listed in the database of commonly misidentified cell lines maintained by ICLAC. These cell lines were not authenticated or tested for mycoplasma contamination. Where indicated, cells were grown in the presence of paraquat (PQ, methyl viologen dichloride hydrate; Sigma #856177), MitoParaquat (MitoPQ; a kind gift from Dr. Michael P. Murphy), 2,3–dimethoxy–1,4–naphthoquinone (DMNQ; Enzo #ALX–420–027), and 2,3,2–tetraamine (Tet, N,N′–Bis(2–aminoethyl)–1,3– propanediamine; Sigma #333131).
CRISPR–based screens
Construction, lentivirus production, and Jurkat cell transduction of the metabolism–focused sgRNA library was performed as previously described [20]. Puromycin (2 mg/mL; at a 1:4000 dilution) selection began 2 days post–lentiviral transduction. The positive and negative selection PQ screens were setup following 3 days of puromycin selection, at which point, 50 million Jurkat cells were collected for genomic DNA extraction and analysis of the
A
uthor Man
uscr
ipt
A
uthor Man
uscr
ipt
A
uthor Man
uscr
ipt
A
uthor Man
uscr
ipt
initial sgRNA abundance. For the positive selection screen, 15 million Jurkat cells were seeded in two T175 flasks at a cell density of 300,000 cells/mL and were treated with or without 110 μM PQ for at least 10 days. For the negative selection screen, 50 million Jurkat cells were seeded in two spinner flasks at a cell density of 100,000 cells/mL and were treated with or without 25 μM PQ for at least 10 days. Once the screens were complete (~15 population doublings), the cells were harvested for genomic DNA extraction. The sgRNA inserts were PCR amplified, purified, and sequenced on a HiSeq 2500 (Illumina) using previously reported primer sequences [20]. The abundance of each sgRNA was then
analyzed. The median log2 fold change in the abundance of all sgRNAs targeting a particular
gene between the initial and final cell populations is termed gene score. The difference between the untreated and PQ–treated gene scores is the differential gene score.
Generation of knockout and cDNA overexpression cell lines
sgRNA oligonucleotide pairs against POR, ATP7A, SLC45A4, and NDUFA6 (see oligonucleotide sequences in Supplementary Table 1) were phosphorylated, annealed, and cloned as previously described into the BbsI–linearized pSPCas9(BB)–2A–GFP (PX458) plasmid (a gift from Feng Zhang; Addgene #48138) [38, 39]. As a control, a non–targeting sgRNA was also cloned. These sgRNA–Cas9–GFP containing vectors were transiently transfected into Jurkat and A549 cells using the jetPRIME transfection reagent (Polyplus). 2 days post–transfection, the GFP–positive Jurkat and A549 cells were single cell sorted into wells of a 96–well plate using a BD FACSAria cell sorter in order to establish clonal knockout cell lines. The cells were grown for 2 weeks and the resultant colonies were expanded. Immunoblotting or sequencing was used to confirm knockout of the targeted gene (see below). To generate the reconstituted Jurkat and A549 cell lines, human POR cDNA was PCR amplified (see oligonucleotide sequences in Supplementary Table 2) from the pCMV6–XL4–POR plasmid (OriGene #SC100401) and cloned into the XhoI restriction site of the retroviral pMIRW plasmid (pMIRW–POR), a modified version of the pMIG plasmid (Addgene #9044) where GFP has been replaced with RFP and WPRE. pMIRW–POR and pMIRW alone (empty vector or EV) were transfected into the Phoenix–AMPHO (ATCC #CRL3213) retroviral packaging cell line using the jetPRIME transfection reagent (Polyplus). ~18 hours after transfection the media was changed. The virus–containing supernatant was collected 48 hours post–transfection and passed through a 0.45 μm filter. Polybrene (8 μg/mL) was added to the virus immediately before target cell infection. The POR–null Jurkat cell lines (POR_KO1 and POR_KO2) plated in a well of a 6–well plate at a cell density of 1 × 10⁶ cells/well were spin infected with 4.5 mL of either virus (POR cDNA or EV) for 1.5 hours at 2200 rpm in 37°C. After centrifugation, the cells which are in virus– containing media were placed at 37°C overnight. Infection of the POR–null A549 cell line (POR_KO) occurred the day after seeding the cells in two 10 cm plates. Media was removed and the retrovirus was added to the cells 3 times at 3 hour intervals starting with 2.5 mL, followed by two subsequent additions of 1 mL. At the end of the day, an additional 5 mL of media was added to the plate containing cells and virus. For both Jurkat and A549 cells, the virus was removed from the cells the day after infection. The next day, both cell lines were sorted for RFP–positive cells using a BD FACSAria cell sorter. The cells were continuously sorted to maintain high RFP expression. Immunoblotting was performed as described below to validate reconstitution of POR in these POR–null cell lines.
A
uthor Man
uscr
ipt
A
uthor Man
uscr
ipt
A
uthor Man
uscr
ipt
A
uthor Man
uscr
ipt
Immunoblot analysis
Whole cell lysate extracts were prepared from the indicated Jurkat and A549 cell lines by harvesting and lysing cells in 1× cell lysis buffer (Cell Signaling) containing the Halt protease inhibitor cocktail (Thermo Scientific). The Pierce BCA Protein Assay kit (Thermo Scientific) was used to quantify the protein concentrations. For analysis of POR, 50 μg of whole cell lysate was resolved on a 7.5% SDS–PAGE gel (Bio–Rad) and transferred to a nitrocellulose membrane using the Trans–Blot Turbo Transfer System (Bio–Rad). Immunoblotting was then performed with a rabbit monoclonal antibody specific for cytochrome P450 reductase (POR) (EPR14479(B); Abcam #ab180597) and an alpha– tubulin–specific mouse monoclonal antibody (DM1A, Sigma #T9026) as a loading control. For analysis of NDUFA6, 100 μg of whole cell lysate was resolved on a 4–20% SDS–PAGE gel (Bio–Rad), transferred to a nitrocellulose membrane using the Trans–Blot Turbo Transfer System (Bio–Rad), and immunoblotted with a rabbit polyclonal antibody specific for NDUFA6 (C–18; Santa Cruz #sc–86755). Membranes were incubated at 4°C overnight in primary antibodies diluted in 5% bovine serum albumin (BSA) in 1× Tris–buffered saline with 0.1% Tween 20 (1× TBST). The secondary antibodies, IRDye 800CW goat anti–rabbit (LI–COR #926–32211) and IRDye 680RD goat anti–mouse (LI–COR #926–68070), were diluted in 5% nonfat dry milk in 1× TBST. Image Studio Lite version 3.1 (LI–COR) was used for the analysis of protein levels. The original, uncut western blot gel images are in Supplementary Figures 8–10.
Sequencing knockout clones
Loss of ATP7A and SLC45A4 cannot be confirmed by immunoblotting because a good western blot antibody for these proteins is lacking; therefore, the genomic DNA of clonal ATP7A–null and SLC45A4–null Jurkat cells was prepared using the QIAamp DNA Mini kit (Qiagen) and sequenced. As a control, genomic DNA was also prepared from wildtype and non–targeting Jurkat cells. A DNA region surrounding the sgRNA sequences for ATP7A and SLC45A4 was PCR amplified using the primer sequences in Supplementary Table 2 and the Q5 high–fidelity DNA polymerase (Q5 High–Fidelity 2× Master Mix, New England Biolabs). The PCR product was gel purified and, using Platinum Taq DNA Polymerase (Thermo Fisher), a single deoxyadenosine was added to the 3′ ends of the PCR product (3′ A–overhangs) in order to clone the ATP7A and SLC45A4 genomic DNA fragments into the pCR 2.1–TOPO TA vector (Invitrogen). One Shot Top10 chemically competent bacterial cells (Invitrogen) were transformed with the ligation mixture and the cells were plated on X– gal–coated ampicillin agar plates for blue and white colony selection. At least 6 white colonies were picked, cultured, and mini–prepped from each ligation plate. The mini–prep DNA was then sequenced to identify whether a Cas9–mediated loss–of–function mutation was generated on both alleles in the potential knockout clones. Clones with a frameshift mutation resulting in a premature stop codon on both alleles were considered knockout clones and were used for the experiments described here. Importantly, for the ATP7A_KO clone, 24 white colonies were picked, mini–prepped, and sequenced and the same single base pair deletion was observed in all minis, indicating that both alleles contain the same mutation. The above–mentioned DNA isolation and cloning procedure was also performed on the clonal NDUFA6–null Jurkat cells (see the PCR primer sequences in Supplementary Table 2). For the NDUFA6_KO clone, the same two base pair deletion was observed in all
A
uthor Man
uscr
ipt
A
uthor Man
uscr
ipt
A
uthor Man
uscr
ipt
A
uthor Man
uscr
ipt
24 mini preps prepared indicating that both NDUFA6 alleles contain this mutation. In addition, wildtype and non–targeting Jurkat cells have identical DNA sequences in the region surrounding the ATP7A, SLC45A4, and NDUFA6 sgRNA target sites.
Viability assays
Jurkat cell lines were seeded in 1 mL of media containing the indicated concentrations of PQ in a well of a 24–well plate at a cell density of 300,000 cells/mL. Jurkat cells were either mock treated with ddH2O for the 0 μM PQ condition or treated with 50, 100, or 150 μM PQ
for 7 days, unless otherwise indicated. On day 3 of PQ treatment, Jurkat cells were collected, counted, re–seeded at a cell density of 300,000 cells/mL, and given a fresh concentration of PQ. If there were less than 300,000 cells on day 3, the total amount of cells present were re– seeded and given fresh PQ. After 7 days of PQ treatment, the Jurkat cells were collected. For the Jurkat cell viability assays using MitoPQ, DMNQ, or Tet in combination with PQ, the cells were seeded as mentioned above. On day 3 of treatment with MitoPQ, DMNQ, or Tet in combination with PQ, again the Jurkat cells were collected, counted, re–seeded at a cell density of 300,000 cells/mL, and given a fresh concentration of the drug. In contrast, A549 cells were seeded in 2 mL of media in a well of a 12–well plate at a cell density of 10,000 cells/mL. The next day, the growth media on the A549 cells was replaced with media either mock treated with ddH2O or supplemented with 25, 50, 75, or 100 μM PQ. After 5 days of
PQ treatment, the media and the A549 cells were collected. Flow cytometry was used to assess both Jurkat cell and A549 cell viability. The cells were stained with propidium iodide (PI, Molecular Probes) and resuspended in FACS buffer (1× PBS with 10% Nu Serum IV Growth Medium Supplement, Corning). However, since the reconstituted cell lines express red fluorescent protein (RFP), the reconstituted empty vector (EV) and POR cDNA Jurkat and A549 cells were stained with Ghost Dye (Tonbo Biosciences) or 4′,6–diamidino–2– phenylindole, dihydrochloride (DAPI, Molecular Probes), respectively. The percentage of live cells (live cell viability of singlets) was determined by the exclusion of PI, Ghost, or DAPI using a BD LSRFortessa cell analyzer and FlowJo software (version X.0.7).
Galactose sensitivity assay
NDUFA6–null Jurkat cells growing in their normal culture media (complete RPMI media containing 11.1 mM glucose) were counted by flow cytometry and 300,000 cells were aliquoted into two Eppendorf tubes. The cells were centrifuged and the cell pellets were resuspended in either 1 mL of complete RPMI media containing 11.1 mM glucose or in 1 mL of RPMI media where 11.1 mM galactose was substituted for glucose and 1 mM methyl pyruvate was provided (see the Cell Culture section). Note, the addition of methyl pyruvate helps cells with a mitochondrial complex I defect recycle NAD+. The cells were centrifuged again to remove any residual glucose in the galactose sample. Following centrifugation, the cells were resuspended in 1 mL of either the glucose–containing or galactose–containing RPMI media and seeded in a well of a 24–well plate. On day 4, the cells were collected, stained with propidium iodide (PI, Molecular Probes), and resuspended in FACS buffer (1× PBS with 10% Nu Serum IV Growth Medium Supplement, Corning). The percentage of live cells (live cell viability of singlets) was determined by the exclusion of PI using a BD LSRFortessa cell analyzer and FlowJo software (version X.0.7).
A
uthor Man
uscr
ipt
A
uthor Man
uscr
ipt
A
uthor Man
uscr
ipt
A
uthor Man
uscr
ipt
Reactive oxygen species (ROS) measurements
Intracellular ROS levels were measured in Jurkat and A549 cells using the oxidant–sensitive fluorescent probe 5–(and 6–)chloromethyl–2′,7′–dichlorodihydrofluorescein diacetate, acetyl ester (CM–H2DCFDA, Molecular Probes). Specifically, 300,000 Jurkat cells and
50,000 A549 cells were seeded in a well of a 24–well plate and treated with or without 150 μM PQ or 100 μM PQ, respectively, for 48 hours. Given the increased PQ sensitivity of POR–null cells reconstituted with POR cDNA compared to non–targeting control cells, empty vector (EV)– and POR–reconstituted Jurkat and A549 cells were treated with or without 50 μM PQ or 25 μM PQ, respectively, for 48 hours. 2 hours before the end of PQ treatment, Jurkat cells were collected, centrifuged, and resuspended in growth media containing 5 μM CM–H2DCFDA with or without PQ. A549 cells on the other hand had their
media removed and were provided fresh growth media containing 5 μM CM–H2DCFDA
with or without PQ. After staining Jurkat and A549 cells for 2 hours, the cells were collected, centrifuged, washed with 1× PBS, centrifuged again, and resuspended in 0.2 mL of FACS buffer (1× PBS supplemented with 10% Nu Serum IV Growth Medium
Supplement, Corning). CM–DCF fluorescence was analyzed by flow cytometry. Cells were gated for singlets and the mean fluorescence was obtained using FlowJo analysis software (version X.0.7). To specifically measure intracellular hydrogen peroxide (H2O2) production,
including H2O2 release from cells, the Amplex red hydrogen peroxide/peroxidase assay kit
(Molecular Probes) was used. To assess H2O2 levels in the supernatant, 300,000 Jurkat cells
were treated with or without 150 μM PQ for 48 hours in complete RPMI media depleted of phenol red (Gibco #11835030). The EV– and POR cDNA–reconstituted Jurkat cells were treated with or without 50 μM PQ for 48 hours. After PQ treatment, the cells were collected, centrifuged, and 100 μl of the supernatant was incubated with 100 μl of a working solution of 100 μM Amplex red reagent and 0.2 U/mL horseradish peroxidase for 2 hours. Resorufin fluorescence was measured in a plate reader at 37°C with an excitation of 544 nm and an emission of 590 nm. To assess intracellular H2O2 levels, 300,000 Jurkat cells and 150,000
A549 cells were resuspended in buffer (20 mM Tris, pH 7.4, 250 mM sucrose, and 1 mM EGTA) and permeabilized with saponin (100 μg/mL for Jurkat cells and 150 μg/mL for A549 cells) for 15 minutes at room temperature. Jurkat and A549 cells were treated with or without 150 μM PQ or 100 μM PQ, respectively, for 1 hour in the presence of 50 μM Amplex red solution supplemented with 0.5 U/mL horseradish peroxidase, 200 U/mL superoxide dismutase, and 1 mM NADPH. Resorufin fluorescence was then measured as mentioned above. For all ROS measurements, data were background corrected to the mean value in the corresponding untreated cell line.
SOD activity assay
SOD1 activity was determined using the Superoxide Dismutase Assay kit (Cayman
Chemical). For cell lysate preparation, 2 million Jurkat cells were collected by centrifugation at 1,500 × g for 10 minutes at 4°C. The cell pellets were sonicated in 100 μl of cold 20 mM HEPES buffer, pH 7.2, containing 1 mM EGTA, 210 mM mannitol, and 70 mM sucrose and centrifuged at 1,500 × g for 5 minutes at 4°C. To remove mitochondrial SOD, the
supernatant was collected and centrifuged at 10,000 × g for 15 minutes at 4°C; cytosolic SOD1 was present in the resultant supernatant. A standard curve of SOD1 activity was generated using purified bovine erythrocyte SOD (Cu/Zn). 10 μl of each sample was added
A
uthor Man
uscr
ipt
A
uthor Man
uscr
ipt
A
uthor Man
uscr
ipt
A
uthor Man
uscr
ipt
to a plate with 200 μl of the diluted radical detector containing tetrazolium salt. To initiate the reaction, 20 μl of diluted xanthine oxidase was added to every well. The plate was then covered and placed on a plate shaker at room temperature for 30 minutes to allow the reaction to incubate. The absorbance was read at 440–460 nm using a plate reader. SOD activity in each cell line was calculated using the standard curve as indicated by the manufacturer’s instructions.
Mass spectrometry
For each cell line, 10 million Jurkat cells were seeded at a cell density of 300,000 cells/mL and treated with 150 μM PQ for 24 hours. After PQ treatment, the cells were counted by flow cytometry, using propidium iodide (PI, Molecular Probes) and AccuCount Fluorescent Particles (Spherotech) to determine the total number of live cells. For harvesting the cell lysates, 10 million live cells were collected and centrifuged at 300 × g for 5 minutes at 4°C. The cell pellets were resuspended in 2 mL of cold 1× PBS and centrifuged at 300 × g for 5 minutes at 4°C. 1 mL of cold 1× PBS was then added to each pellet and the cells were transferred to an Eppendorf tube. The tubes were spun down at 3000 rpm for 5 minutes at 4°C. Again, the cell pellets were washed in 1 mL of cold 1× PBS and centrifuged at 3000 rpm for 5 minutes at 4°C. After this third and final wash, the cell pellets were resuspended in 100 μl (2× cell pellet volume) of extraction buffer (80% methanol/20% HPLC grade water). The cells were immediately placed at –80°C for 10 minutes and freezethawed three times for cell lysis. During each thaw cycle, the samples were vortexed vigorously. After the final freeze–thaw, the samples were centrifuged at 16,000 × g for 15 minutes at 4°C. The supernatant (cell lysate) was transferred to a new Eppendorf tube for analysis of PQ uptake by mass spectrometry. Specifically, the samples were analyzed by high resolution HPLC– MS/MS using a Q–Exactive (Thermo) in line with an electrospray source and an
Ultimate3000 (Thermo) series HPLC consisting of a binary pump, degasser, and
autosampler outfitted with a Kinetex HILIC column (Phenomenex; dimensions of 2.1 mm × 100 mm and a 2.6 μm particle size). The mobile phase was a 50:50 mixture of aqueous solution (200 mM ammonium formate buffer at pH 3.7) and organic solution (acetonitrile) at a flow rate of 0.4 mL/min. The capillary of the electrospray ionization (ESI) source was set to 275°C, with the sheath gas set to 45 arbitrary units and the spray voltage set to 3.0 kV. In negative polarity mode, MS1 data was collected at a resolution of 70,000 with a selective ion monitoring (SIM) at m/z 185.107. The precursor ion was subsequently fragmented using the higher energy collisional dissociation (HCD) cell set to NCE 30 in MS2 for a resolution of 35,000. The fragmentation pattern, together with the LC–MS chromatography and spectrum from the PQ standard, was used to confirm the detected peak as PQ. Peak area of m/z 185.107 was integrated for comparison between samples.
Statistical analysis
Data are presented as the mean ± SEM. Since the effect size was large (e.g. Figure 1a, the mean viability of untreated wildtype Jurkat cells on day 7 was ~95%, while the mean viability of wildtype Jurkat cells treated with 150 μM PQ on day 7 was ~27%), n=4 independent experiments were performed to ensure adequate power based on a β of 0.9. Samples were not excluded from the analysis, randomization did not occur, and investigators were not blinded. Statistical significance was determined using one–way ANOVA with a
A
uthor Man
uscr
ipt
A
uthor Man
uscr
ipt
A
uthor Man
uscr
ipt
A
uthor Man
uscr
ipt
Bonferroni posttest correction, two–way ANOVA when two variables were present, or the Student’s t test (GraphPad Prism software, version 7) comparing control cells to
experimental cells. Statistical significance was determined at the 0.05 level. For each figure, the statistical tests were justified as appropriate, the data was assumed to have a normal distribution, and the standard deviations were compared between groups before analysis through statistical tests to ensure equal variance.
Code availability
The algorithm used to analyze the deep sequencing results has been published previously [40].
Data availability
The authors declare that all data supporting the findings of this study are available within the paper and its supplementary information file. No data sets were generated or analyzed during this study.
Supplementary Material
Refer to Web version on PubMed Central for supplementary material.
Acknowledgments
We thank the Genome Technology Core of the Whitehead Institute for deep sequencing the genomic DNA samples. We thank the Flow Cytometry Core of Northwestern University for providing the BD LSRFortessa cell analyzer to assess cell viability. We are grateful to Dr. Michael P. Murphy for providing us MitoParaquat. This work was supported by a National Institute of Aging grant (5P01AG049665) to N.S.C. C.R.R. was supported by a National Institutes of Health postdoctoral training grant (T32 HL076139-11). H.K. was supported by a National Institutes of Health pre-doctoral training grant (T32 CA9560-30). K.B. was supported by grants from the National Institutes of Health (K22 CA1936600), a Searle Scholar Award, an Irma T. Hirschl/Monique Weill-Caulier Trust Award, and the Sidney Kimmel Foundation. D.M.S. is an investigator of the Howard Hughes Medical Institute.
References
1. Dinis–Oliveira RJ, et al. Paraquat poisonings: mechanisms of lung toxicity, clinical features, and treatment. Crit Rev Toxicol. 2008; 38:13–71. [PubMed: 18161502]
2. Suntres ZE. Role of antioxidants in paraquat toxicity. Toxicology. 2002; 180:65–77. [PubMed: 12324200]
3. Blanco–Ayala T, Andérica–Romero AC, Pedraza–Chaverri J. New insights into antioxidant strategies against paraquat toxicity. Free Radic Res. 2014; 48:623–640. [PubMed: 24593876] 4. Kamel F. Paths from pesticides to Parkinson’s. Science. 2013; 341:722–723. [PubMed: 23950519] 5. Franco R, Li S, Rodriguez–Rocha H, Burns M, Panayiotidis MI. Molecular mechanisms of
pesticide–induced neurotoxicity: relevance to Parkinson’s disease. Chem Biol Interact. 2010; 188:289–300. [PubMed: 20542017]
6. Pezzoli G, Cereda E. Exposure to pesticides or solvents and risk of Parkinson disease. Neurology. 2013; 80:2035–2041. [PubMed: 23713084]
7. Tanner CM, et al. Rotenone, paraquat, and Parkinson’s disease. Environ Health Perspect. 2011; 119:866–872. [PubMed: 21269927]
8. Wang A, et al. Parkinson’s disease risk from ambient exposure to pesticides. Eur J Epidemiol. 2011; 26:547–555. [PubMed: 21505849]
A
uthor Man
uscr
ipt
A
uthor Man
uscr
ipt
A
uthor Man
uscr
ipt
A
uthor Man
uscr
ipt
9. Manning–Bog AB, et al. The herbicide paraquat causes up–regulation and aggregation of alpha– synuclein in mice: paraquat and alpha–synuclein. J Biol Chem. 2002; 277:1641–1644. [PubMed: 11707429]
10. McCormack AL, et al. Environmental risk factors and Parkinson’s disease: selective degeneration of nigral dopaminergic neurons caused by the herbicide paraquat. Neurobiol Dis. 2002; 10:119– 127. [PubMed: 12127150]
11. Hong SY, Lee JS, Sun IO, Lee KY, Gil HW. Prediction of patient survival in cases of acute paraquat poisoning. PLoS One. 2014; 9:e111674. [PubMed: 25415592]
12. Cochemé HM, Murphy MP. Chapter 22 The uptake and interactions of the redox cycler paraquat with mitochondria. Methods Enzymol. 2009; 456:395–417. [PubMed: 19348901]
13. Cochemé HM, Murphy MP. Complex I is the major site of mitochondrial superoxide production by paraquat. J Biol Chem. 2008; 283:1786–1798. [PubMed: 18039652]
14. Gray JP, et al. Paraquat increases cyanide–insensitive respiration in murine lung epithelial cells by activating an NAD(P)H:paraquat oxidoreductase: identification of the enzyme as thioredoxin reductase. J Biol Chem. 2007; 282:7939–7949. [PubMed: 17229725]
15. Shimada H, Hirai K, Simamura E, Pan J. Mitochondrial NADH–quinone oxidoreductase of the outer membrane is responsible for paraquat cytotoxicity in rat livers. Arch Biochem Biophys. 1998; 351:75–81. [PubMed: 9500851]
16. Yee C, Yang W, Hekimi S. The intrinsic apoptosis pathway mediates the pro–longevity response to mitochondrial ROS in C. elegans. Cell. 2014; 157:897–909. [PubMed: 24813612]
17. Shukla AK, et al. Heat shock protein–70 (Hsp–70) suppresses paraquat–induced neurodegeneration by inhibiting JNK and caspase–3 activation in Drosophila model of Parkinson’s disease. PLoS One. 2014; 9:e98886. [PubMed: 24887138]
18. Rao SS, et al. Suberoylanilide hydroxamic acid attenuates paraquat–induced pulmonary fibrosis by preventing Smad7 from deacetylation in rats. J Thorac Dis. 2016; 8:2485–2494. [PubMed: 27747000]
19. Sun IO, Shin SH, Yoon HJ, Lee KY. Predicting the probability of survival in acute paraquat poisoning. Kidney Res Clin Pract. 2016; 35:102–106. [PubMed: 27366665]
20. Birsoy K, et al. An essential role of the mitochondrial electron transport chain in cell proliferation is to enable aspartate synthesis. Cell. 2015; 162:540–551. [PubMed: 26232224]
21. Wang M, et al. Three–dimensional structure of NADPH–cytochrome P450 reductase: prototype for FMN– and FAD–containing enzymes. Proc Natl Acad Sci USA. 1997; 94:8411–8416. [PubMed: 9237990]
22. Dierick HA, Adam AN, Escara–Wilke JF, Glover TW. Immunocytochemical localization of the Menkes copper transport protein (ATP7A) to the trans–Golgi network. Hum Mol Genet. 1997; 6:409–416. [PubMed: 9147644]
23. Petris MJ, Mercer JF. The Menkes protein (ATP7A; MNK) cycles via the plasma membrane both in basal and elevated extracellular copper using a C–terminal di–leucine endocytic signal. Hum Mol Genet. 1999; 8:2107–2115. [PubMed: 10484781]
24. He L, Vasiliou K, Nebert DW. Analysis and update of the human solute carrier (SLC) gene superfamily. Hum Genomics. 2009; 3:195–205. [PubMed: 19164095]
25. Rhee SG, Chang TS, Jeong W, Kang D. Methods for detection and measurement of hydrogen peroxide inside and outside of cells. Mol Cells. 2010; 29:539–549. [PubMed: 20526816] 26. Robb EL, et al. Selective superoxide generation within mitochondria by the targeted redox cycler
MitoParaquat. Free Radic Biol Med. 2015; 89:883–894. [PubMed: 26454075]
27. Huang CP, Fofana M, Chan J, Chang CJ, Howell SB. Copper transporter 2 regulates intracellular copper and sensitivity to cisplatin. Metallomics. 2014; 6:654–661. [PubMed: 24522273]
28. Krall J, Bagley AC, Mullenbach GT, Hallewell RA, Lynch RE. Superoxide mediates the toxicity of paraquat for cultured mammalian cells. J Biol Chem. 1988; 263:1910–1914. [PubMed: 2828357] 29. Kuo YM, Zhou B, Cosco D, Gitschier J. The copper transporter CTR1 provides an essential
function in mammalian embryonic development. Proc Natl Acad Sci USA. 2001; 98:6836–6841. [PubMed: 11391004]
A
uthor Man
uscr
ipt
A
uthor Man
uscr
ipt
A
uthor Man
uscr
ipt
A
uthor Man
uscr
ipt
30. Zelko IN, Mariani TJ, Folz RJ. Superoxide dismutase multigene family: a comparison of the CuZn–SOD (SOD1), Mn–SOD (SOD2), and EC–SOD (SOD3) gene structures, evolution, and expression. Free Radic Biol Med. 2002; 33:337–349. [PubMed: 12126755]
31. Van Remmen H, et al. Multiple deficiencies in antioxidant enzymes in mice result in a compound increase in sensitivity to oxidative stress. Free Radic Biol Med. 2004; 36:1625–1634. [PubMed: 15182862]
32. Saito M, Thomas CE, Aust SD. Paraquat and ferritin–dependent lipid peroxidation. J Free Radic Biol Med. 1985; 1:179–185. [PubMed: 3939139]
33. Han JF, Wang SL, He XY, Liu CY, Hong JY. Effect of genetic variation on human cytochrome p450 reductase–mediated paraquat cytotoxicity. Toxicol Sci. 2006; 91:42–48. [PubMed: 16495354]
34. Kelner MJ, Bagnell R. Paraquat resistance associated with reduced NADPH reductase in an energy–dependent paraquat–accumulating cell line. Arch Biochem Biophys. 1989; 274:366–374. [PubMed: 2802616]
35. Clejan L, Cederbaum AI. Synergistic interactions between NADPH–cytochrome P–450 reductase, paraquat, and iron in the generation of active oxygen radicals. Biochem Pharmacol. 1989; 38:1779–1786. [PubMed: 2500125]
36. Dinis–Oliveira RJ, et al. Paraquat exposure as an etiological factor of Parkinson’s disease. Neurotoxicology. 2006; 27:1110–1122. [PubMed: 16815551]
37. Isshihara Y, Shiba D, Shimamoto N. Enhancement of DMNQ–induced hepatocyte toxicity by cytochrome P450 inhibition. Toxicol Appl Pharmacol. 2006; 214:109–117. [PubMed: 16430935] 38. Ran FA, et al. Genome engineering using the CRISPR–Cas9 system. Nat Protoc. 2013; 8:2281–
2308. [PubMed: 24157548]
39. Cong L, et al. Multiplex genome engineering using CRISPR/Cas systems. Science. 2013; 339:819– 823. [PubMed: 23287718]
40. Wang T, Wei JJ, Sabatini DM, Lander ES. Genetic screens in human cells using the CRISPR–Cas9 system. Science. 2014; 343:80–84. [PubMed: 24336569]
A
uthor Man
uscr
ipt
A
uthor Man
uscr
ipt
A
uthor Man
uscr
ipt
A
uthor Man
uscr
ipt
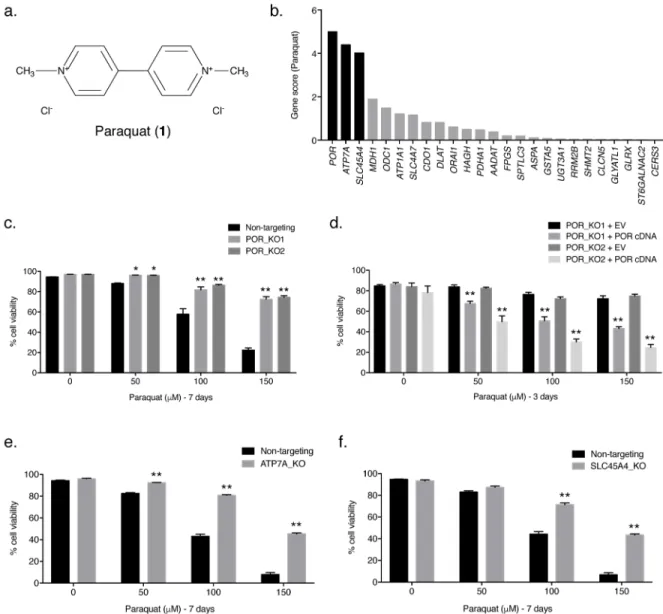
Figure 1. POR, ATP7A, and SLC45A4 are essential for PQ-induced cell death
(a) Structure of paraquat (PQ; 1). (b) The gene scores for the top 25 genes following treatment with 110 μM PQ. POR is the best scoring gene, followed by ATP7A and
SLC45A4. (c) Two clonal POR-null Jurkat cell lines (POR_KO1 and POR_KO2) and a non-targeting control cell line were treated with varying concentrations of PQ for 7 days and the percentage of cellular viability was assessed. (d) Live cell viability was determined following treatment with varying concentrations of PQ for 3 days in two POR-null Jurkat clones reconstituted with either empty vector (EV) or POR cDNA. (e) Clonal ATP7A-null Jurkat cells (ATP7A_KO) and non-targeting control Jurkat cells were treated with the indicated concentrations of PQ for 7 days and live cell viability was assessed. (f) Clonal SLC45A4-null Jurkat cells (SLC45A4_KO) and non-targeting control Jurkat cells were treated with the indicated concentrations of PQ for 7 days and live cell viability was assessed. For c–f, error bars represent SEM (n=4 independent experiments). *, p < 0.05, and **, p < 0.01, compared to control cells.
A
uthor Man
uscr
ipt
A
uthor Man
uscr
ipt
A
uthor Man
uscr
ipt
A
uthor Man
uscr
ipt
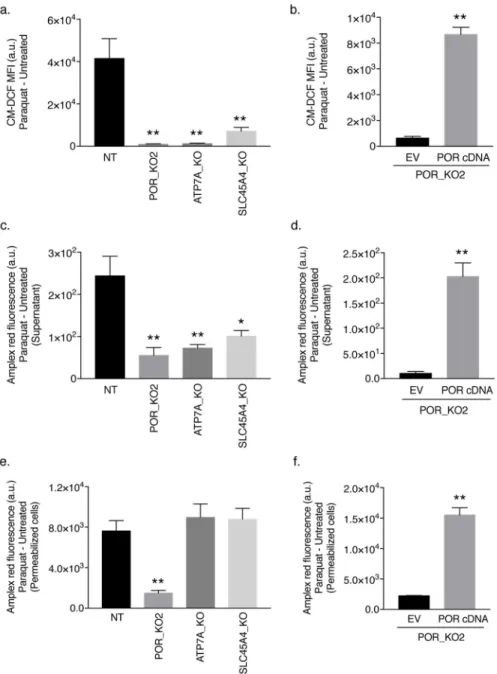
Figure 2. POR is necessary for PQ-induced cytosolic ROS generation
(a) Non-targeting (NT) control, POR-null, ATP7A-null, and SLC45A4-null Jurkat cells were treated with 150 μM PQ for 48 hours and intracellular ROS levels were determined as the mean fluorescence intensity (MFI) of CM–DCF. (b) Intracellular ROS levels were measured in empty vector (EV)- or human POR cDNA-reconstituted POR-null Jurkat cells (clone POR_KO2) treated with 50 μM PQ for 48 hours. (c) Extracellular H2O2 levels were
measured by Amplex red in non-targeting (NT) control, POR-null, ATP7A-null, and SLC45A4-null Jurkat cells following 150 μM PQ for 48 hours. (d) The levels of
extracellular H2O2 following treatment with 50 μM PQ for 48 hours were measured in the
POR_KO2 clone reconstituted with the empty vector (EV) or human POR cDNA. (e) Amplex red was used to measure intracellular H2O2 production in saponin-permeabilized non-targeting (NT) control Jurkat cells as well as POR-null, ATP7A-null, and
SLC45A4-A
uthor Man
uscr
ipt
A
uthor Man
uscr
ipt
A
uthor Man
uscr
ipt
A
uthor Man
uscr
ipt
null Jurkat cells treated with 150 μM PQ for 1 hour. (f) Intracellular H2O2 levels were
measured in saponin-permeabilized POR-null Jurkat cells (clone POR_KO2) reconstituted with the empty vector (EV) or human POR cDNA following treatment with 150 μM PQ for 1 hour. For all panels, error bars represent SEM (n=4 independent experiments). *, p < 0.05, and **, p < 0.01, compared to control cells. Data were background-corrected to the mean value in untreated cells.
A
uthor Man
uscr
ipt
A
uthor Man
uscr
ipt
A
uthor Man
uscr
ipt
A
uthor Man
uscr
ipt
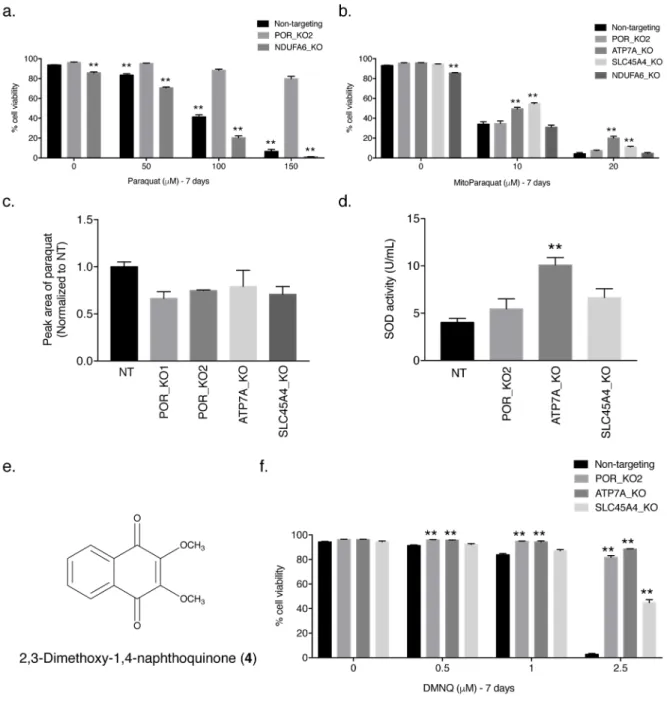
Figure 3. Mitochondrial complex I is not necessary for PQ-induced cell death
(a) Non-targeting control, clonal POR-null (POR_KO2), and clonal NDUFA6-null (NDUFA6_KO) Jurkat cells were treated with varying concentrations of PQ for 7 days and the percentage of cellular viability was assessed. For statistical analysis, the POR_KO2 cells were compared. (b) Live cell viability was determined following treatment with varying concentrations of mitochondrially targeted paraquat (MitoPQ) for 7 days in non-targeting control Jurkat cells as well as clonal POR-null, ATP7A-null, SLC45A4-null, and NDUFA6-null Jurkat cells. (c) Non-targeting (NT) control, POR-NDUFA6-null, ATP7A-NDUFA6-null, and SLC45A4-NDUFA6-null Jurkat cells were treated with 150 μM PQ for 24 hours and PQ uptake into the cells was analyzed by high performance liquid chromatography tandem mass spectrometry (HPLC– MS/MS). Results are normalized to non-targeting control Jurkat cells. (d) SOD activity
A
uthor Man
uscr
ipt
A
uthor Man
uscr
ipt
A
uthor Man
uscr
ipt
A
uthor Man
uscr
ipt
(U/mL) was measured in non-targeting (NT) control Jurkat cells as well as clonal POR-null, ATP7A-null, and SLC45A4-null Jurkat cells. (e) Structure of
2,3-dimethoxy-1,4-naphthoquinone (DMNQ; 4). (f) Live cell viability was determined following treatment with varying concentrations of the redox cycler and pro–oxidant DMNQ for 7 days in non-targeting control, POR-null, ATP7A-null, and SLC45A4-null Jurkat cells. For a–d and f, error bars represent SEM (n=4 independent experiments for a,b,d,f; n=3 independent experiments for c). **, p < 0.01 compared to control cells.
A
uthor Man
uscr
ipt
A
uthor Man
uscr
ipt
A
uthor Man
uscr
ipt
A
uthor Man
uscr
ipt
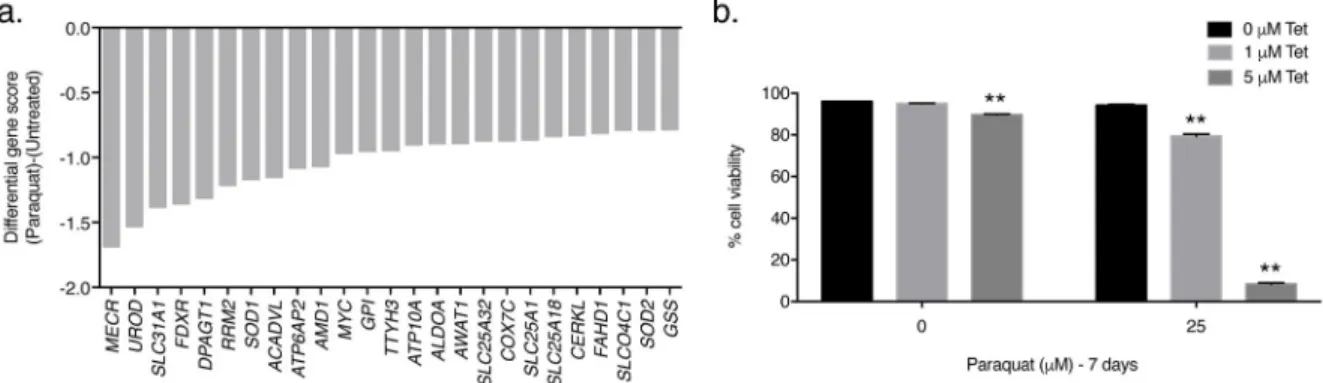
Figure 4. PQ negative-selection CRISPR-based screen
(a) The gene scores as differentially required for the top 25 genes following treatment with 25 μM PQ. The copper transporter gene SLC31A1 and the copper-dependent antioxidant gene SOD1 were among the top genes identified. (b) Wild-type Jurkat cells were treated with varying concentrations of the copper-chelating agent 2,3,2-tetraamine (Tet; 5) in the presence or absence of 25 μM PQ for 7 days and the percentage of cellular viability was assessed. Error bars represent SEM (n=4 independent experiments). **, p < 0.01 compared to the 0 μM Tet condition within each PQ treatment group.