HAL Id: hal-02595422
https://hal.inrae.fr/hal-02595422
Submitted on 15 May 2020
HAL is a multi-disciplinary open access
archive for the deposit and dissemination of
sci-entific research documents, whether they are
pub-L’archive ouverte pluridisciplinaire HAL, est
destinée au dépôt et à la diffusion de documents
scientifiques de niveau recherche, publiés ou non,
multifunctional land use activities on national and
regional scales. Deliverable n° D1.3
Diana Kopeva, K. Brscic, A. Dobruchowski, R. Franic, G. Garrod, B.
Hautdidier, M. Konecna, R. Laplana, A. Ostermeyer, M. Peneva, et al.
To cite this version:
Diana Kopeva, K. Brscic, A. Dobruchowski, R. Franic, G. Garrod, et al.. Socio-economic
charac-teristics of case study sites (regions and laus) and alternative scenarios for multifunctional land use
activities on national and regional scales. Deliverable n° D1.3. [Research Report] irstea. 2010, pp.172.
�hal-02595422�
(
REGIONS AND
LAU
S
)
AND ALTERNATIVE SCENARIOS FOR
MULTIFUNCTIONAL LAND USE ACTIVITIES ON NATIONAL
AND REGIONAL SCALES
Deliverable no. D1.3
Diana Kopeva, Kristina Brščić, A. Dobruchowski, Ramona Franić, Guy Garrod, Baptiste Hautdidier, Marta Konecna, Ramon Laplana, Arlette Ostermeyer,
Maria Peneva, Marian Raley, Amanda Sahrbacher Partners: UNWE, AFSZ, UZEI, CEMAGREF, IAMO, UNEW Submission date: 25-Jun-10
Seventh Framework Programme Theme 6 (ENV-2007-1)
Environment (including climate change)
Collaborative project (Small or medium-scale focused research project) Grant agreement no. : 212345
PRIMA aims to develop a method for scaling down the analysis of policy impacts on multifunctional land uses and on the economic activities. The scoped policies will include the cohesion policy (ERDF, ESF, CF), the enlargement process (IPA) & the rural development policy (EAFRD) of the European Commission, with a special focus on agriculture, forestry, tourism, and ecosystem services. The approach will: rely on micro-simulation and multi-agents models, designed and validated at municipality level, using input from stakeholders; address the structural evolution of the populations (appearance, disappearance and change of agents) depending on the local conditions for applying the structural policies on a set of municipality case studies. Involving eleven partners, the project is coordinated by Cemagref. Email: ramon.laplana@cemagref.fr & nadine.turpin@cemagref.fr
Internet: https://prima.cemagref.fr
Authors of this report and contact details Name: Diana Kopeva, Mariya Peneva Partner acronym: UNWE
Address: Studentski Grad "Hristo Botev" 1700, Sofia, BULGARIA
E-mail: dkopeva@unwe.acad.bg, peneva_mm@yahoo.co.uk
Name: Kristina Brščić, Ramona Franić Partner acronym: AFSZ
Address: Trg Marsala Tita 14 10000, Zagreb, CROATIA E-mail: mnjavro@agr.hr
Name: Marta Konecna Partner acronym: UZEI Address: 75, Mánesova
120 58, Prague, CZECH REPUBLIC E-mail: konecna.marta@uzei.cz
Name: Omar Baqueiro, Amanda Sahrbacher, A. Ostermeyer Partner acronym: IAMO
Address: Theodor-Lieser-strasse 2 06120, Halle (Saale), GERMANY
E-mail: baqueiro@iamo.de, osuch@iamo.de
Name: Ramon Laplana, Baptiste Hautdidier Partner acronym: CEMAGREF
Address:
50, av. de Verdun, Gazinet 33612 Cestas Cedex, FRANCEE-mail: ramon.laplana@cemagref.fr, baptiste.hautdidier@cemagref.fr
Name: Guy Garrod, Marian Raley Partner acronym: UNEW
Address: Agriculture Building, Newcastle University, Kings Road (room 208) NE1 7RU, Newcastle Upon Tyne, UNITED KINGDOM
If you want to cite a Public Deliverable that originally was meant for use within the project only, please make sure you are allowed to disseminate or cite this report. If so, please cite as follows:
Diana Kopeva, Kristina Brščić, A.Dobruchowski, Ramona Franić, Guy Garrod, Baptiste Hautdidier, Marta Konecna, , Ramon Laplana , A. Ostermeyer, Maria Peneva, Marian Raley, Amanda Sahrbacher 2011. Socio-economic characteristics of case study sites (regions and LAUs) and alternative scenarios for multifunctional land use activities on national and regional scales PD no. D1.3 PRIMA collaborative project, EU 7th Framework Programme, contract no. 212345, https://prima.cemagref.fr, 169 p.
D
ISCL AI ME R―This publication has been funded under the PRIMA collaborative project, EU 7th Framework Programme, Theme 6 (ENV 2007-1) Environment (including climate change) European Commission, DG Research, contract no. 212345. Its content does not represent the official position of the European Commission and is entirely under the responsibility of the authors.‖
―The information in this document is provided as is and no guarantee or warranty is given that the information is fit for any particular purpose. The user thereof uses the information at its sole risk and liability.‖
G
ENERAL IN FORMATI ON Task(s) code(s): D 1.3Input from (Task codes): T1.4
Output to (Task codes): T2.1.2, T2.2.1, T3.2, T3.7, T4.3, T4.4, T5.3
Related milestones: M2.2.2, M2.2.3, M3.10, M3.11, M4.1, M4.3, M5.1, M5.3,M5.4
C
ONTACTS Diana Kopeva UNWEStudentski Grad "Hristo Botev" 1700, Sofia, BULGARIA
TABLE
OF
CONTENTS
1 Social economic analysis of the North-Central planning region of
Bulgaria ... 14 1.1 General characteristics ... 15 1.2 Demographic trends ... 24 1.3 Economic system ... 28 1.4 Transport ... 41 1.5 Environment ... 42 1.6 References ... 45
2 Social economic analysis of the County of Istria ... 46
2.1 General characteristics ... 46 2.2 Demographic trends ... 53 2.3 Economic system ... 54 2.4 Transport ... 61 2.5 Environment ... 63 2.6 References ... 63
3 Social economic analysis of the South Moravian Region ... 66
3.1 General characteristics ... 66 3.2 Demographic trends ... 73 3.3 Economic system ... 78 3.4 Transport ... 84 3.5 Environment ... 85 3.6 References ... 87 3.7 Appendices ... 88
4 Social economic analysis of the Auvergne Region ... 92
4.2 Demographic trends ... 96
4.3 Economic system ... 99
4.4 Transport ... 107
4.5 Environment ... 108
4.6 References ... 110
5 Social economic analysis of the Altmark Region ... 111
5.1 General characteristics ... 111 5.2 Demographic trends ... 115 5.3 Economic system ... 121 5.4 Transport ... 136 5.5 Environment ... 138 5.6 References ... 138
6 Social economic analysis of the Derbyshire/Nottinghamshire case study region ... 139 6.1 General characteristics ... 140 6.2 Demographic trends ... 144 6.3 Economic system ... 149 6.4 Transport ... 157 6.5 Environment ... 158 6.6 References ... 159 7 Alternative scenarios ... 161 7.1 Introduction ... 161
7.2 What is scenario and scenario planning? ... 161
7.3 Process of scenario planning ... 162
7.4 PRIMA alternative scenarios ... 162
FIGURES
Figure 1 | Map of Bulgaria by region ... 16
Figure 2 | Map of North Central Planning region by districts ... 18
Figure 3 | Map of Veliko Tarnovo District by municipalities ... 18
Figure 4| Map of Gabrovo District by municipalities... 19
Figure 5 | Map of Ruse District by municipalities ... 20
Figure 6 | Map of Razgrad District by municipalities ... 20
Figure 7 | Map of Silistra District by municipalities ... 21
Figure 8 | Designation of Rural Areas at NUTS 2 Level Using the OECD Methodology ... 22
Figure 9 | Designation of Rural Areas at LAU 1 Level Using the National Definition ... 23
Figure 10 | Gross Value Added by economic sectors, 2006 ... 28
Figure 11 | NCPR: Registered Agricultural Producers ... 31
Figure 12. NCPR: Utilized Agricultural Area and Arable Land in 2008 ... 31
Figure 13 | Average UAA ... 32
Figure 14 A and 14B Utilized agricultural area by type and district in 2007 ... 33
Figure 15 A and 15B | Hotels and accommodation establishments and spent nights by region in 2007 ... 38
Figure 16A and 16B | Forest area by region and districts in NCPR in 2007 ... 39
Figure 17 | Map of Bulgarian Breeding Stations ... 40
Figure 18 | Protected Areas (NATURA 2000), approved by the Council of Ministers, December 2007 ... 43
Figure 19 | NCPR: Protected areas and areas in NATURA 2000 by districts, 2007 ... 44
Figure 20 | Protected areas and areas in NATURA2000 as a share of the total area by districts ... 44
Figure 21 | Towns and municipalities of Istrian County ... 48
Figure 22 | Government of Istria County ... 49
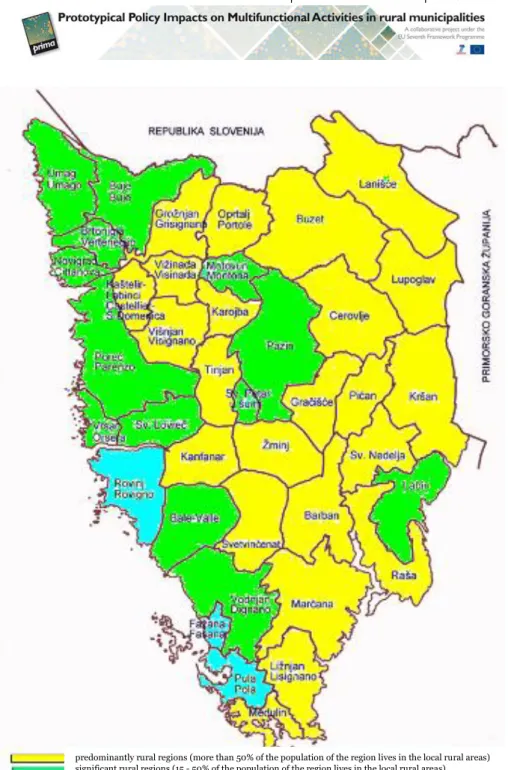
Figure 23 | Rural and urban areas according to OECD criteria ... 50
Figure 24 | Rural and urban areas according to OECD criteria (>150 residents/km2) ... 51
Figure 26 | Administrative regions of the Czech Republic ... 66
Figure 27 | South Moravia, situation map ... 67
Figure 28 | Land Use structure in the South Moravian Region. Resource: Czech Statistical Office ... 68
Figure 29 | Inhabitants per square kilometre in the South Moravian Region in 2007. Resource: CSO-Small Lexicon of Municipalities 2007, own calculation ... 71
Figure 30 | Categories of integrity - according to share on employment of SMR. Resource: data CSO 2007, own calculation ... 73
Figure 31 | Number of inhabitants in the municipalities of the South Moravian Region in 2007. Resource: CSO-Small Lexicon of Municipalities 2007, own calculation ... 74
Figure 32 | Share of inhabitants in age 15-64 in the South Moravian Region in 2007. Resource: CSO-Small Lexicon of Municipalities 2007, own calculation ... 76
Figure 33 | Education structure of people more than 15 years old in the SMR in 2007. Resource: Czech Statistical Office ... 77
Figure 34 | Area under the farm crops in 2007: a. in the Czech Republic; b. in the South Moravian Region. Resource: data - Czech Statistical Office ... 82
Figure 35 | Schematic map of Auvergne region, with NUTS3 & relief ... 92
Figure 36 | Comparison of two rural/urban typologies of Auvergne's LAU2 ... 95
Figure 37 | Population pyramid of Auvergne (2004). ... 97
Figure 38 | Number of beneficiaries of work-study programs ... 98
Figure 39 | Evolution of unemployment in France and metropolitan France from 2000 to 2009 (100 as the arbitrary basis in january 2000). Source: Dares, DRTEFP Auvergne, in (INSEE Auvergne, 2009) ... 101
Figure 40 | Attendance of the main tourism sites of Auvergne in 2001. Adapted from (INSEE Auvergne, 2002). ... 104
Figure 41 | Number of marketed ―beds‖ (hotels and campings) in Auvergne (thousands). Sources : Insee ; ministère délégué au Tourisme, direction du Tourisme ... 104
Figure 42 | Map of Germany illustrating NUTS 1 and NUTS 2 levels. ... 112
Figure 43 | Map of the Altmark region ... 114
Figure 44 | Development of births in Sachsen-Anhalt since the end of World War II. ... 117
Figure 45 | Age pyramid for Sachsen-Anhalt in 2005 (left) and 2025 (right, projection) .. 118
Figure 46 | Demographic development in the Altmark between 1990 and 2007 (% of total population in 1997). ... 121
Figure 47 | Average size in terms of employees in processing enterprises in Sachsen-Anhalt in 2004 ... 122
Figure 48 | Economic structure of Sachsen-Anhalt in 2008 – proportion of regional GDP123
Figure 49 | GDP per head in Euros in 2002 in the different districts of Sachsen-Anhalt .. 124
Figure 50 | Proportion of people employed in agriculture (per 1,000 inhabitants) ... 125
Figure 51 | Development of the balance of commuters (per 1,000 inhabitants) ... 126
Figure 52 | Age structure of the active population in Sachsen-Anhalt ...127
Figure 53 | Unemployment in the Altmark and Sachsen-Anhalt (per 1,000 inhabitants) . 128 Figure 54 | Employment in the industrial sector in firms of more than 20 employees in the Altmark and Sachsen-Anhalt (per 1,000 inhabitants) ... 129
Figure 55 | Area under different crops in 2007 in Sachsen-Anhalt ... 130
Figure 56 | Area under different crops in 2007 in the Altmark ... 130
Figure 57 | Classification of touristic zones in Sachsen-Anhalt as regards attractiveness and quality of infrastructures ... 133
Figure 58 | Regional distribution of accommodation offers in 2007 in Sachsen-Anhalt.... 134
Figure 59 | Number of companies owning forest land in the Altmark and Sachsen-Anhalt.135 Figure 60 | Area of forests managed by different companies in the Altmark ... 136
Figure 61 | Local government in the East Midlands Region ... 142
Figure 62. Journey to work movements ... 158
Figure 63 | Scenario A: Complex impact of IDF ... 164
Figure 64 | Scenario A: Complex impact of EDF ... 164
Figure 65 | Scenario A: Combined impact of driving forces ... 165
Figure 66 | Scenario B: Complex impact of IDF... 166
Figure 67 | Scenario B: Complex impact of EDFs ... 166
Figure 68 | Scenario B: Combined Impact of DFs ... 166
Figure 69 | Scenario C: Complex impact of EDFs ... 167
Figure 70 | Scenario C: Complex impact of IDFs ... 167
Figure 71 | Scenario C: Combined impact of DFs ... 167
Figure 72 | Scenario D: Complex impact of EDFs ... 168
Figure 73 | Scenario D: Complex impact of IDFs ... 168
T
ABLES
Table 1 | Employed by economic sectors (thousands) ... 17
Table 2 | Indicators for the demographic, social and economic development of the planning regions and districts (2007) ... 17
Table 3 | Settlements Characteristics in NCPR ... 22
Table 4 | General Population and Quality of Life Indicators in NCPR ... 24
Table 5 | Population Distribution in NCPR by Age and Sex – 2006 ... 25
Table 6 | Kindergartens, schools, universities, teachers and students by districts in NCPR, 2007 ... 26
Table 7 | Education Level* in Bulgaria – 2007 ... 26
Table 8 | Migration Flows, 2007 ... 27
Table 9 | Gross Value Added by economic sectors ... 29
Table 10 | Production of the industrial enterprises and establishments by activity groupings, 2007 (in %) ... 29
Table 11 | Employed persons by level of education and district in NCPR, 2007 ... 30
Table 12 | Holdings in Bulgaria by farm type and planning regions, 2007 ... 32
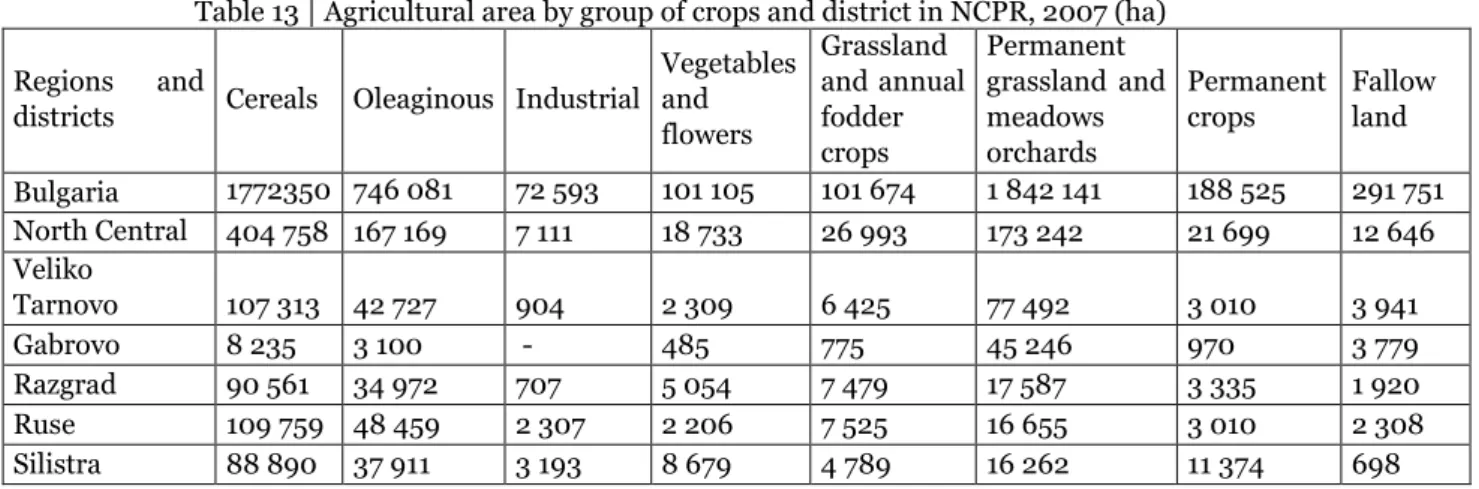
Table 13 | Agricultural area by group of crops and district in NCPR, 2007... 36
Table 14 | Area and production of main crops by region in 2007 ... 36
Table 15 | Rural and urban areas according to OECD and EU criteria ... 51
Table 16 | Number of inhabitants in Republic of Croatia and County of Istria form 1961 to 2001 ... 53
Table 17 | Age groups of the population of Istrian County ... 53
Table 18 | Gross domestic product per capita in the Republic of Croatia and County of Istria in the period 2001 - 2006 ... 55
Table 19 | Average number of unemployed persons ... 56
Table 20 | Persons in employment and unemployment rate, situation as on 31 March ... 56
Table 21 | Number of households, business entities and utilized agricultural land in the Republic of Croatia and County of Istria ... 57
Table 22 | Number of agricultural family farms according to organizational form ... 57
Table 23 | The structure of farms and land in possession in 2009, in the County of Istria and Republic of Croatia ... 58
Table 24 | Tourist arrivals and nights in Republic of Croatia and County of Istria ... 59
Table 25 | Tourist nights in County of Istria and Republic of Croatia (in the period I-XII. 2008) ... 60
Table 26 | Usage of hotel capacity of Republic of Croatia and County of Istria (in the period I-XII 2008) in % ... 60
Table 27 | Situation of forest management in Istria County ... 61
Table 28 | Density of roads on national level and Istrian County level ... 62
Table 29 | Delimitation of rural area according to Czech approach ... 69
Table 30 | Delimitation according to the OECD on level LAU 2 ... 70
Table 31 | Delimitation according to OECD on level LAU1 ... 70
Table 32 | Delimitation according to the OECD on level LAU1 -Districts in the South Moravian Region ... 71
Table 33 | Delimitation of the categories of integration on level LAU 1 ... 72
Table 34 | Long-term development of the population in the South Moravian Region ... 73
Table 35 | Regional structure of municipalities of the South Moravian Region ... 74
Table 36 | Long term development of age structure in the South Moravian Region ... 76
Table 37 | Population (LFSS) by educational attainment in the SMR ... 77
Table 38 | Long term development of building activity in the SMR ... 78
Table 39 | Structure of enterprises and employment in 2007 in the South Moravian Region79 Table 40 | Unemployment in the South Moravian Region in relation to rate of integration of districts ...80
Table 41 | Area of agricultural holdings by legal forms in 2007 in the South Moravian Region ... 81
Table 42 | Size difference of agricultural holdings in 2007 in the South Moravian Region . 81 Table 43 | Structure of livestock in the South Moravian Region ... 82
Table 44 | Development of structure of accommodation establishments in the South Moravian Region ... 83
Table 45 | Development of forestry in the South Moravian Region ... 84
Table 46 | Structure and size of road in the districts of the South Moravian Region in 200884 Table 47 | Protected areas in 2007 in the South Moravian Region ... 85
Table 48 | Long term development of investment in the environment in the South Moravian Region ... 85
Table 49 | Comparison of emissions in 1995 and 2006 in SMR and CR ... 85
Table 50 | Comparison of the CR and the SMR area under the Natura 2000 in 2007 ... 86
Table 51 | Rural typologies of Auvergne's NUTS 3 regions ... 94
Table 52 | Population variation rate in rural/urban settings of Auvergne ... 96
Table 53| Housing in Auvergne (2006) ... 98
Table 54 | Ten largest industrial employers of Auvergne in late 2005 ... 99
Table 55 | Poverty rates in Auvergne‘s départements (2004) ... 102
Table 56 | Forest areas in Auvergne, broken down by ownership types ... 106
Table 57 | Territorial forest charters of Auvergne in 2009 ... 107
Table 58 | Land-use trends in Auvergne for 1993-2003 ... 108
Table 59 | Environmental zonings in Auvergne (source: DIREN Auvergne) ... 109
Table 60 | Delimitation of rural areas in the Altmark according to the OECD at the LAU 2 level (threshold 150 inh/km2) ... 115
Table 61 | Development in population density since 1990. ... 116
Table 62 | Recent development of the population in the Altmark Region... 116
Table 63 | Net migration rates to/from Sachsen-Anhalt‘s districts toward Western Federal States between 1991 and 2002. ... 117
Table 64 | Birth rates compared to the average in the whole state Sachsen-Anhalt (=100) 118 Table 65 | Recent developments in the age structure in the Altmark ... 118
Table 66 | Number of schools in the Altmark ... 120
Table 67 | Unemployment in the Altmark 2007 ... 127
Table 68 | Details on unemployed population in the two Altmark districts in 2009 ... 128
Table 69 | Structure of livestock in the Altmark in 2007 ...131
Table 70 | Number and area of agricultural holdings by legal forms in 2007 in the Altmark131 Table 71 | Size distribution of farms in 2007 in the Altmark ... 132
Table 72 | Road network in Sachsen-Anhalt ... 137
Table 73 | Main projects held in the framework of the VDE concerning the Altmark. ... 137
Table 76 | Women aged 19 to 59 and men aged 19 to 64: highest qualification held, 2007 146
Table 77 | Occupational group of employed people, 2007 ... 147
Table 78 | Future demand for housing and housing affordability in relation to Rural-Urban classification ... 148
Table 79 | Industrial sector of employment. Percentage employed in sector,... 150
Table 80 | Unemployment, 1999 to 2009 ... 151
Table 81 | Agricultural land use and farm type, 2007 ... 152
Table 82 | Agriculture: farm size, tenure and labour ... 153
Table 83 | Farm income by farm type, East Midlands ... 154
Table 84 | Tourism, including day trips and staying visitors ...155
Table 85 | Forestry: type and area of woodland ... 156
E
XECUTIVE SUMMARY
The report gives an overview over the methodological approach used in the PRIMA project for the development of alternative scenarios. Scenarios focus on policy changes and possible results/outputs of EU policy implementation on regional and local (LAU) level. In a first step, a social economic analysis is implemented in each case study and bears on five domains: general characteristics, demographic trends, economic system, transport and environment. In a second step, and after identification of main driving forces, four scenarios are proposed and characterized:
- Baseline scenario: The baseline scenario is defined to analyse a base situation without additional intervention and different alternative options for intervention, i.e. the introduction of new measures in agriculture, forestry, tourism, and environment. The baseline scenario is a projection of the status quo or ―business as usual‖, including the existing framework in terms of agricultural and environmental policies, technological and market conditions, and the projection of technological trends and of decided policy changes to be implemented until the target year 2013.
- ‗Environment‘ scenario: This scenario is built on the assumption that measures for landscape, natural and cultural heritage preservation will be leading. Having in mind importance of environment issue in global aspect, it is assumed that environment policy will be more closely linked to rural development and more specifically to multifunctional land use activities. Thus, changes in the policy priorities on EU level are expected
- ‗Rural development‘ scenario: Rural Development Policy will have a leading role in the next planning period (2014-2020). Sustainable rural development will be achieved through: increasing competitiveness of agriculture and forestry; improving land management; implementing complex measures for environment protection and preservation, wider rural economy through new agricultural and non-agricultural activities; increasing the role of local initiative groups in regional and local decision making process.
- ‗Infrastructure & Competitiveness‘ scenario: This scenario assumes widened and enriched policy measures in Cohesion Policy. This scenario is developed on the assumption that Cohesion policy will have leading role on national and regional level. New objectives and measures will be elaborated aiming increasing of competitiveness of SMEs, development of favourable business conditions, improving quality of human resources, increasing capacity of local/regional branch organizations, construction of relevant new infrastructure and restoration of the existing.
Scenarios will be used as a starting point in modeling in PRIMA specific workpackages.
Diana Kopeva Maria Peneva
1 S
OCIAL ECONOMIC ANALYSIS OF THE
N
ORTH
-C
ENTRAL PLANNING REGION OF
B
ULGARIA
1.1 General characteristics
The territory of Bulgaria covers a total area of 111001.9 km2. It is situated in
the North Eastern part of the Balkan Peninsula sharing borders with Romania to the North, Serbia and the Republic of Macedonia to the West, Greece and Turkey to the South and the Black Sea to the East.
Bulgaria boasts a varied relief: mountainous and semi-mountainous regions cover about one third of the country. The average altitude of Bulgaria is 470 m. 31.5% of the country‘s territory is plain (up to 200 m above sea level), 41% are lowlands and hilly regions (from 200 to 600 m above sea level), and 27.5% are mountains (from 600 to more than 1,600 m above sea level). The climate, with well-defined four seasons, is moderate continental in the North and of a Mediterranean type in the South, with the exception of the mountainous regions. The annual average temperature depends on latitude and ranges from 8°C in the North and 11°C in the South, with temperatures of 2.6°C in the mountains and 12°C in the plains. Snowfall for the most part of the country is in the period from December to March and for the mountainous regions from December to June.
The country‘s moderate climate, together with its physical relief, is decisive to the development of agriculture and tourism. These climatic and geographical features also allow for year-round tourism and agricultural produce of wide variety.
Bulgaria has a population of 7.64 (7.72**) million people with an average
density of 68.9* (69.5**) people per km2, which is below the EU average
(114.3 people per km2).
Bulgaria has been divided into six planning regions which are classified as NUTS II regions which are not administrative territorial units and are used for the purposes of regional statistics, regional policies and planning. There are 28 administrative districts in Bulgaria which correspond to the EU-classification NUTS III level. The country is further divided into 264 administrative centers called municipalities, which correspond to LAU I level.
NSI, Statistical Yearbook, 2008 EUROSTAT, 2005
In Bulgaria the division of settlements is made on a town and village basis.
Figure 1 | Map of Bulgaria by region
The area of agricultural designation in 2007 amounts to 5 666 thousands ha and accounts for 51.04% of the territory of the country. The used agricultural area in 2007 is 5 116 thousands ha. Forest land covers 3 715 thousands ha and represents 33.5% of the country‘s total area.
The population in working age by the end of 2007 accounted of 4 817 thousand people, or 63.05% of the entire population. About 22.47% (1 717 thousand people) of the population is above the working age category. The natural growth of the population is negative and was estimated at (-5.0 %) in 2007, due to a combination of higher death rates and lower birth rates compared to the national average. Over the past years the rate of migration from villages to towns is positive.
There is a clear population-aging trend in the villages. The rural population‘s education level is much lower that that of the urban. This trend remains the same among the younger generation.
Declining trend for the number of employed in agriculture at the expense of the employed in industry and service sectors was observed in the past years.
Table 1 | Employed by economic sectors (thousands) Years
Agriculture, forestry and
fisheries Industry Services Total
2005 265.4 1020.2 1692.4 2980.0
2006 252.2 1072.1 1785.7 3110.0
2007 245.4 1154.7 1852.5 3252.6
Source: NSI, Employment and Unemployment (annual data), 2007
1.1.1
North Central Region: geographical information
Table 2 | Indicators for the demographic, social and economic development of the planning regions and districts (2007)
Planni ng region (NUT S II) and distric ts (NUT S III) Territ ory – sq. km Populat ion - number Unemploy ment rate - % GDP per capita - euro
GVA by economic sectors - Thousand Euro Agricult ure and forestry Indus try Service s NU TS 0 Bulgar ia 111001 .9 764020 0 6,90 3772, 82 176089 8 63774 14 124924 66 NU TS II North Centra l Regio n 14974, 0 931 950 10,7 1834, 86 270436 58457 0 101000 8 N U T S I II Veliko Tarno vo 4661,6 278 764 6,5 1868,63 55312 163579 319941 Gabro vo 2023, 0 133 218 1,2 2145, 64 19625 14957 0 146079 Razgr ad 2803, 4 136 062 23,5 1766, 79 66577 60824 119171 Ruse 2639,7 253 008 11,4 1808, 08 59325 17565 1 315759 Silistr a 2846, 3 130 898 15,2 1570, 29 69597 34946 10905 8
Source: NSI, Regions, Districts and Municipalities in the Republic of Bulgaria 2007, Eurostat, own calculation
1.1.2 Administrative structure of the North Central Region
(NCPR)
Figure 2 | Map of North Central Planning region by districts
Veliko Tarnovo District(Oblast) is bounded north by the Danube River
and south by the Balkan Mountains. It also borders the regions of Pleven, Lovech, Gabrovo, Stara Zagora, Sliven, Targovishte and Ruse, and over the Danube it borders Romania. Veliko Tarnovo region is spread on an area of 4 661.6 sq. km. and has population of 289 229 inhabitants. The region consists of 10 municipal centers with 336 populated areas (14 towns).
The relief in the region is diverse – there are lowlands, hilly plains, river valleys and heights of the fore-Balkan Mountains, parts of the central Balkans. The Yantra is the largest and high water river in the region. Some other big rivers are Yantra`s tributaries – the Rositza and Dryanovo Rivers. The reserves of Haydushki Chukar (―Haidouk Crags‖) and Byalata Krava (―White Cow‖) are located in the Balkan Mountains of Elena. There are 140 cultural monuments of national significance within the area of Veliko Tarnovo Region. Here are some of the most visited cultural and historic sites which make tourism a significant part of the region‘s economics. The numerous cultural monuments, the rich and diverse fauna and thermal waters near the village of Voneshta Voda (―Stinking Water‖) provide conditions for cultural and hunting tourism along with medical and balneological tourism. The vine-growing complexes in Lyaskovetz, Suhindol, Karaysen and Svishtov stimulate the wine tourism. The municipalities of Elena, Zlataritza, Strazhitza and Pavlikeni specialize in rural tourism. Well-developed is the stockbreeding sector.
Gabrovo District (Oblast) is situated in Central Northern Bulgaria,
bounded by the regions of Veliko Tarnovo, Lovech and Stara Zagora. The area size of the region is 2 023 sq.km. The population of district is 140 991 people. Gabrovo region consists of 4 municipalities (Gabrovo, Dryanovo, Sevlievo and Tryavna) and 356 populated areas of which 5 towns.
Figure 4| Map of Gabrovo District by municipalities
The Ruse–Podkova railroad runs through the region crossing the Balkan Mountains and connecting Northern Bulgaria with Southern Bulgaria. The relief of the region is diverse, mostly mountainous. The area of Gabrovo Region covers some middle parts of the Balkan Mountains and the fore-Balkans, the valleys of the Yantra, Rositza, Vidima, Drianovska rivers as well as several kettles and plateaus, and Gabrovo and Sevlievo heights. On the territory of Gabrovo Region there are more than 650 monuments of culture, most of which are related to the National Revival period.
The leading sector in the region is industry while stockbreeding is the most developed one in agriculture.
Ruse District (Oblast) includes a part of the hilly Danubian Plain, the
Danubian riverside plain of Pobrezhie and part of Ludogorie lowlands. It is bounded by the regions of Silistra, Razgrad, Targovishte and Veliko Tarnovo, and borders Romania to the north with the Danube River as a boundary. The region territory is 2 803.4 sq.km. The population accounts 264 232 inhabitants. Ruse region consists of 8 municipalities (Rousse, Borovo, Byala, Vetovo, Dve mogili, Ivanovo, Slivo pole and Tsenovo) with 9 towns and 74 villages.
Figure 5 | Map of Ruse District by municipalities
Razgrad District (Oblast) is located in the northeastern section of the
Danube plain, on an area of 2 639.7 sq. km. The Region borders with the Ruse, Silistra, Shoumen, and Targovishte regions. Razgrad Region comprises seven municipalities - Razgrad, Isperih, Kubrat, Zavet, Loznitsa, Samuil and Tsar Kaloyan and 102 settlements, of which there are 6 towns and 97 villages.
Silistra District (Oblast) is situated in the northern part of the NCPR, on
the bank of the river Danube. The administrative center of the region is Silistra - a town, with population of 38 733 inhabitants. It is bounded by the regions of Russe, Razgrad, Shumen and Dobrich. It also borders on Romania by land and by the Danube River. The region consists of 7 municipal centers (Silistra, Alfatar, Glavinitsa, Dulovo, Kaynardja, Sitovo, Tutrakan) with 118 populated areas (of which 5 towns). It spreads on an area of 2 846.3 sq. km. and has population of 138 994 inhabitants.
Figure 7 | Map of Silistra District by municipalities
The territory of the region includes parts of the hilly Danubian Plain, Dobrudzha and Ludogorie lowlands. The Danube River is a natural waterway connecting Silistra with Central and Eastern Europe. The relief is predominantly plain. Rivers, which flow through the region, are small and they often run dry in summer. The landscape is agricultural. Grain and technical crops are generally grown. Conditions related to natural climate and soil in the region are extremely conducive to developing modern farming. There are no century-old forests. The scenery is varied by forest shelterbelts. Natural and historical realities of the region enable the development of cognitive, cultural, ecological, rural and hunting tourism. The most interesting natural site in the region is Lake Srebarna. It is located in the south-western part of the plain and is part of the Srebarna Biosphere Reserve, included in the UNESCO List of World Cultural Heritage. Several islands have been formed in the Danube, some of which are suitable for recreational and tourist purposes. The Karakuz natural game preserve provides opportunities for hunting tourism and the nature reserves of Malak Preslavets (a lake with water-lilies) and Srebarna are convenient places for ecotourism.
Settlements
The number of settlements in NCPR remains relatively unchanged in the last years – 957 villages and 38/39 towns. In 2007 in district Razgrad is established one settlement as a village more and in district Rouse one of the villages has been changed in town. The average number of inhabitants per settlement decreases over the observed period and for 2007 it is lower the country‘s average (respectively 936 and 1440 inhabitants per settlement).
Table 3 | Settlements Characteristics in NCPR
2007 2006 2005 2004 Number of settlements, including: 996 995 995 995
Town 39 38 38 38
Villages 957 957 957 957
Average inhabitants per settlements 936 946 954 964 Source: NSI, Regions, Districts and Municipalities in the Republic of Bulgaria 2007
1.1.3 Rural areas
According to the OECD definition, in Bulgaria there are 20 predominantly rural NUTS 3 regions, seven intermediate rural regions and only one predominantly urban region - the capital Sofia. Thus, predominantly and intermediate rural regions cover 98.8% of the territory and account for 84.3% of the population of Bulgaria
Source: MAF, 2004, ―National Strategy Plan for Rural Development (2007 –2013)‖
Figure 8 | Designation of Rural Areas at NUTS 2 Level Using the OECD Methodology
Following OECD definition in NCPR there are 4 predominantly rural NUTS 3 regions (Veliko Tarnovo, Gabrovo, Razgrad and Silistra) and 1intermediate rural NUTS 3 region (Ruse).
According to the national definition, rural areas are municipalities (LAU1), in which no one settlement has a population over 30 000 people and population density is under 150 inhabitants per sq.km. According to this definition, 231 municipalities (87 %) in Bulgaria are classified as rural. The rural areas represent 81% of the Bulgarian territory and 42% of its population.
Source: MAF, 2004, ―National Strategy Plan for Rural Development (2007 –2013)‖
Figure 9 | Designation of Rural Areas at LAU 1 Level Using the National Definition
This definition has been accepted as official one in Bulgaria. It has been applied for elaboration of the National Strategy Plan for Rural Development, the Rural Development Program and for implementation of the EU structural policies. Taking into account one of the project‘s aim to examine the European structural policies‘ impact on the multifunctionality in rural areas, we decide to use it. Following the national definition in NCPR there are 7 urban LAU 1 regions (Veliko Tarnovo, Gabrovo, Gorna Oriahovica, Ruse, Razgrad, Svishtov and Silistra) and all the rest 29 are rural.
1.2 Demographic trends
1.2.1 Population
By the end of the year 2007 the population of the NCPR consists of 931 950 residents or 12.2% of the total population of the country. The population density equals to 63 inhabitants/sq.km. and is below the country‘s average (69 inhabitants/sq.km). Over the last decade the population in the Region follows the same pattern of decrease that can be observed at national level. About 65% of the population lives in towns, which is lower than the country‘s average (71%). There are fluctuations in the birth and death rates. Nevertheless, the value of the birth rate (8.40‰) is the fifth highest in the country and the death rate (15.70‰) is the fifth lower in the country. The amount of economically inactive population steadily increases over the last five years at the expense of the total workforce, which constantly decreases over the same period – a pattern that can be observed at national level as well. The number of students per 1,000 inhabitants is higher (45) than that of the country (35) as a whole and is relatively non-stable during the last decade. The number of registered doctors for the NCPR repeats the unstable behaviour of the former indicator, but is below – 2.82 per 1,000 inhabitants – the country‘s average of 3.65 registered doctors per 1,000 inhabitants. The number of dwellings per 1,000 inhabitants in the Region (505) is lower than the average for Bulgaria (517) and is constantly increasing over the last decade – a fact, which is mainly due to the population decrease for the same period. The average size of households in the NCPR fluctuates in the last 10 years, being almost identical with the indicators at national level (2.6 in NCPR and 2.5 in Bulgaria).
Table 4 | General Population and Quality of Life Indicators in NCPR
INDICATORS 2007 2006 2005 2004
Population 931950 941240 949401 958755
Density (inhabitants/sq km) 62,5 62,86 63,40 64,03
People living in towns 604582 609357 607646 612218
People living in villages 327368 331883 341755 346537
Birth Rate 8,40 8.22 8.22 8.20
Death Rate 15,70 15.78 15.90 15.12
Total workforce / thousands 412,3 406.7 393.2 401,3
Students/1000 inhabitants 45 36 38 43
Dwellings/1000 inhabitants 505 487 492 498
Registered Doctors/1000 inhabitants 2,82 2,77 2,86 2,83
Average size of Households 2,6 2,4 2,5 2,5
Source: NSI, Regions, Districts and Municipalities in the Republic of Bulgaria 2007, own calculation
1.2.2 Age structure
The age structure of the population in NCPR and the country as a whole gives very serious grounds for concern. While the percent of population at working age remains relatively constant over the last years, the percent of people at retirement age is constantly growing at the expense of the population below working age. This is a serious demographic problem, which is invariably aggravating in the last years. One of the most unfavorable development of the demographic processes has been noted for the North Central Region.
The NCPR‘s positions, compared to the country‘s average, are as follows: 13.32% and 11.83% of the male and female population respectively are below working age, compared to the country‘s 14.21% and 12.63%.
71.09% and 67.44% of the male and female population respectively are at working age, compared to the country‘s 71.14% and 67.55%. 15.59% and 20.73% of the male and female population respectively are at retirement age, compared to the country‘s 14.65% and 19.82%. Table 5 | Population Distribution in NCPR by Age and Sex – 2006
Sex % Under
Working Age % Working Age
% Retirement Age
Below 15 15-19 20-24 25-29 30-34 35-39 40-44 45-49 50-54 55-59 60-64 Over 65 Male 13,32 6,60 7,48 7,27 7,45 7,32 6,79 6,98 7,29 7,34 6,59 15,59 Female 11,83 5,86 6,80 6,44 6,68 6,69 6,32 6,62 7,11 7,60 7,33 20,73
Source: NSI, Population and Demographic Processes 2007
The NCPR‘s labour supply is predetermined significantly by the population number and age profile. The population in working age by the end of 2007 accounted for 645 thousand people, or 69.21% of the entire population. The population above working age in 2007 was 170 thousand people.
A lasting downward tendency outlines for the population below working age on country level is valid for NCPR. By the end of 2007 this population category accounted for 117 thousand people.
1.2.3 Education
The education system in NCPR consists of schools in all educational levels. In 2007, there are 379 kindergarten, 305 general schools and 85 secondary schools in the region. In NCPR there are 5 universities and equivalent higher schools with 41,1 thousand students. The same year 10,6 thousand students graduated their higher education.
Table 6 | Kindergartens, schools, universities, teachers and students by districts in NCPR, 2007 Plan n in g re gi on an d d istr ic ts K in d er gar te n s K in d er gar te n t ea che rs Chi ld re n e n rol le d G en er al sc hoo ls U p p er se co n d ar y e d u ca ti on sc hoo ls U n iv er si ti es a n d e qu iv ale n t hi ghe r sc hoo ls T ea che rs i n g en er al sc hoo ls T ea che rs i n u pp er se con da ry e du ca ti on sc hoo ls L ec tu re rs i n u n iv er si ti es an d e qu iv ale n t hi ghe r sc hoo ls Pu pi ls in g en er al sc hoo ls Pu pi ls in u pp er se con da ry ed u ca ti on Stu d en ts in u n iv er si ti es an d e qu iv ale n t hi ghe r sc hoo ls North Central 379 2 308 25 143 305 85 5 6 216 2 559 2 362 16 518 23 772 41 142 Veliko Tarnovo 114 629 7 089 95 25 3 1 868 765 1 338 5 085 7 030 26 058 Gabrovo 33 296 3 230 31 14 1 701 361 303 1 863 3 348 6 856 Razgrad 89 454 4 760 61 13 0 1 084 419 0 2 178 3 860 0 Ruse 68 569 6 367 68 21 1 1 563 718 576 4 713 6 881 7 936 Silistra 75 360 3 697 50 12 0 1 000 441 0 2 679 2 653 0
Source: NSI, Regions, Districts and Municipalities in the Republic of Bulgaria 2007
The educational structure of the population (at 15 years and above), living in NCPR differs from that of the country as a whole – the percentage of people with higher and medium education in the Region (14,00% and 46,00% respectively) is lower than the country‘s average (17,20% and 46,63%), while the share of population with low education in the Region (40%) is higher that in the country (36,17%). This is a direct consequence from the ethnical structure of the population in the south-eastern part of the NCPR, where the percentage of Turkish minority is relatively high with respect to the rest of the Region. The described educational structure of the population in the NCPR to a certain degree determines the distribution of the employed among the different sectors of the economy.
Table 7 | Education Level* in Bulgaria – 2007
Population with higher education (university) % 14,00
Population with medium education (high school, agricultural school, technical education) % 46,00
Population with low education (rest of the pop.) % 40,00
The profile of employed in NCPR by education status displays the largest share of employed with secondary education – 63,33%, followed by employed with higher education – 23,29%. The share of employed with basic, primary and lower than primary education – 13,38% is the lowest. Unemployment rates (especially long-term unemployed people) correlate strongly with the educational levels. In NCPR there is clear evidence that more than 50% of long-term unemployed and 70% of long-term unemployed young people are with primary or lower than primary education.
1.2.4 Migration of the population
In 2007, 151 thousand persons changed their present address within Bulgaria and 20,5 thousand persons changed their present address within NCPR. The biggest migration increase in territorial aspect in 2007 occurred between cities and other cities. This tendency of region development is the same like on national level. Approximately 38% of emigrants and 34% of immigrants on the region level changed their place of residence from one city to another either in NCPR and other regions. Migration flows from villages to cities and from cities to villages of NCPR (from the same region and other) are respectively 23% and 26%. Migration between villages accounted for the lowest share. In 2007 out of all migrants 15% migrated between villages. Table 8 | Migration Flows, 2007
DIRECTION NCPR Bulgaria
From Rural to Urban1 4836 33185
From Urban to Rural2 4932 43360
From Urban to Urban3 6240 57731
From other regions 6288
51146
To other regions 8492
Net Migration -2204 -
*Interregional migration in the country
1 The migration flows are presented as: from Villages to Towns 2 The migration flows are presented as: from Towns to Villages 3 The migration flows are presented as: from Towns to Towns
Source: NSI, Regions, Districts and Municipalities in the Republic of Bulgaria 2007
The analysis of the two main flows in NCPR (within the region and between NCPR and other regions) - from cities to villages and from villages to cities - shows a reversal of the migration balance in favour of villages. In 2007 the number of migrants from cities to villages was more than that in the opposite direction by about 4%.
1.3 Economic system
1.3.1 Economy
1The North Central Region forms about 9,04% of the country‘s GDP, while the GDP per capita is below the national level (respectively 1835 and 3278 euro). The share of the service sector in the GVA of the region is growing in the last few years, reaching 54,2% in the year 2006.
Figure 10 | Gross Value Added by economic sectors, 2006 Source: NSI, Regions, Statistical Yearbook 2008
The sectors of agriculture and industry give 14,5% and 31,3% respectively in the total amount of GVA for the region. The comparison to the corresponding figures at national level (8,5% and 30,9%) clearly shows the importance of the agricultural sector for the economy of the NCPR as compared to the country as a whole.
Due to the change in administrative structure of the country in 2004/2005 the data for the period 2006 and before are not directly comparable with the last years. In all statistical publications till 2007 NCPR cover the following districts: Veliko Tarnovo, Gabrovo, Lovech, Pleven, and Rousse.
Table 9 | Gross Value Added by economic sectors
GVA 2006 2005 2004
in euro in % in euro in % in euro in % Agriculture and Forestry 270436 14,5 260987 15,0 271152 16,6
Industry 584570 31,3 504950 29,1 469025 28,8 Services 1010008 54,2 972135 55,9 889014 54,6
Source: NSI, Statistical Yearbook 2008
Major characteristic of the region economy is its diversification and existence of traditional productions. NCPR is developing a mixed type of economy. The production of food products, beverages and tobacco, basic metals and fabricated metal products and chemicals, products and man-made fibres occupy a considerable share in the economy of the region – respectively 21,96%, 9,48% and 7,06.
Table 10 | Production of the industrial enterprises and establishments by activity groupings, 2007 (in %)
M anu fa ct u re o f f o o d pro d u ct s, b eve ra g es and to b a cc o M anu fa ct u re o f t ex ti le s and t e x ti le p ro d u ct s M anu fa ct u re o f ch em ic als , pr o d u ct s and man -mad e f ib res M anu fa ct u re o f b as ic me tals and f ab ri cat ed me tal p ro d u ct s, e x ce p t mac h in er y M anu fa ct u re o f mac h in e ry and e q u ipme n t North Central 21,96 7,75 7,06 9,48 15,69 Veliko Tarnovo 36,63 4,71 5,08 8,01 13,59 Gabrovo 6,71 8,73 - 9,06 33,86 Razgrad 58,83 2,76 n.a. 1,95 1,91 Ruse 9,69 11,04 13,81 14,02 8,46 Silistra 33,28 5,48 0,97 3,87 13,77
Source: NSI, Regions, Districts and Municipalities in the Republic of Bulgaria 2007
Food and beverages industry is well-developed in 3 districts: Veliko Tarnovo, Razgrad and Silistra. Pharmaceutical industry has a significant part in district Razgrad economy. Significant and structure-determined industrial sectors for the region economy are also the following ones: ―Machinery and equipment‖, ―Textile and textile products‖.
1.3.2 Unemployment
The registered unemployment rate in NCPR, with a value of 10,9% (7,9% in 2007), is one of the highest in the Bulgaria - the 3rd place (both in 2006 and 2007). The country‘s average is 9,0% in 2006 (6,9% in 2007).
In 2007 the profile of unemployed by educational levels in NCPR displays the largest share of persons with secondary education – 63,3%, followed by the share of those with higher education – 23,2%. The share of those with primary and lower education – 13,3% is the owest.
Table 11 | Employed persons by level of education and district in NCPR, 2007
Region and districts
Total
By level of education
Higher Upper Secondary Lower Education Primary and in number in % in number in % in number in % in number in % North Central 368,4 100,0 85,8 23,29 233,3 63,33 49,2 13,36 Veliko Tarnovo 110,2 29,9 31,0 28,13 68,9 62,52 10,3 9,35 Gabrovo 60,2 16,3 13,3 22,09 42,2 70,10 4,8 7,97 Razgrad 43,1 11,7 8,3 19,26 24,2 56,15 10,5 24,36 Ruse 105,4 28,6 23,2 22,01 68,2 64,71 13,9 13,19 Silistra 49,5 13,4 10,0 20,20 29,8 60,20 9,7 19,60
The unemployment rate in the districts follows the patterns, which can be seen at regional level, namely the largest share of unemployed persons with secondary education, followed by the share of those with higher and the lowest share of the unemployed with primary education. Only exception is observed for the Razgrad district where the lowest share of unemployed is of those with higher education.
1.3.3 Agriculture
During the economic 2006/2007 about 477,1 thousand agricultural structures in the country correspond to the definition of agriculture2, whereas in 2005 their number was 534,6 thousand. In NCPR the total number of farms equals to 71 200, which is 9,3 % less than the number of farms in 2005 (78 500)3. During the last two years in the NCPR 7300 farms suspended their activities or have moved beneath the thresholds of agriculture, or had no agricultural activity during the monitored economic year.
2 The definition of agriculture is classified in the Law on Agricultural farms census in the
Republic of Bulgaria in 2003, State Gazette, Issues 17 of 21.02.2003.
Number of registered agricultural producers in the NCPR increased by 25,6 % last two years (2007 and 2008) (Figure 11). The register of agricultural producers in accordance with Ordinance No 3 of 1999 serves for getting information on activity of the agricultural producers aimed at supporting agriculture and the development of the rural areas. After the registration the agricultural producers can make use of the preferences regulated in the Taxation of the Income of Natural Persons Act (TINPA), the Corporate Revenue Tax Act (CRTA) and the Social Insurance Code. According to the Statute for the application of the Agricultural Land Ownership and Use Act, it is only the registered agricultural producers who can participate in tenders or competitions for renting/leasing vacant lands from the State Land Fund. Registration is a precondition for receiving financial support from the ―Agriculture State Fund, SAPARD and the Rural development programme.
Figure 11 | NCPR: Registered Agricultural Producers
NCPR is on the fourth place among other planning regions by UAA in 2008 and on the third place by arable land. (Figure 12).
Figure 12 | NCPR: Utilized Agricultural Area and Arable Land in 2008 98 % of farms have at their disposal used agricultural area (UAA) in 2007. The average size of UAA is 10,57 ha, whereas the average size of UAA at country level is 6,33 ha. (Figure 13).
0 500 1000 1500 2000 2500 3000 3500 R e gi st e re d Agr ic u ltu ral Pr o d u ce rs (n u m b e r) 2007 2008 21 16,20 17 13 15,3 17,5
Utilized Agricultural
Area in 2008 (%)
North-West North Central North-East South-West 22,7 20,6 23,1 4,1 11 18,5Arable Land, 2008, (%)
North-West North Central North-East South-West South CentralFigure 13 | Average UAA
The NCPR is on the fifth place with the total number of holdings but on the second by average UAA. It is as a result of the production structure of the region (see table 12). NCPR is on the first place with 4571 holdings – 26% of all holdings in Bulgaria specialized in cereals, dry pulses and oil crops. Table 12 | Holdings in Bulgaria by farm type and planning regions, 2007
Regions
Holdings specialized in: Mixed holdings with dominating:
Ce re als, d ry p u lse s a n d o il cr op s Othe r ar ab le c rop s V ege tab le s, flo w er s a n d mu shr oo m s V in eya rd s Or cha rd s Mi xed p er ma n en t cr op s Mi lk ca tt le Me at ca tt le Mi xed mi lk ca tt le She ep , go ats an d o the r gr az in g li ve stoc k Por k, p ou lt ry, ra bb its Cr op s G ra zi n g li ve stoc k G ra n iv or es Ar ab le c rop s an d g ra zi n g li ve stoc k Othe r c rop s an d li ve stoc k N on -c lassi fi ed fa rm s Bulgaria 17718 56635 15092 18770 10275 3397 42560 1312 1558 45172 60520 46791 29844 44458 37442 46648 14941 North-West 3508 2571 940 2180 1737 255 5080 73 179 6460 14737 11720 7910 13816 3116 12451 3601 North Central 4571 3896 1200 737 759 172 4613 42 275 5719 8862 7071 4825 7488 4016 7514 2022 North-East 3525 2792 905 1364 509 197 5703 128 248 8433 8656 3197 3845 7193 3379 4261 1958 South-East 2302 3566 3604 3924 2083 913 5916 245 220 8528 8855 5423 3692 6541 1994 6812 2321 South-West 628 15038 2388 3590 2565 660 6509 199 120 7824 7781 8700 5003 4453 8496 6535 1727 South Central 3184 28772 6055 6975 2622 1200 15739 625 516 8280 11629 10680 4569 4967 16441 9075 3312
Source: MAF, Structure of Agricultural Holdings in Bulgaria (crop year 2006/2007), Final Results 6,33 6,97 10,57 11,9 8,62 2,39 2,8 0 2 4 6 8 10 12 14
The structure of land in NCPR is shown on figure 14A. The region covers about 16,3% of the total utilized agricultural area, as the share of the arable land, permanent crops, and permanent grassland and meadows-orchards is 76%, 3%, and 21% of the total agricultural land in the region respectively. The total agricultural land in the region is spread among the districts as it is shown on the figure 14B.
A B
Figure 14 A and 14B | Utilized agricultural area by type and district in 2007 The road transport network is generally well developed in Bulgaria. The railway and water transport systems are much more limited in terms of coverage.
There are 1 172 settlements in Bulgaria where waste is collectively collected. During the 2007 continuing the tendency of building up of regional landfills for municipal waste and at the same time were closed down of landfills built in the past, which do not respond to the ecological requirements, and new contemporary facilities for municipal waste disposal were constructed. A result of this was a reduction in the total number of landfills within the country from 619 in 2000 to 435 in 2007. The organized waste collection systems were implemented in new settlements led to an increase of the population served by municipal waste collection systems from 78.6% in 2000 to 92.5% in 2007.
As regards the social infrastructure, the system of education is well developed, with nurseries, kindergartens, and schools in almost every rural settlement that has the minimum required number of children. There is also a well-developed health care system that relies on primary and pre-hospital care units as the main form of health care. In addition, there is an array of cultural and public facilities such as community centres, public libraries, clubs, etc.
Rural natural resources and climate are an important pre-condition for the promotion of multiple economic activities in rural areas: agriculture, forestry, industry, tourism, etc. In general, much of the industry in rural areas is of the multi-purpose type. Almost all industries were developed prior to the outset
of the economic reforms (food processing, timber, textiles and knitwear, electronics, machine-building located in small to medium-sized enterprises). The collapse of the command economy and the implementation of economic reforms culminated in the liquidation of many enterprises, which in turn resulted in a dramatic reduction in rural non-agricultural employment. With the completion of land restitution, many of the small private farms, which have emerged, are essentially subsistent in nature.
The North-Central Region (NCPR) is situated in the central part of Northern Bulgaria. It borders the Danube to the north, which marks the Bulgarian border with Romania, the Iskar River to the west, the river of Rusenski Lom to the east and the Balkan Mountains to the south.
The NCPR spreads on a territory of 14 974 sq. km., or 13.5% of the country‘s territory. It has a varied relief with plains prevailing especially in proximity of Danube River. The Region borders on the North West Region to the west, North East Region to the east and the South-East Region to the south. The north border coincides with the state frontier with Romania – Danube River, on which Ruse and Silistra ports are situated.
The geographical conditions in the NCPR are very favorable for the development of agriculture and tourism – with a percentage of mountainous areas and forests (23.82% of the region territory) below the country‘s average (33.47% of the territory).
NCPR has a moderate climate. The low amount of precipitation – below 500 mm enforces artificial irrigation of the agricultural territories. The average temperatures in the Region vary between 11°C and 12°C, while they are higher near the Danube River.
NCPR is on sixth place among the six NUTS 2 of Bulgaria with 941 240 residents (12.3% of country population) and on fifth place as territory (13.5% of national territory).
The NCPR includes 5 administrative regions (NUTS 3), 36 municipalities (LAU 1) and 359 settlements (LAU 2). The local authorities (towns‘, municipalities‘) are responsible for many activities as education, health care, etc.
The capital city of the Region is Ruse. The city of Rousse is situated in eastern part of North-Central Bulgaria at the mouth of the river Roussenski Lom witch is the easternmost of the right tributaries of the Danube. Rousse is a major crossroad of the east-west water-ways – European transport corridor N 7 and of the north-south motor and railways – European transport corridor N 9 from Helsinki, Finland to Aleksandropulus, Greece. The Rousse port is one of the largest in the lower course of the Danube. There is a ferry line from Rousse to the Ukrainian port Reni and the Romanian port Gurgu. The Rousse bridge is the main way across the Bulgarian part of the Danube. The bridge is 2.8 kilometres long and is suspended 30 metres above the water on two levels – for the trains and for vehicles. With its over 155 000 residents Ruse is the
largest Bulgarian city on the Danube. It is also important political, university and cultural centre.
The main centres of economic activities of the NCPR are the capital towns of the administrative NUTS 3 regions (districts / oblasts)- Veliko Tarnovo, Gabrovo, Ruse, Razgrad and Silistra. One of the problems of the Region is that the economic activities are concentrated in the towns and the rural regions are relatively depopulated and lagging.
Some of the big rivers are the Yantra and the Rusenski Lom. The region is important for the national transport system. The Danube River is linked through the European waterway system with the Mein and the Rhine rivers and connects the North Sea with the Black Sea. Important roads and railways connect the region with the rest of the country and the only bridge over the Danube on Bulgarian territory connects the country with Romania. The middle point of the bridge marks the boundary between the two countries. Protected areas on the territory of the district include the Rusenski Lom Nature Park, which comprises the picturesque canyon of the river valley, rock formations near the villages of Pisanets and Mechka, and the Orlova Chuka Cave.
A larger part of region is located on the Ludogorie plateau. The southern part is hilly, while in the north, the land is fused with the Dobrudja and Danubian plains. The population of the Razgrad District is 143 129 inhabitants.
The region is poor in water resources. The only large river is the Beli (White) Lom, which divides the region in two – the northern part and the southern part. The international road Ruse-Varna passes across the region as well as the Ruse-Varna railroad the first railway built in Bulgaria.
There are about 1,200 stationary cultural monuments in the region, which, along with the thousands of items and documents, illustrate the rich material and spiritual culture of the tribes and peoples who have been living in the Ludogorie throughout the millennia. The archaeological reserve of Sboryanovo is in this area. The hunting site of Voden offers wonderful conditions for hunting tourism. The populations of red and fallow deer, wild boar, aurochs and moufflon are regarded high as trophies.
The majority of the total UAA (about 78 %) is cultivated by holdings managing more than 50 ha (but only 0,8 % of the holdings). Less than 7 % of the UAA is cultivated in 75 % of the holdings which manage less than 1 ha each.
Production structure is shown in table 13. The largest share of the arable land holds grains, oleaginous and permanents grassland and meadows orchards which means that on the national level they respectively cover 49%, 20% and 21% of the total country utilized agricultural area. In 2007 in the North Central Region were cultivated the second largest areas of cereals and sunflower in the country, respectively 405 thousand ha or 23% of the
cultivated land in the country and 167 thousand ha or 22% of the cultivated land in the country.
Table 13 | Agricultural area by group of crops and district in NCPR, 2007 (ha) Regions and
districts Cereals Oleaginous Industrial
Vegetables and flowers Grassland and annual fodder crops Permanent grassland and meadows orchards Permanent crops Fallow land Bulgaria 1772350 746 081 72 593 101 105 101 674 1 842 141 188 525 291 751 North Central 404 758 167 169 7 111 18 733 26 993 173 242 21 699 12 646 Veliko Tarnovo 107 313 42 727 904 2 309 6 425 77 492 3 010 3 941 Gabrovo 8 235 3 100 - 485 775 45 246 970 3 779 Razgrad 90 561 34 972 707 5 054 7 479 17 587 3 335 1 920 Ruse 109 759 48 459 2 307 2 206 7 525 16 655 3 010 2 308 Silistra 88 890 37 911 3 193 8 679 4 789 16 262 11 374 698
Source: NSI, Regions, Districts and Municipalities in the Republic of Bulgaria 2007
As it is seen the region is the main cereals and sunflower production region. In 2007 in NCPR are produced 545 tons wheat, 97 tones barley, 40 tones corn and 146 tones sunflower seeds, which forms respectively 23%, 23%, 13% and 26% of the country production.
Table 14 | Area and production of main crops by region in 2007
Regions
Area under crops - hectares Production - tones
Wheat Barley (corn) Maize Sunflower seeds Wheat Barley (corn) Maize Sunflower seeds Bulgaria 1 087 996 186 850 214 367 602 398 2 390 610 419 762 312 860 564 447 North-West 224 247 41 199 64 270 143 052 361 119 72 493 76 026 135 938 North Central 244 938 41 679 36 409 139 632 545 402 96 864 39 923 146 304 North-East 263 224 35 605 87 061 140 415 662 158 90 840 93 939 129 573 South-East 224 630 52 270 5 291 125 039 530 029 124 709 14 112 108 143 South-West 32 731 4 431 9 149 10 495 73 037 7 417 33 820 6 388 South Central 98 226 11 666 12 187 43 765 218 865 27 439 55 040 38 101
Source: NSI, Regions, Districts and Municipalities in the Republic of Bulgaria 2007
Agriculture‘s major sub sector – planting is widespread within the region. Cultivation of perennial cultures (such as raspberry, black currants, aronia, strawberry), grapes and vegetables and fruit-growing also has good perspectives for development. The region has favorable conditions for the cultivation of herbs, oil cultures and mushrooms as such cultivation is a further challenge in front of the agrarians within the region.