HAL Id: hal-00296895
https://hal.archives-ouvertes.fr/hal-00296895
Submitted on 5 Aug 2005
HAL is a multi-disciplinary open access
archive for the deposit and dissemination of
sci-entific research documents, whether they are
pub-lished or not. The documents may come from
teaching and research institutions in France or
abroad, or from public or private research centers.
L’archive ouverte pluridisciplinaire HAL, est
destinée au dépôt et à la diffusion de documents
scientifiques de niveau recherche, publiés ou non,
émanant des établissements d’enseignement et de
recherche français ou étrangers, des laboratoires
publics ou privés.
Diagnosis and modelling of a summer convective storm
over Mediterranean Pyrenees
A. Callado, R. Pascual
To cite this version:
A. Callado, R. Pascual. Diagnosis and modelling of a summer convective storm over Mediterranean
Pyrenees. Advances in Geosciences, European Geosciences Union, 2005, 2, pp.273-277. �hal-00296895�
Advances in Geosciences, 2, 273–277, 2005 SRef-ID: 1680-7359/adgeo/2005-2-273 European Geosciences Union
© 2005 Author(s). This work is licensed under a Creative Commons License.
Advances in
Geosciences
Diagnosis and modelling of a summer convective storm over
Mediterranean Pyrenees
A. Callado and R. Pascual
Centre Meteorol`ogic Territorial a Catalunya of Instituto Nacional de Meteorolog´ıa, Barcelona, Spain Received: 24 October 2004 – Revised: 30 May 2005 – Accepted: 6 June 2005 – Published: 5 August 2005
Abstract. Over the Mediterranean Pyrenees and near coastal
region there is a high frequency of convective storms during summertime. This fact determines a local maximum of pre-cipitation at this season unlike the normal and general mini-mum over Mediterranean basin.
The common synoptic and mesoscale patterns associated to convective phenomena are briefly analyzed and diagnosed with radar imagery, surface pressure and isobaric level fields and surface data. They usually involves a little distant through at medium levels, very weak pressure gradient at the surface and not significant instability, but a preferred Plane-tary Boundary Layer low-level convergence zones tied to the orography. As a result of this analysis two different kinds of circulations associated to recurrent convergence zones have been recognized: upvalley/upslope winds and sea breezes.
High resolution simulations from a Numerical Weather Prediction model for a case study have carried out to ana-lyze the role of the main key components, i.e. the orography, the sea and valley breeze and their influence to generate local convergence zones. Furthermore, the skills of the model to simulate the location and the intensity of the precipitation of these summer Mediterranean storms have been discussed.
1 Introduction
The Mediterranean Pyrenees or Eastern Pyrenees (red dot-ted rectangle in Fig. 4) show a high frequency of afternoon convective storms during summertime with more than 30 days (Terradelles, 1996; Vilar, 2000). This fact determines a particular seasonal rainfall regime with a summer maxi-mum and a winter minimaxi-mum unlike the normal and general summer minimum over Mediterranean basin. As is shown by Terradelles (1996, 1997) there is a relative maximum of lightning density at this season as well, tied up to afternoon convection. Furthermore, in previous studies carried out in
Correspondence to: A. Callado
(acallado@inm.es)
Catalonia (Pascual et al., 2004) Eastern Pyrenees are recog-nised as one of the very high convective areas as shown in his Fig. 1. It has been suggested that this maximum thunder-storms density could be related to the proximity of Mediter-ranean Sea: while upslope could play the role of triggering convection, sea breeze could supply additional moisture (Ter-radelles, 1997; Pascual et al., 2004). The main goal of this study is to investigate these hypotheses.
For simplicity we focus our interest 26 August 2003 be-cause is a typical case with convection only in Eastern Pyre-nees. It is important to remember that 2003 summer was characterised by dry and very warm conditions.
2 Observational analysis and diagnosis
The 26 August 2003 was characterised by a ridge and rela-tively warm air at 500 hPa (−10◦C) over Western Mediter-ranean. At low levels the main element was a thermal low centred at the Iberian Peninsula. No significant instability was present at synoptic scale.
As shown in Table 2 and Fig. 3 the data from Spanish Me-teorological Service (INM) and Automatic System of Hydro-logic Information (SAIH) from the Generalitat of Catalunya networks focused the precipitation in Eastern Pyrenees with a maximum over Ripoll`es region and a secondary one in Bergued`a region. The maximum rainfalls reported were around 35–40 mm.
Radar reflectivity imagery and outputs from convective cells identification and tracking objective algorithm, opera-tional on the INM (Mart´ın, 2001), have been used to analyse convection development, evolution and propagation.
The first convective cell identified (11:40 UTC) developed over a mountainous area located between the upper Ter river valley (west-east oriented turning left to north-south) and the headwaters of two tributaries of the Fluvi`a river (east-west oriented). An enhanced convergence area between upvalley/upslope western flow and an upslope eastern flow (combination of the mountain breeze circulation and the sea
274 A. Callado and R. Pascual: Diagnosis and modelling of a summer convective storm
8
0 0 : 3 0 0 3 : 3 0 0 6 : 3 0 0 9 : 3 0 1 2 : 3 0 1 5 : 3 0 1 8 : 3 0 2 1 : 3 0 0 45 90 135 180 225 270 315 360 0 0.5 1 1.5 2 2.5 3 3.5 4 4.5 5 20030826 Girona Velocity Direction (in degrees)Hours (hh:mm) W ind ( m /s and º )
0 0 : 3 0 0 4 : 0 0 0 7 : 3 0 1 1 : 0 0 1 4 : 3 0 1 8 : 0 0 2 1 : 3 0 320 325 330 335 340 345 350 10 12 14 16 20030826 Girona Pseudopotential Equivalent Temperature Mixing Ratio Hours (hh:mm) P seudo. E qui . T e . / Mi x. R a t. ( K / g/K g ) 0 0 : 3 0 0 3 : 3 0 0 6 : 3 0 0 9 : 3 0 1 2 : 3 0 1 5 : 3 0 1 8 : 3 0 2 1 : 3 0 0 45 90 135 180 225 270 315 360 0 0.5 1 1.5 2 2.5 3 3.5 4
20030826 Sant Pau de Segúries
Velocity Direction (in degrees)
Hours (hh:mm) W in d ( m /s and º )
0 0 : 3 0 0 4 : 0 0 0 7 : 3 0 1 1 : 0 0 1 4 : 3 0 1 8 : 0 0 2 1 : 3 0 320.0 325.0 330.0 335.0 340.0 345.0 350.0 10.0 12.0 14.0 16.0
20030826 Sant Pau de Segúries
Pseudopotential Equivalent Temperature Mixing Ratio Hours (hh:mm) P seudo. E qui . T e . / Mi x. R a t. ( K / g/K g )
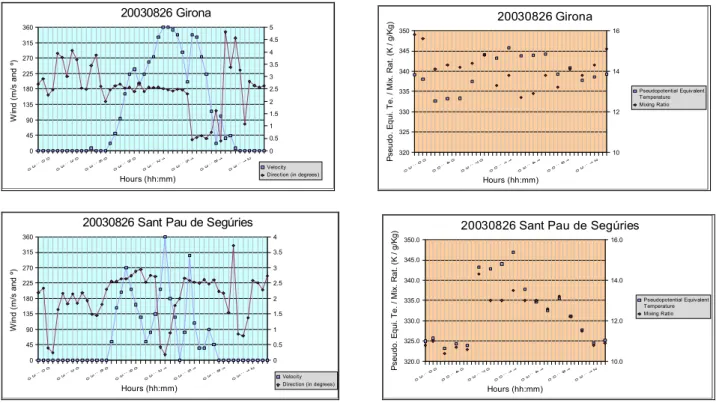
Figure 1.a and 1.b. Wind velocity and direction, pseudopotential equivalent temperature and
mixing ratio for meteorological stations of Girona and St. Pau de Segúries (dataset Servei
Meteorològic de Catalunya or SMC).
Figure 2.a. and 2.b. (a) Relative frequency (%) of radar reflectivity echo values equal or
greater than 35 dBZ at 15:00 UTC for June, July and August 2003; (b) Radar reflectivity
image (dBZ) of 26 August 2003 at 13:30 UTC.
Fig. 1. Wind velocity and direction, pseudopotential equivalent temperature and mixing ratio for meteorological stations of Girona and St. Pau de Seg´uries (dataset Servei Meteorol`ogic de Catalunya or SMC).
Table 1. Main features of simulations and experiment design.
7 Table 1. Main features of simulations and experiment design.
Mesoscale Model MM5 Regional model High resolution model (meso-γ )
Dynamics Non-hydrostatic Horizontal resolution (km) 36 12 4
Time steps (s) 100 36 12
Experiment design
(None for Reference) None 95% orography reduction Change water for dry soil Boundary conditions/
Initialization/(integration) HIRLAM (6 h) One-way interaction (24 hours) Explicit scheme Mixed-phase + graupel (Reisner) Cumulus scheme Grell None
PBL scheme High resolution Blackadar PBL Radiation scheme Cloud Rad. + Rapid Rad. Transfer Mod.
Soil scheme 5-layer Soil Shallow Convection Yes
Table 2. Precipitations reported by raingauge on 25 August2003. Locations in Figure 3.
Data provided by Precipitations (mm) and raingauge
CMTC (INM) 25.0 Vall de Bianya (VB) 32.0 Castellfollit de la Roca (CR)
38.0 Vidrà (V) 37.6 Collfred (C) SMC 35.0 Sant Pau de Segúries (PS)
11.0 Olot (O)
5.8 Molló (M) 3.8 Núria (N) SAIH 35.2 Sant Joan de les Abadesses (JA)
21.3 Castellar de N'Hug (CN) 33.7 Bagà (B) Table 3. Peak and total integrated Quantitative Precipitation Forecast (QPF).
Data Peak (mm) Total QPF (106 l)
Observed (raingauge) 38.0 None Gridding observed 32.0 41958.7 Forecast 4 km (12 to 15 UTC) 41.8 43668.7 Forecast 4 km (12 to 18 UTC) 70.2 140725.3 breeze channelled by Fluvi`a valley) could be the main
mech-anism that triggered this first convective cell. This area is located 50 km from the coastline.
Radar reflectivities higher than 50 dBZ persisted during the next 4 h showing an organization of the convection, with a maximum value of 60 dBZ at 15:50 UTC probably asso-ciated to hail. Interaction between outflows and sea breeze are probably the main mechanisms to triggering new con-vection and developing new thunderstorms. Thunderstorms southward propagation is the consequence of the combina-tion of the translacombina-tion component associated to the northern
flow at middle levels (eastern branch of the synoptic ridge). After 13:50 UTC a new convective cells were developed at the headwaters of the two slopes of Eastern Pyrenees.
Surface observations (mainly wind velocity and direction) show that sea breezes were well developed along the coast-line, and synoptic conditions suggest that valley breezes and upslope circulations were also present over the main ranges. Air mass characteristics (mixing ratio about 13 g/kg and pseudopotential equivalent temperature of about 345 K) were very similar in coastal stations and Eastern Pyrenees, which agrees with the hypothesis sea breezes blow inland over the
A. Callado and R. Pascual: Diagnosis and modelling of a summer convective storm 275
8
0 0 : 3 0 0 3 : 3 0 0 6 : 3 0 0 9 : 3 0 1 2 : 3 0 1 5 : 3 0 1 8 : 3 0 2 1 : 3 0 0 45 90 135 180 225 270 315 360 0 0.5 1 1.5 2 2.5 3 3.5 4 4.5 5 20030826 Girona Velocity Direction (in degrees)Hours (hh:mm) W ind ( m /s and º )
0 0 : 3 0 0 4 : 0 0 0 7 : 3 0 1 1 : 0 0 1 4 : 3 0 1 8 : 0 0 2 1 : 3 0 320 325 330 335 340 345 350 10 12 14 16 20030826 Girona Pseudopotential Equivalent Temperature Mixing Ratio Hours (hh:mm) P seudo. E qui . T e . / Mi x. R a t. ( K / g/K g ) 0 0 : 3 0 0 3 : 3 0 0 6 : 3 0 0 9 : 3 0 1 2 : 3 0 1 5 : 3 0 1 8 : 3 0 2 1 : 3 0 0 45 90 135 180 225 270 315 360 0 0.5 1 1.5 2 2.5 3 3.5 4
20030826 Sant Pau de Segúries
Velocity Direction (in degrees)
Hours (hh:mm) W in d ( m /s and º )
0 0 : 3 0 0 4 : 0 0 0 7 : 3 0 1 1 : 0 0 1 4 : 3 0 1 8 : 0 0 2 1 : 3 0 320.0 325.0 330.0 335.0 340.0 345.0 350.0 10.0 12.0 14.0 16.0
20030826 Sant Pau de Segúries
Pseudopotential Equivalent Temperature Mixing Ratio Hours (hh:mm) P seudo. E qui . T e . / Mi x. R a t. ( K / g/K g )
Figure 1.a and 1.b. Wind velocity and direction, pseudopotential equivalent temperature and
mixing ratio for meteorological stations of Girona and St. Pau de Segúries (dataset Servei
Meteorològic de Catalunya or SMC).
Figure 2.a. and 2.b. (a) Relative frequency (%) of radar reflectivity echo values equal or
greater than 35 dBZ at 15:00 UTC for June, July and August 2003; (b) Radar reflectivity
image (dBZ) of 26 August 2003 at 13:30 UTC.
Fig. 2. (a) Relative frequency (%) of radar reflectivity echo values equal or greater than 35 dBZ at 15:00 UTC for June, July and August 2003; (b) Radar reflectivity image (dBZ) of 26 August 2003 at 13:30 UTC.
Table 2. Precipitations reported by raingauge on 25 August2003. Locations in Fig. 3.
Data provided by Precipitations (mm) and raingauge
CMTC (INM) 25.0 Vall de Bianya (VB) 38.0 Vidr`a (V) 32.0 Castellfollit de la Roca (CR) 37.6 Collfred (C)
SMC 35.0 Sant Pau de Seg´uries (PS) 5.8 Moll´o (M)
11.0 Olot (O) 3.8 N´uria (N)
SAIH 35.2 Sant Joan de les Abadesses (JA) 33.7 Bag`a (B) 21.3 Castellar de N’Hug (CN)
Table 3. Peak and total integrated Quantitative Precipitation Fore-cast (QPF).
Data Peak (mm) Total QPF (106l)
Observed (raingauge) 38.0 None
Gridding observed 32.0 41958.7
Forecast 4 km (12:00 to 15:00 UTC) 41.8 43668.7 Forecast 4 km (12:00 to 18:00 UTC) 70.2 140725.3
Empord`a plain from the Gulf of Roses and are channelled up-stream by the main valleys. Upvalley winds (Ter and Fluvi`a valleys) also developed and their coupling enhanced upslope circulations and convergence at the headwaters.
3 Numerical simulations
In order to analyze the role of the main key components, i.e. the orography, the sea and upvalley breeze and their influ-ence to generate local converginflu-ence zones, several numeri-cal simulations have been conducted using the
Pennsylva-9 Figure 3. Kriged precipitation from INM and SAIH networks.
Figure 4.a and 4.b. (a). Quantitative Precipitation forecast and winds at interval time 12:00-15 :00 UTC; (b) The same forecast with 95 % orography reduction.
VB PS O JA B CR CN N M V C
Fig. 3. Kriged precipitation from INM and SAIH networks.
nia State University-National Center for Atmospheric Re-search mesoscale non-hydrostatic model version 3.5 (MM5) running with one-way triply nested grids from meso-β to meso-γ scales (domains with horizontal resolutions of 36, 12 and 4 km). Simulations characteristics are summarized in Table 1.
In general, there is a good agreement between the simu-lated precipitation field at 4 km and raingauge observations and radar imagery (compare Fig. 2b, 3 and 4). Furthermore
276 A. Callado and R. Pascual: Diagnosis and modelling of a summer convective storm
9
Figure 3. Kriged precipitation from INM and SAIH networks.
Figure 4.a and 4.b. (a). Quantitative Precipitation forecast and winds at interval time 12:00-15
:00 UTC; (b) The same forecast with 95 % orography reduction.
VB PS O JA B CR CN N M V C
Fig. 4. (a) Quantitative Precipitation forecast and winds at interval time 12:00-15:00 UTC; (b) The same forecast with 95% orography reduction.
timing and location of the simulated convection adjust well with observations of thunderstorm development at both slopes of Pyrenees as with the development of new cells southward of first generation cell. In particular it is worth noting that the location and amount of peak and total in-tegrated Quantitative Precipitation Forecast (QPF) agree (slight higher) with observations between 12:00 UTC and 15:00 UTC, as we can see in Table 3. After 15:00 UTC the simulations show an excessive precipitation associated to the second convection generation, possibly related to an excess of humidity availability in boundary conditions.
Surprisingly simulation of breeze at Gulf of Roses failed, but in spite of this fact the experiment reproduces a moisture convergence zone (not shown) between hypothetical upval-ley Ter and tributaries of Fluvi`a breezes (see Sect. 2).
With the aim of evaluating the role of key components in the triggering and development of convection in the Eastern Pyrenees two more 4 km resolution simulations were per-formed with:
1. A 95% orography reduction in order to evaluate the role of sea and upvalley breezes and upslope winds (Fig. 4b); and
2. A transformation of the Mediterranean Sea (moisture available 100) to a dry land (moisture available 30) to find out the role of sea breezes supplying moisture to the convection generated.
The first one shown that the sea breezes appears as well, but they go so further inland and converge with eastward Atlantic flow. A very similar total QPF was obtained, but displaced 40–60 km to the north and delayed 3 h. Moreover the breeze
appears later and weaker; this fact may be in agreement with the supposition that upvalley and sea breezes are coupled in-creasing the flow strength.
Surprisingly the second one is quite similar to the refer-ence simulation between 12:00 UTC and 15:00 UTC. Lateral boundary conditions generated a sea breeze into the domain flowing over flat terrain as far as Eastern Pyrenees. Although the development of upvalley breezes would be the same, they appear slight weaker due to the weaker sea breeze show-ing once again the linkshow-ing role between sea and mountain breezes.
4 Conclusions
The development of thunderstorms over the Eastern Pyrenees under anticyclonic and relatively stable conditions has been analyzed using surface observations, radar imagery and sim-ulations of a mesoscale numerical weather prediction model. From this analysis it is possible to suggest some mech-anisms that could explain the high frequency of convective storms over this area in late spring and summer related to the local orography and maritime influence:
1. The maximum frequency of storms in the afternoon is associated to the diurnal cycle with the intense develop-ment of upvalley and slope circulations and sea breezes (Terradelles, 1997);
2. The orography plays an important role generating local convergence zones and channelling the sea breezes fol-lowing the main valleys;
A. Callado and R. Pascual: Diagnosis and modelling of a summer convective storm 277 3. The coupling between upvalley and sea breezes supply
an extra moisture at low levels that could explain the higher frequency of thunderstorms in this area in com-parison with Western Pyrenees where sea breezes can not reach to the headwaters of the tributaries of the Ebro river;
4. A low level local moisture convergence, between west-ern Ter upvalley breeze and eastwest-ern tributaries Fluvi`a upvalley breezes linked to Gulf Roses breeze, is identi-fied triggering recurrent summertime convection.
Acknowledgements. The authors thanks to the Spanish Instituto Nacional de Meteorolog´ıa for providing data and support and Departament d’Astronomia i Meteorologia of Barcelona University for providing SAIH data.
Edited by: L. Ferraris
Reviewed by: V. Kveton and another referee
References
Mart´ın, F.: Identificaci´on objetiva de estructuras convectivas a partir de los datos radar del PPI/CAPPI bajo en MCIDAS [CD-ROM], V Simposio Nacional de Predicci´on, Instituto Nacional de Mete-orolog´ıa (INM), Madrid (Spain), 20–23 November 2001. Pascual, R., Callado, A., and Berenguer, M.: Convective storm
initi-ation in central Catalonia, Third European Conference on Radar in Meteorology and Hydrology (ERAD), Visby, Island of Got-land (Sweden), 6–10 September 2004, ERAD Publication Series, 2, 464–468, 2004.
Terradelles, E.: Focalizaci´on de la convecci´on estival en Catalu˜na, IV Simposio Nacional de Predicci´on, Instituto Nacional de Mete-orolog´ıa (INM), Madrid (Spain), 15–19 April 1996, pp. 133–142. 1996.
Terradelles, E.: Main features of the distribution of the atmospheric electric activity in Catalonia and the surrounding Mediterranean area, INM/WMO International Symposium on Cyclones and Hazardous Weather in the Mediterranean, Palma de Mallorca (Spain), 14–17 April 1997, pp. 535–540, 1997.
Vilar, F.: Situaciones, riesgos y recurrencia de tormentas inten-sas en el Pirineo Oriental, Situaciones de Riesgo Clim´atico en Espa˜na, II Reuni´on del Grupo de Climatolog´ıa de la Asociaci´on de Ge´ografos Espa˜noles, 15–17 September 1995, pp. 105–116, 1995.

![Mémoire en science politique[BR]- Travail écrit : "L'influence de l'imaginairecollectif sur le politique : le cas du nationalisme écossais"[BR]- Séminaired'accompagnement à l'écriture](data:image/gif;base64,R0lGODlhAQABAIAAAP///wAAACH5BAEAAAAALAAAAAABAAEAAAICRAEAOw==)