First International Conference on Bio-based Building Materials
June 22nd - 24th 2015 Clermont-Ferrand, France
HYSTERESIS PHENOMENON IN HEMP CONCRETE
Y. Aït-Oumeziane1*, M. Bart2, S. Moissette2, C. Lanos2, F. Collet2, S. Pretot2, 1Université de Bordeaux, I2M Institut de Mécanique et d’Ingénierie, Bordeaux, France 2 Université Européenne de Bretagne, LGCGM Laboratoire de Génie Civil et de Génie
Mécanique, Rennes, France
*Corresponding author; e-mail: yacine.ait-oumeziane@u-bordeaux.fr
Abstract
Hemp concrete participates in a process of sustainable development in the housing field by reducing environmental impact and improving hygrothermal comfort. This kind of hygroscopic bio-material is characterized by a strong hysteretic hydric behavior. At a given relative humidity, hysteresis results in more or less differences between the equilibrium moisture content obtained during adsorption or desorption. This phenomenon affects moisture transfer in hygroscopic building materials. In this paper, experimental and numerical study on hysteretic behavior of the hemp concrete sorption process is presented.
Experimental intermediate scanning curves are measured using the glass jar method. This experimental data is used to fit hysteresis models. In this study, one hysteresis model is selected for its suitability to represent the hysteretic hydric behavior of hemp concrete. It is based on the knowledge of the main adsorption and desorption curves respectively built from the dry to the saturated state and from the saturated to the dry state. Nevertheless, as for many porous bio-materials, the saturated state is difficult even impossible to reach. In order to overcome this issue, an original approach is presented leading to the identification of the main desorption curve from a primary desorption curve.
The implementation of a suited hysteresis model in a heat and moisture transfer model allow evaluating and discussing the influence of this phenomenon in the transient hygrothermal response of hemp concrete to hydric loadings as on the sample scale as on the wall scale. Keywords:
Hemp concrete; Hysteresis; Initial moisture content; Hygrothermal behavior; Heat and moisture transfer
1 INTRODUCTION
This study deals with hemp concrete, a mixture of hemp shiv and lime. Hemp concrete has low impact on environment [Pretot 2014] and has interesting hygrothermal properties as building material [Cerezo 2005; Chamoin 2013; Samri 2008; Collet 2014]. A moisture buffer value (MBV) above 2 g/m2/%RH qualifies hemp concrete as an excellent hydric regulator [Collet 2012; Collet 2013].
As for many hygroscopic materials, a significant hysteresis occurs in hemp concrete sorption process. The hysteresis phenomenon is attributed mainly to the pore space morphology (“ink bottle effect”), the effects of spatial arrangement of pores and variation in liquid-solid contact angle. In adsorption phase, an increase of relative humidity involves an increase of moisture content. In desorption phase, less moisture is released from the material than moisture up taken in adsorption. The equilibrium moisture content depends not only on the relative humidity but also on the hydric history. The differences in moisture content at the same relative
humidity for hemp concrete during adsorption and desorption cycles measured in [Aït Oumeziane 2014] are presented in this paper.
Three main groups of hysteresis models can be found in literature. Phenomenological hysteresis models based on the ink bottle concept were developed by Mualem [Mualem 1974]. This group of models has been improved by successive studies giving more accurate results by considering the phenomenon of blockage against air (and water) entry [Mualem 1984; Mualem 2009]. A second approach proposed by Scott et al. [Scott 1983] describes the scanning curves with the same shape parameters as those for the main adsorption and desorption curves. Empirical models like Pedersen’s model use the weighted values of the hydric capacity to model scanning curves [Pedersen 1990].
Comparisons between experimental results show that among the investigated models, Huang’s hysteresis model [Huang 2005] is the most suitable to represent the hydric behavior of hemp concrete [Aït Oumeziane 2013; Aït Oumeziane 2014].
This hysteresis model is then implemented in a heat and moisture transfer model. The aim is to compare experimental and numerical transient hygrothermal responses of hemp concrete submitted to cyclic hydric isothermal loadings. The experimental results presented in this paper were collected by [Collet 2012]. The results show the relevance to take into account the hysteresis phenomenon [Aït Oumeziane 2014]. They also highlight the influence of the initial moisture content.
A similar approach is thus performed to analyze the influence of hysteresis on the transient hygrothermal response of a hemp concrete wall. This study is based on experimental results collected on a hemp concrete wall placed between two climatic rooms. This equipment is able to set realistic climatic conditions. The wall is instrumented to measure temperature and relative humidity distributions in hemp concrete. This paper focuses on a test case where temperatures are nearly the same on the both sides of the wall and relative humidity gradient occurs.
On the hemp concrete wall scale, the influence of hysteresis is then discussed by comparing experimental and numerical hygrothermal responses.
2 HEAT AND MOISTURE TRANSFER MODEL
According to Künzel formalism [Künzel 1995], the driving potentials of the 1D hygrothermal model can be expressed in terms with two flow potentials temperature T and relative humidity φ.
The governing system of equations of moisture and heat transfer is given in equations (1) and (2).
(
)
[
δ ϕ]
[
( )
ϕ]
ϕ ξϕ =∇ ∇ +∇ ∇ ∂ ∂ l sat p p D t (1)(
)
[
]
(
)
(
)
[
(
)
]
[
]
(
)
( )
[
ϕ]
ϕ δ λ ξ ρ ϕ ∇ − ∇ + ∇ − + + ∇ ∇ = − + ∂ ∂ l ref l sat p ref v v ref l D T T c p T T c l T T T c t T c* 0 (2) In these equations, ξφ[kg.m-3] is the hydric capacityξφ = ρ0.du/dφ with u [kg/kg] the moisture content and ρ0 [kg.m-3] the density of the dry material. δp [kg.m-1.s– 1
.Pa-1] is the vapour permeability, psat [Pa] the saturated vapour pressure, Dl [kg.m-1.s-1] the liquid conduction coefficient, Tref [K] the reference temperature (equal to 296.15 K), cv [J.kg-1.K-1] and cl [J.kg-1.K-1] the specific heat capacity of respectively vapor and liquid water, c* [J.kg-1.K-1] the equivalent specific heat capacity of the moist material, λ [W.m-1.K -1] the thermal conductivity of the moist material and l
v the latent heat of evaporation (2.45.106 J.kg-1 at the reference temperature of 296.15 K).
Neumann boundary conditions are implemented. Heat transfer coefficients are calculated by a set of usual correlations under the hypothesis of an isothermal rough plate submitted to natural convection [Incropera 2007]. The surface of hemp concrete is rough increasing surface exchange. For hemp concrete, a roughness coefficient of 2 gives a good estimation of the surface exchange [Aït Oumeziane 2013]. Mass transfer coefficients are deduced from the Lewis relation [Lewis 1922].
The governing system of strongly coupled unsteady differential equations is implemented in Matlab with a finite differences method. The model was
benchmarked against the international benchmark HAMSTAD WP2 [Hagentoft 2004]. The exercises of this benchmark are suited to assess the performance and accuracy of hygrothermal models in one dimensional configuration for multi-layered wall submitted to relative humidity, temperature or total pressure gradients. The model was validated against all the test cases of the benchmark in [Aït Oumeziane 2011].
3 HYSTERESIS PHENOMENON: ON THE SAMPLE SCALE
3.1 Experimental characterization
In this paper, hysteresis is studied for two hemp concretes denoted as HC1 and HC2. Both have the same mix design with a weight ratio of hemp shiv and lime-based binder of about 2/3. Fresh hemp concrete is filled into moulds and compacted to produce hemp concrete blocks. HC1 and HC2 differ in bulk density because of the heterogeneity of compaction: ρHC1 = 450 kg.m-3 and ρ
HC2 = 396 kg.m-3.
HC1 hemp concrete is characterized in the framework of two collaborative French research projects (a regional project PRIR “Ecomatx” and a national project ANR “Betonchanvre”). All details regarding the measurement of physical and hygrothermal characteristics are in [Chamoin 2013] and [Collet 2014].
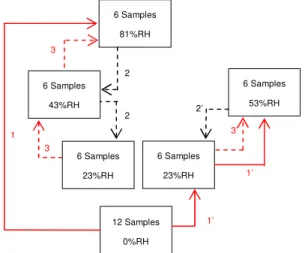
Complementary experimental tests were carried out to identify hemp concrete hysteresis behavior in current relative humidity range. As no HC1 samples were available, intermediate scanning curves on HC2 are provided in the present work. The glass jar method was used to determine the sorption isotherm up to 81%RH and two sorption cycles in compliance with the EN ISO 12571 procedure. Samples were cut in HC2 blocks conditioned for 2 years in a climatic room at 23°C and 50%RH. A total of 12 cubic samples (4.5×4.5×4.5 cm3) were used. This size of sample ensures to consider a representative elementary volume [Collet 2004; Evrard 2008]. A balance with an accuracy of 0.1 mg is used to monitor the samples’ weights. Equilibrium was reached when the change in a sample mass is less than 0.1% within 24 h.
Fig. 1: Schematic representation of the experimental procedure.
All samples were first dried under vacuum in silica gel at 23°C to constant mass. After conditioning, samples were placed in glass jars above a saturated salt solution at 23°C. The procedure of determination of the
12 Samples 0%RH 6 Samples 53%RH 6 Samples 23%RH 6 Samples 43%RH 6 Samples 81%RH 1’ 1 1’ 2 2 2’ 3 3 3’ 6 Samples 23%RH
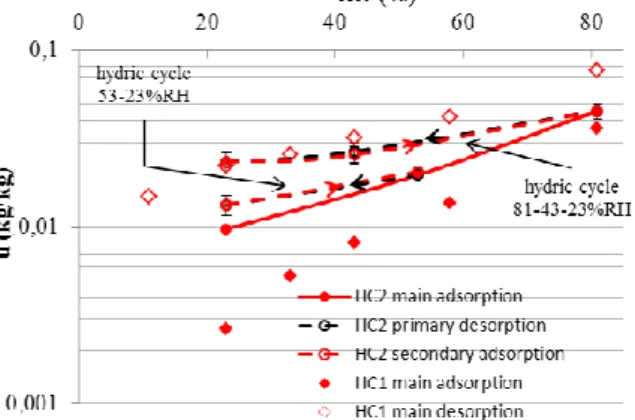
main adsorption, primary desorption and secondary adsorption isotherm data points is reported in figure 1. The experimental results are presented in figure 2. At each relative humidity level, HC2 has higher moisture content than HC1. This is due to the lower compaction of HC2. The compaction affects the pore structure of the material (HC2 has a higher open porosity than HC1) and modifies moisture storage. As expected, the slopes of the intermediate scanning curves are lower than the slope of the main adsorption curve.
The hydric capacity of hemp concrete is significantly reduced during sorption cycles. These results confirm that hysteresis plays a significant role in the storage and release of moisture. The primary desorption curve is very close to the secondary adsorption curve. This suggests that the hydric capacity is mainly modified when a shift in adsorption / desorption occurs on the main curve. It could be due to the low level of the higher relative humidity (81 %). A cycle sorption at a relative humidity near asymptotic hydric behavior (for example 95%RH) would probably lead to significant differences.
Fig. 2: HC1 and HC2 experimental main adsorption and desorption measurements and HC2 primary desorption and secondary adsorption measurements.
3.2 Hysteresis modeling
Three hysteresis models have been studied and compared to evaluate their ability to represent the hydric behavior of hemp concrete: an empirical one, Pedersen’s model, a phenomenological one, Carmeliet’s model based on Mualem’s model and a mathematical one, Huang’s model based on the Scott and Parker formalism. In comparison with the experimental results, Huang’s model is the one which give the more consistent results [Aït Oumeziane 2013; Aït Oumeziane 2014]. Only this model is presented and used in this paper.
Huang’s model is described in details in [Huang 2005]. Equations 3 and 4 respectively describe the adsorption and desorption scanning curves after a series of alternating processes of desorption and adsorption:
( )
(
)
sat ads r s r u u i u i u i u i uϕ, = ()+ ()− () (ϕ) (3)( )
(
)
sat des r s r u u i u i u i u i uϕ, = ()+ ()− () (ϕ) (4)where ur(i) and us(i) are respectively the residual and saturated moisture contents of the scanning curve indexed i. The main adsorption and desorption curves give residual and saturated moisture content values at
order 0: ur(0)=0 and us(0)=usat. The calculation of these parameters is based on the perfect closure of the scanning curve at reversal points. Scanning curve indexed i includes the last reversal point (φi,ui) and the penultimate reversal point (φi-1,ui-1). Calculating ur(i) and us(i) finally leads to solve a linear system of two equations.
In a theoretical framework, main adsorption and desorption curves are physical bounds of sorption process in a range between 0% and 100%RH. In this paper, Van Genuchten (VG)’s is used to model these curves [Van Genuchten 1980].
( )
+ = − −(1 1) ) ln( 1 j j g M RT u u l j sat j η η ϕ α ϕ (5)where usat [kg/kg] is the saturated moisture content (calculated using the value of the open porosity), R [8.314 J.mol-1.K−1] the ideal gas constant, M
l [0.018 kg.mol−1] the molar water mass, g [9.81 m2.s−1] the gravity acceleration and T [296.15 K] the reference temperature. As it is often the case for porous materials, the model parameters α and η are derived to fit the experimental data. Index j indicates which sorption process is considered, adsorption or desorption.
Usually, the dry state is experimentally achieved drying samples under vacuum in silica gel. Even if silicate gel monitors ambient air at 2–3%RH, the corresponding moisture content at this value is equivalent to one at 0%. To model the main adsorption curve, the parameters αads and ηads are derived to fit the experimental adsorption.
A main difficulty even impossibility concerning very porous bio-based materials is to reach the saturated state. Generally, only experimental data of moisture contents between 0 and 97%RH are known. As the main adsorption curve is almost asymptotic at 100%RH, the corresponding moisture content at this value is significantly different from the moisture content at 97%RH. The experimental desorption curve 97– 0%RH is usually considered as a main curve but it corresponds in practice to a primary desorption scanning curve. According to this assertion, an alternative approach is proposed [Aït Oumeziane 2014]: the parameters (αdes, ηdes) of the main desorption curve are calculated by fitting the experimental primary desorption curve 97-0%RH. This primary scanning curve (indexed 1) is given by equation 4. The last reversal point is (φ1=97%,u1=uads(97%)). The penultimate reversal point is (φ0=0%,u0=uads(0%)). The least squares method is used to fit the models to the experimental desorption curve of 97–0%RH. Once main adsorption and desorption curves are fitted to experimental data, any scanning curve can then be modelled using hysteresis models.
3.3 Comparison between experimental and numerical results
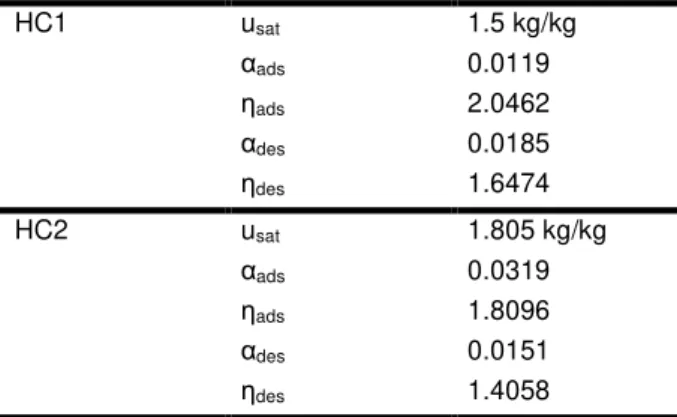
The main adsorption and desorption curves were fitted to experimental data according to the approaches previously described. The parameters are listed in Table 1, and figure 3 provides the experimental data and the fitted main adsorption and desorption curves.
Tab. 1: Parameters of VG’s model for HC1 and HC2 HC1 usat 1.5 kg/kg αads 0.0119 ηads 2.0462 αdes 0.0185 ηdes 1.6474 HC2 usat 1.805 kg/kg αads 0.0319 ηads 1.8096 αdes 0.0151 ηdes 1.4058
In order to estimate the impact of hysteresis in a current relative humidity range, the primary desorption curve 81–23%RH is also built in figure 3. Compared with the hydric capacity derived from the main adsorption curve, Huang’s model decrease the hydric capacity by about 18%.
Fig. 3: HC1 experimental and numerical adsorption and desorption curves
Fig. 4: HC2 experimental and numerical adsorption and desorption curves
HC2 hemp concrete is now considered to study the intermediate scanning curves. In accordance with the approach previously described, the main adsorption and desorption curves were fitted to experimental data. However, as the experimental desorption curve (97– 0%) was unknown for HC2 hemp concrete, the parameters αdes and ηdes were fitted taking the experimental primary desorption curve 81–43–23%RH. These parameters are provided in Table 1. Figure 4 gives the experimental data, the fitted main adsorption and primary desorption 81–43–23% curves and the predicted primary desorption 53–23% RH and secondary adsorption 23–43–81% RH and 23–53%RH curves. All predicted (desorption as well as adsorption)
scanning curves are in good agreement with the experimental data.
3.4 Hemp concrete response to transient hydric loadings
The performance of the hysteresis model under transient conditions is analyzed using a test case from the literature. The experimental set up is described in details in [Collet 2013]. This test, named MBV test, deals with moisture uptake and release in samples of hemp concrete in accordance with the Nordtest protocol [Rode 2005]. Five samples are placed in a climatic chamber. Temperature is equal to 23°C during the test. Initially in equilibrium state at 50%HR, specimens are then submitted to daily cyclic variations: 8 hours at 75% RH and 16 h at 33% RH. The samples are weighted and the cycles are repeated until the weight variations become constant. As the discrepancies between experimental results for the five samples are negligible, only the average of the measurements is given in the paper.
Since the samples are sealed on all but one surface with aluminum tape (the exposed surface area is about 228.5 cm2), heat and mass transfer through sample is considered as one dimensional.
This case is relevant for the present study to investigate the effects of hysteresis of hemp concrete under transient conditions on the sample scale. The hemp concrete used for this study is HC1. As previously mentioned, HC1 properties have been measured in laboratory conditions. Detailed description of the experiments can be found in [Chamoin 2013] and modeling in [Aït Oumeziane 2013].
As advised by the Nordtest protocol, the mass surface coefficient is equal to 5×10⁻⁷ Pa.kg−1.m−2.s−1. This value is based on the air velocity around the samples equal to about 0.1 m.s−1.
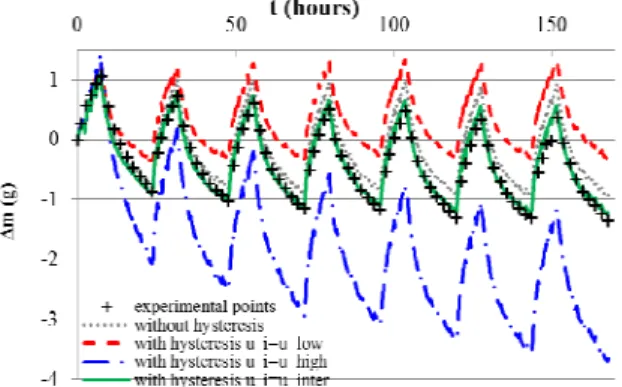
Due to the hysteretic behavior of hemp concrete, the value of initial moisture content must be discussed. The samples used in the test came from blocks which were submitted to indoor temperature and relative humidity variations during a storage period of 3 years and 10 months. As the samples were not dried before the test, the initial moisture content is unknown. To take into account this uncertainty, three initial moisture contents are investigated. Firstly, initial moisture content is predicted by the main adsorption curve and is named ui,low. Secondly, initial moisture content is predicted by the main desorption curve and is named ui,high. These two extreme values define a range in which the real moisture content is. The real initial moisture content is due to a sequence of relative humidity variations to which the material is submitted during its storage. To achieve this initial moisture content, a fictitious sequence is assumed. Starting from the dry state, the sample is numerically exposed to 85%RH during 2 days and then stabilized at 50%RH during 30 days. The corresponding initial moisture content called ui,inter is located between ui,low and ui,high. Figure 5 provides experimental data and predicted evolution of the moisture mass during the hydric loading cycles for four numerical setups: model without hysteresis and hysteresis model using the three assumed initial moisture contents ui,low, ui,inter and ui,high. To underline the effects of hysteresis, numerical results without hysteresis were performed by using the main adsorption curve to model the evolution of the moisture content.
Fig. 5: HC2 experimental and numerical adsorption and desorption curves built with Huang’s model
During the test, the moisture mass globally decreases. Numerical predictions of hysteresis model using initial moisture contents ui,low and ui,high depict large deviations with experimental data. These curves at least give physical boundaries of the evolution of the moisture content, and as a consequence, the experimental results remain between both. Hysteresis model using initial moisture content ui,inter predicts numerical results in very good agreement with the experimental ones. Discrepancies between models without hysteresis and with hysteresis (ui,inter) are negligible for the first cycles but become more significant for the last ones. In conclusion, hysteresis model with relevant initial moisture content assesses with more accuracy the moisture content of hemp concrete under transient conditions.
The hysteresis model using ui,inter reduces the hydric capacity by 20% (compared to the model without hysteresis), which explain the better agreement with the experimental data.
4 INFLUENCE OF HYSTERESIS ON THE WALL SCALE
4.1 Experimental Setup
An experimental study was performed to investigate at full scale the response of a hemp concrete wall submitted to transient hygrothermal conditions. The experimental setup of the wall is described in details in [Pretot 2012]. A mixed wall built with 31 blocks of precasted hemp concrete and timber framework stood as the wall separation between two climatic rooms (figure 6). Hemp concrete blocks were cast from moulds and were 60 cm long, 30 cm wide and 30 cm high. The dimensions of the wall were 2.4m×2.1m×0.3m. This wall is representative of a French typical house built with hemp concrete blocks. Climatic room 1 was able to set ambient air temperature between 18°C and 27°C and relative humidity between 30% and 60%, climatic room 2 temperature between -5°C and 35°C and relative humidity between 30% and 90%.
Heating was insured by convectors, cooling and drying by a refrigeration group and wetting by vapor humidifiers. Hygrothermal regulation was insured by universal DR4020 regulators defining a set point and a bandwidth which governs the facilities operating of the room. Room 1 / T: 18°C to 27 °C / RH: 30% to 60% 30,5 cm 35 cm 34 cm Room 2 / T: -5°C to 35 °C / RH: 30% to 90% x 0
Fig. 6: Hemp concrete wall configuration
Temperature and relative humidity sensors were put inside the wall, at wall surfaces and in both surroundings to collect temperature and relative humidity variations. Within the wall, sensors were set up after drilling of the wall at different locations. Holes were then filled with lime-based mortar. The drilling direction for each hole was done to limit their effects on one-dimensional hygrothermal transfer.
The sensors were located at depths about 7.5 cm, 11.5 cm, 18.5 cm and 22.5 cm from the room 1 side. An acquisition system collected data every five minutes. Thermocouples (type K) had an accuracy of ±0.1°C. According to the manufacturer, relative humidity sensors (Sensirion SHT75) were able to collect both temperature and relative humidity with accuracy respectively of ±0.3°C and ±1.8%RH at 25°C. Finally, the position uncertainty of these sensors was evaluated at ± 7.5 mm considering the Sensirion’s measurement head width and their effective locations. The analysis of relative humidity and temperature distributions through a block, between two blocks and in the wooden framing line at different heights showed that the geometry has only a little influence on the hygrothermal response of the wall [Pretot 2012]. In this paper, data collected in a block located in the central part of the wall are used.
4.2 Experimental test case
Before the beginning of the test, the wall is stabilized at 40%RH and 23°C by keeping constant relative humidity and temperature in rooms 1 and 2. The mean values collected at the beginning of the test in the wall (time t=0) are 41%RH and 23°C.
During the test, temperature is set to 23°C in both rooms. Relative humidity in room 1 is set to 40% and relative humidity in room 2 varies between 30% and 80%. The measured temperatures and relative humidity in rooms 1 and 2 are presented in figure 7. The sequence lasts 19 days. Until the 9th day, the relative humidity in room 2 is maintained to around 80%. The wall is submitted to adsorption phase. After the 9th day, relative humidity in room 2 is highly decreased. The wall is submitted to desorption phase.
Fig. 7: Hemp concrete wall configuration.
4.3 Hemp concrete properties
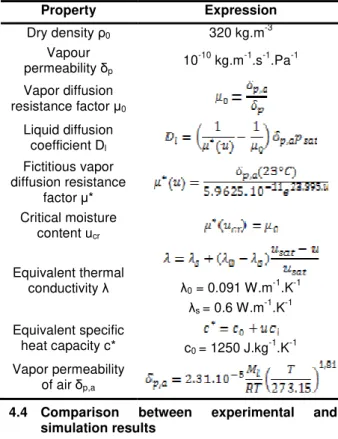
The hemp concrete density of the wall is slightly lower than the HC1 and HC2 densities. This is due to the compaction process. In fact, this hemp concrete has a dry density of 320 kg.m-3 and is named HC3.
The hygrothermal properties of HC3 determined at 23°C are listed in table 2 [Aït Oumeziane 2013].
Tab. 2: HC3 hygrothermal properties. Property Expression Dry density ρ0 320 kg.m-3 Vapour permeability δp 10 -10 kg.m-1.s-1.Pa-1 Vapor diffusion resistance factor µ0 Liquid diffusion coefficient Dl Fictitious vapor diffusion resistance factor µ* Critical moisture content ucr Equivalent thermal conductivity λ λ0 = 0.091 W.m-1.K-1 λs = 0.6 W.m-1.K-1 Equivalent specific heat capacity c* c0 = 1250 J.kg-1.K-1 Vapor permeability of air δp,a
4.4 Comparison between experimental and simulation results
In the hygrothermal conditions imposed to the wall, heat transfer coefficients are between 1 and 5 W.m-2.K -1 and mass transfer coefficients between 2 and 5.10-8 kg.Pa-1.m-2.s-1.
Numerical initial conditions are fixed at 41% for relative humidity and at 23°C for temperature.
Unfortunately, the moisture history of the material is not known and the knowledge of moisture content is experimentally non accessible. Before the construction of the wall, hemp concrete blocks were stored and submitted to indoor hydric and thermal variations. Then the wall was submitted to continuous thermal and hydric variations during the successive tests before the selected test sequence. Due to the hysteretic behavior of hemp concrete, the initial moisture content at the beginning of the test sequence remains unknown. Simulations results are presented to demonstrate how hysteresis modeling improves numerical results of relative humidity and temperature predictions in the hemp concrete wall exposed to relative humidity gradient. Moreover, the influence of the initial moisture content is discussed in this section.
First, as initial condition for moisture content, two cases are considered: low initial moisture content taken on the main adsorption curve at 41%RH and high initial moisture content taken on the main desorption curve at 41%RH. For low initial moisture content, two numerical runs are performed: in the first one the evolution of the moisture content is described by the main adsorption curve (without hysteresis) and in the second one by Huang’s hysteresis model (ui,low). For high initial moisture content (ui,high), one numerical run is performed with the moisture content described by the Huang hysteresis model.
Moreover, a hydric scenario is presented in this paper. It aims to simulate a possible moisture history known by the wall before the test sequence. In this scenario, both room 1 and room 2 temperatures are set to 23°C. Relative humidity in room 1 is set to 41% whereas
relative humidity in room 2 is set to 75% during 10 days then stabilized after a final stage at 41%RH during 30 days. At the beginning of the test sequence (time t=0), the hydric pre-loading result in an initial moisture content gradient induced through the wall. Experimental and numerical results are presented at two depths from the room 1 side: at 22.5cm (figures 8a) and 9a)) and at 7.5 cm (figures 8b) and 9b)).
Fig. 8: Experimental and numerical relative humidity evolutions at depth 22.5 cm a) and 7.5 cm b) from the
room 1 side.
Experimentally, figure 8 shows that relative humidity increases inside the wall during the adsorption stage then decreases during the desorption stage. Relative humidity distribution inside the wall is mainly governed by the room 2 / room 1 relative humidity gradient. Indeed, in isothermal conditions, the different moisture driving forces (vapor pressure, capillary pressure and moisture content) are governed by relative humidity. Both relative humidities and temperatures instantly decrease in the wall at the moment of the adsorption/desorption shift.
In this test, there are few differences between temperatures in rooms 1 and 2. In figure 9, temperature in the wall appears more or less constant around the value of 23°C but seems relatively sensitive to the sorption phase change. A part of the vapor entering the hemp concrete wall is adsorbed or condenses in the pores with the rise of relative humidity. This phase change is accompanied by sorption or latent heat release which explains a rise of temperature in the wall during the adsorption stage. Evaporation phenomenon results in a decrease of temperature in desorption.
The evolution of relative humidity during adsorption stage is the same without hysteresis and for low initial moisture content. During desorption stage, a better agreement between experimental and numerical results is found with the hysteresis model. This is explained by the moisture content evolution through
the wall. Without hysteresis, moisture content continues to follow the main adsorption curve during desorption stage. In desorption, the hysteresis model modifies the quantity of moisture released by the wall. Moisture content follows a primary desorption curve with a lower hydric capacity. Hydric capacity with hysteresis is about 2.8.10-2 kg/kg with hysteresis and about 5.8.10-2 kg/kg without hysteresis. The decrease of the hydric capacity and, to a lesser degree, the higher moisture content level which conditions the hygrothermal properties evolution, explain the better results got with the hysteresis model in desorption phase.
Fig.9: Experimental and numerical temperature evolutions at depth 22.5 cm a) and 7.5 cm b) from the
room 1 side.
Furthermore figure 8 shows that a slight overestimation of the effective relative humidity in the wall is obtained for high initial moisture content in adsorption stage. In desorption stage a reversal trend is globally observed. When initial moisture content is on the main desorption curve, moisture content follows a primary adsorption curve during adsorption stage. In desorption when relative humidity decreases, moisture content follows a secondary desorption curve.
For a high moisture content level, the hygrothermal properties conditioned by moisture content significantly affects moisture transport. Due to a very high liquid diffusion coefficient, moisture transport under liquid phase becomes predominant and mainly governs moisture transfer.
The effect of hysteresis on temperature distributions confirms the influence of moisture transfer on heat transfer. For low initial moisture content, temperature distributions with and without hysteresis are the same in adsorption phase. In desorption phase, figure 9 shows that temperature is higher with hysteresis than without. In the studied test sequence, adsorption/desorption and evapo-condensation
phenomena mainly govern the temperature variations during the successive sorption processes.
Simulation of the hydric history improves the numerical results. If no significant differences are observed at 22.5 cm, the implementation of a hydric scenario provides simulated results in better agreement with experimental ones in areas close to the room 1 at 7.5 cm both for temperature and relative humidity evolutions. In comparison with the results of the previous simulations, the reduction of the hydric capacity and the higher moisture content level in the wall is not limited to the desorption stage but also occur during adsorption stage.
5 CONLUSION
This paper provides some explanations on hysteresis influence on relative humidity and temperature distributions through the wall. The comparison of the experimental and numerical results highlights the relevance to consider hysteresis and shows the importance to identify the effective initial moisture content of the wall.
By comparing experimental and numerical hygrothermal responses with and without hysteresis modeling, this study confirms that the simple use of the main adsorption curve is insufficient to describe the effective evolution of the moisture content. Considering hysteresis phenomenon with a model suited to the hemp concrete hydric behavior has significantly improved the numerical results.
Furthermore, more accurate estimation of moisture storage improves both temperature and relative humidity in the wall. The better evaluation of the relative humidity distribution allows a better representation of vapor pressure gradients, driving force of heat transport by evaporation and condensation. Simulated temperature distributions are also in better agreement with experimental ones. The moisture content through the wall is also affected by the moisture history of the material. In this paper, simulating a relevant hydric history of the material gives relevant results on the full depth of the wall. Identifying the moisture content distribution through the wall seems thus necessary to predict the hygrothermal response of a wall submitted to climatic variations. Within this framework, numerical simulations are valuable tools.
Finally, the hygrothermal modelling, taking into account the hysteretic behavior of hemp concrete, would allow accurate energy balance of the wall. It would highlight the effect of hydric behavior on this balance.
6 ACKNOWLEDGMENTS
The authors acknowledge financial support of French Research Agency (ANR) and Region Bretagne for the experimental part of this work, within the frame of the projects BETONCHANVRE ANR-06-MAPR-0002 and PRIRECOMATX 2005.
The authors also thank the Easychanvre society for its contribution to the manufacturing of hemp concrete sampling.
7 REFERENCES
[Aït Oumeziane 2011a] Aït Oumeziane, Y.; Bart, M.; Moissette, S.; Lanos, C.; Modélisation du transfert
d’air, de masse et de chaleur aux travers de parois multicouches, Xème Colloque Inter-universitaire Franco-Québécois, Chicoutimi, Canada, 2011
[Aït Oumeziane 2011b] Aït Oumeziane, Y.; Bart, M.; Moissette, S.; Lanos, C.; Prétot, S.; Collet, F.; Hygrothermal behaviour of a hemp concrete wall: influence of sorption isotherm modelling, Proceedings of 9th Nordic Symposium on Building Physics, Tampere, Finland, 2011b.
[Aït Oumeziane 2013] Aït Oumeziane, Y.; Evaluation des performances hygrothermiques d’une paroi par simulation numérique : application aux parois en béton de chanvre [In French], PhD thesis, Université Européenne de Bretagne - Institut National des Sciences Appliquées de Rennes, 2013.
[Aït Oumeziane 2014] Aït Oumeziane, Y.; Bart, M.; Moissette, S.; Lanos, C.; Hysteretic behaviour and moisture buffering in hemp concrete, Transport In Porous Media, 2014, n°103, p515-33.
[Cerezo 2005] Cerezo, V.; Propriétés mécaniques, thermiques et acoustiques d’un matériau à base de particules végétales : approche expérimentale et modélisation théorique [In French], PhD thesis, Ecole Nationale des Travaux Publics de l’Etat, 2005.
[Chamoin 2013] Chamoin, J.; Optimisation des propriétés (physiques, hydriques et mécaniques) de bétons de chanvre par la maîtrise de la formulation [In French], PhD thesis, Université Européenne de Bretagne - Institut National des Sciences Appliquées de Rennes, 2013
[Collet 2004] Collet, F.; Caractérisation hydrique et thermique de matériaux de génie civil à faibles impacts environnementaux [In French], PhD thesis, INSA Rennes, France, 2004.
[Collet 2012] Collet, F.; Pretot, S.; Experimental investigation of moisture buffering capacity of sprayed hemp concrete, Construction and Building Materials 2012, n°36, p58-65.
[Collet 2013] Collet, F.; Chamoin, J.; Pretot, S.; Lanos, C.; Comparison of the hygric behaviour of three hemp concretes, Energy and Buildings, 2013; n°62, p294-303.
[Collet 2014] Collet, F.; Pretot, S.; Thermal conductivity of hemp concretes: variation with formulation, density and water content, Construction and Building Materials 2014, n°65, p612-619.
[Evrad 2008] Evrard, A.; Transient hygrothermal behaviour of lime-hemp materials, PhD thesis, Université Catholique de Louvain, Belgium, 2008 [Hagentoft 2004] Hagentoft, C.E.; Kalagasidis, A.S.; Adl-Zarrabi, B.; Roels, S.; Carmeliet, J.; Hens, H.; Grunewald, J.; Kunk, M.; Becker, R.; Shamir, D.; Adan, O.; Brocken, H.; Kumaran, K.; Djebbar, R.; Assessment method for numerical prediction models for combined heat, air and moisture transfer in building components: benchmarks for one-dimensional cases,
Journal of Thermal Envelope and Building Science, 2004, n°27(4), p327-52.
[Huang 2005] Huang, H.C.; Tan, Y.C.; Liu, C.W.; Chen, C.H.; A novel hysteresis model in unsaturated soil, Hydrological Processes, 2005, n°19(8), p1653– 65.
[Incropera 2007] Incropera, F.P.; Dewitt, D.P.; Bergman, T.L.; Lavine, A.S.; Fundamentals of Heat and Mass Transfer, 7th edition, 2007
[Künzel 1995] Künzel, H.M.; Simultaneous Heat and Moisture Transport in Building Components, PhD thesis, Fraunhofer IRB Verlag, Stuttgart, 1995.
[Lewis 1922] Lewis, W.K.; The evaporation of liquid into a gas. Transactions of American Society of Mechanical Engineers, 1922; n°1849, p325–340 [Mualem 1974] Mualem, Y.; A conceptual model of hysteresis, Water Resources Research, 1974, n°10(3), p514-20.
[Mualem 1984] Mualem, Y.; A modified dependent-domain theory of hysteresis, Soil Sciences, 1984, n°137, p283-91.
[Mualem 2009] Mualem, Y.; General scaling rules of the hysteretic water retention function based on Mualem’s domain theory, European Journal of Soil Sciences, 2009, n°60, p652-61.
[Pedersen 1990] Pedersen, C.R.; Transient calculation on moisture migration using a simplified description of hysteresis in sorption isotherms, Proceedings of 2nd Nordic Symposium on Building Physics, 1990, Trondheim, Norway.
[Pretot 2012] Pretot, S.; Collet, F.; Experimental study of hygrothermal behavior of a hemp concrete wall (without and with coating), 2nd International conference on building energy and environment, Boulder, United States, 2012.
[Pretot 2014] Pretot, S.; Collet, F.; Garnier, C.; Life cycle assessment of a hemp concrete wall: Impact of thickness and coating, Building and Environment, 2014, n°72, p223-31.
[Rode 2005] Rode, C.; Moisture buffering of building materials. Report BYG DTU R-126, 2005, ISSN 1601– 2917, ISBN 87-7877-195
[Samri 2008] Samri, D.; Analyse physique et caractérisation hygrothermique des matériaux de construction: approche expérimentale et modélisation numérique [In French]. PhD thesis, Institut National des Sciences Appliquées de Lyon, 2008.
[Scott 1983] Scott, P.S.; Farquhar, G.J.; Kouwen, N.; Hysteretic effects on net infiltration, Advanced Infiltration, 1983, n°83(11), p163–70
[Van Genuchten 1980] Van Genuchten, M.Th.; A closed-form equation for predicting the hydraulic conductivity of unsaturated soils, Soil Science Society American Journal, 1980, n°44, p892–98.