Disparate quasiballistic heat conduction regimes
from periodic heat sources on a substrate
The MIT Faculty has made this article openly available. Please share how this access benefits you. Your story matters.Citation Zeng, Lingping, and Gang Chen. "Disparate quasiballistic heat
conduction regimes from periodic heat sources on a substrate." J. Appl. Phys. 116, 064307 (2014).
As Published http://dx.doi.org/10.1063/1.4893299
Publisher American Institute of Physics (AIP)
Version Author's final manuscript
Citable link http://hdl.handle.net/1721.1/88704
Terms of Use Creative Commons Attribution-Noncommercial-Share Alike
Disparate Quasiballistic Heat Conduction Regimes
from Periodic Heat Sources on a Substrate
Lingping Zeng1 and Gang Chen1,a)
1Department of Mechanical Engineering, Massachusetts Institute of Technology,
Cambridge, Massachusetts 02139, United States
ABSTRACT:
We report disparate quasiballistic heat conduction trends for periodic nanoscale line heaters deposited on a substrate, depending upon whether measurements are based on the peak temperature of the heaters or the temperature difference between the peak and the valley of two neighboring heaters. The degree of quasiballistic transport is characterized by the effective thermal conductivities of the substrate which are obtained by matching the diffusion solutions to the phonon Boltzmann transport equation (BTE) results. We find that while the ballistic heat conduction effect based on the peak temperature diminishes as the two heaters become closer, it becomes stronger based on the peak-valley temperature difference. Our results also show that the collective behavior of closely spaced heaters can counteract the nonlocal effects caused by an isolated nanoscale hot spot. These results are relevant to thermal conductivity spectroscopy techniques under
development and also have important implications for understanding nonlocal heat conduction in integrated circuits and carbon nanotube array thermal interface materials.
I. INTRODUCTIONS
The theory of heat conduction by diffusion is inadequate in describing thermal transport in the quasiballistic regime, which occurs when the characteristic lengthscales of the device approach the heat carrier mean free paths (MFPs).1 For example, the conduction heat flux surrounding an isolated hot nanoparticle whose dimension is comparable with or smaller than the phonon MFP of the host medium has been predicted to be significantly suppressed compared with the solution of Fourier‟s diffusion theory.2 This heat flux suppression due to classical size effects has impacts on micro-/nanoelectronics in which substantial amount of heat is generated within a small region and eventually conducted out through the underlying substrates.3,4 The contribution of nonlocal thermal transport to the total thermal resistance in a silicon-on-insulator device was predicted to be significant.3 In the presence of a
sufficiently small heat source relative to the phonon MFP, the peak temperature rise in a two-dimensional microelectronic device was found to be substantially underestimated by Fourier‟s law.4
Recently, experimental investigations of quasiballistic thermal transport have been utilized in thermal conductivity spectroscopy techniques to quantify the phonon MFP distributions in various materials of interests.5–10 In particular, Minnich et al.7 developed
a pump-and-probe time-domain thermoreflectance (TDTR) thermal conductivity spectroscopy technique to study phonon MFP distribution through measuring the effective thermal conductivities of silicon with different laser spot diameters. Extending the developed thermal conductivity spectroscopy technique to the nanoscale nevertheless requires periodic nanoscale heat sources10 since optical diffraction limits the smallest laser spot size to be around 1 µm for visible light beams. The modified measurement technique allows materials with short phonon MFPs to be studied.10 Siemens et al.6 employed a nanometer sized metallic grating array as the heat absorbers and a soft X-ray as the probe to measure the decay of the diffracted beam due to transient heating of the metallic heat absorbers. They observed significant ballistic heat conduction effect as reflected in an increase of the effective thermal boundary resistance between the metallic heat absorbers and the substrate. In a subsequent work performed with a transient thermal grating (TTG) setup, Johnson et al.8 employed the interference of two pump laser beams to generate a transient grating signal in a silicon membrane and another probe laser to measure the decay of this transient grating signal. Their measurements showed that the effective thermal conductivity of the membrane depends strongly on the grating spacing. All these works attributed the reduction in the effective thermal conductivities to ballistic phonon transport when the phonon MFPs is long compared to the relevant thermal length scales.5–10 It is interesting to note that transient grating experiments measure the temperature difference between the peak and the valley of the grating period,
method measures the temperature of the metallic heat absorbers10. For array types of heat
sources, either by metallic gratings or by crossing two laser beams, the effects of the interaction between neighboring heat sources on different thermal conductivity spectroscopy techniques are not clear, though.
In fact, many structures used in micro-/nanoelectronics are also arranged periodically. For example, integrated circuits often consist of periodic nanoscale MOSFET array deposited on top of a substrate. Generated heat is released on the drain side and conducted away through the substrate. Although previous studies have investigated quasiballistic thermal transport in isolated nanostructures to mimic heat generation in individual MOSFET,3,4 the impact of interplay between periodic nanoscale hot spots on the heat transport when their spacing becomes smaller than the MFPs of heat carriers is still an open question. Another similar scenario is nanowire or nanotube arrays used as thermal interface materials.11–17 Although heat spreading from an isolated nanotube to a substrate is highly ballistic,18–20 it is not clear whether the same effect exists for arrays of nanowires and nanotubes as used for real thermal interface materials.
In this work, we numerically study the impact of heater dimension and heaters‟ spacing on the thermal transport regime in the underlying substrate based on solving the phonon BTE under transient heating conditions. We compute the peak temperature rise of the heaters which corresponds to the measured signal in the TDTR experiment7,21 and is also of interests for microelectronics and nanowire/nanotube based thermal interface materials. The surface temperature difference between the peak and the valley of such periodic
structures, corresponding to measurements in the TTG experiments,8,22 is also calculated.
Using these two temperatures as „measured‟ signals, the effective thermal conductivities
keff of the substrate that encode the degree of ballistic thermal transport are fit by
matching the solution of the heat equation with that of the phonon BTE across a wide range of lengthscales.23 We find that both the heater size and the spacing between neighboring heaters have strong impact on the transport regime. Our results also show that the degree of ballistic thermal transport depends on what is measured: for the peak temperature rise, the ballistic effect diminishes as the heaters get closer, while for the peak-valley temperature difference, ballistic effect increases.
II. SIMULATION DETAILS
In the quasiballistic regime, many phonons have MFPs longer than the characteristic thermal lengthscales and do not scatter in the local heated region. Analyzing heat transfer in this regime requires solving the phonon BTE. In general, the phonon BTE is difficult to solve since the phonon distribution function is a scalar in the six dimensional phase space.1 In this study, we investigate the heat transport regime in the underlying substrate
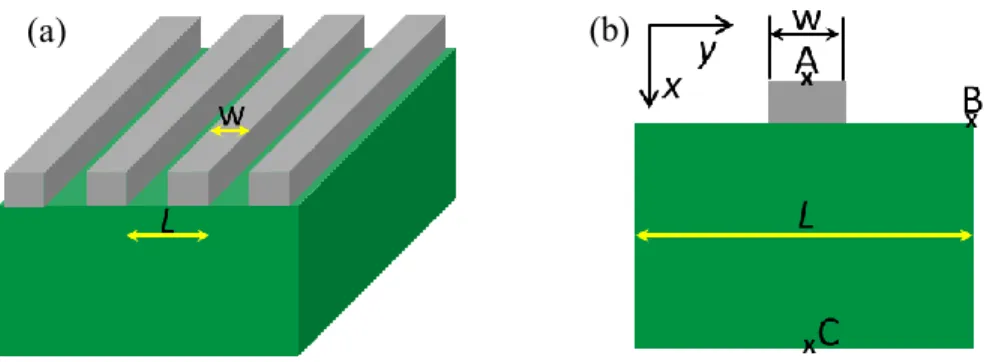
with periodic nanoscale line heaters on top under transient heating conditions. The simulation domain is sketched in Fig. 1(a). To make the computations tractable, the heater and substrate are modeled as materials with phonons being the heat carriers. The material properties, listed in Table 1, are chosen based on sensitivity consideration and assumed to be temperature independent. In addition, to compensate for the computational
cost associated with solving the frequency dependent BTE, the developed transport model is based upon a gray two-dimensional phonon BTE, meaning that all the phonons in the heater and the substrate assume the same respective transport properties. Although existing studies all show that phonon MFP spans a wide range,9,24,25 the constant MFP assumption helps to understand the physics and simulation results are useful for reconstructing phonon MFP distributions from experimental data through thermal conductivity suppression function26,27.
Figure 1. (a) Schematic of the simulation domain; (b) representative of one period.
Table 1. Material properties of the heater and substrate.
Material Bulk k (W/mK) Cv (J/m3K) V (m/s) (nm)
Heater 100 2.35E6 3000 42
Substrate 50 1.0E6 1500 100
The transient phonon BTE under the relaxation time approximation1 is given by:
0 Ι I I V I t
(1) (a) (b)where ( ) = 1
4 0
p m,p ω,p ω,p
I x, y, , , t f D V dω is the local directional phonon
intensity along the propagation direction (
, ) (
: polar angle, : azimuthal angle, assketched in Fig. 2(a)), V is the phonon group velocity, is the gray phonon lifetime,
and I0(x, y, t) is the equivalent equilibrium phonon intensity used to resolve the spatial
and temporal temperature distribution.23,28 In the definition of the phonon intensity I,
is the phonon quanta energy, f is the spectral phonon occupation function, Dω,p is the spectral density of phonon states for polarization p, Vω,p is the spectral group velocity, and ωω,p is the maximum vibration frequency for polarization p. The difficulty of solving Eq. (1) originates from obtaining I0, which averages the directional phononintensity over the entire solid angle.2,23,28 The numerical technique has been thoroughly described elsewhere4 and is briefed here.
In this work, the discrete ordinate method is used to solve the phonon BTE together with a two-dimensional Gauss-Quadrature to integrate properties over the 4 solid angle.29 An explicit first-order finite differencing method is implemented to perform both
temporal and spatial derivatives in the phonon BTE. The initial temperature distributions inside the heaters and the substrate are assumed to be uniform, respectively, but differ by 1K. That temperature difference, small enough to justify the use of constant material properties, drives a heat current between them. The discretized BTE form depends upon the phonon propagation direction,4 as shown by the differencing schemes in Fig. 2(b),
backward differencing is taken when phonons travel along the positive direction, and vice versa. For example, the discretized BTE for the quadrant μ < 0, η > 0 is given by:
k+1 k k k k k k k i, j, n, m i, j, n, m i+1, j, n, m i, j, n, m i, j, n, m i, j-1, n, m i, j, n, m i, j, 0 I I VμI I VηI I I I Δt Δx Δy (2)where i, j, n, m, and k are the x, y, μ, η, and time indices, respectively, k i, j, n, m
I is the
phonon intensity at a specific point (i, j, n, m) in the phase space and time k, and k i, j, 0
I is
the equivalent equilibrium intensity at time k. Similarly, the discretized transport equation for other propagation directions can be written down. This explicit scheme is used to propagate in time until the expected simulation time is reached.
Figure 2. (a) Local phonon propagation direction, adapted from Ref. 4; (b) discretization schemes for different phonon propagation directions.
A two-dimensional Gaussian-Quadrature is implemented in the simulation to discretize the directional angles μ and .4 In particular, we discretize the directional cosine μ from -1 to 1 into Nμ40 points and the azimuthal angle from 0 to (not 0 ~ 2π due to symmetry) into Nφ30 points. The corresponding weights ωn and
* m ω for each propagation direction (μ, η) is computed through a numerical program and satisfy
2 φ * n = 1 m = 1 n m N N π
ω ω
. To guarantee stability and accuracy, the spatial and time steps must be sufficiently small and satisfy:min
Δx Δt <
V (3)
where Δxmin is the minimum spatial step size and V is the phonon group velocity. In this
study, the spatial step size is chosen to be equal to or less than one twentieth of the smaller phonon MFP of the heater and the substrate, therefore ensuring stability and convergence.
Once initialized, the rate of heat rejection depends strongly upon the interfacial thermal properties, i.e. phonon transmittance and reflectance at the heater-substrate interface.30–33 In this study, phonon scattering at the metal-substrate interface is assumed to be completely diffuse, which implies that phonons leaving the interface on either side of the interface bear an isotropic distribution. Energy conservation requires the transmittance and reflectance to obey the following relation:
1
R T (4)
where R and T are the reflectance and transmittance on either side of the interface. At thermal equilibrium, the net heat flux across an interface is exactly zero, as required by the principle of detailed balance1 which relates the transmittances on either side of an interface to one another by:
V1 1 21 12 V2 2 C V T T C V (5)
where T12 is the transmittance from medium 1 to medium 2, T21 is the transmittance from
medium 2 to medium 1, and Cvi and Vi (i=1, 2) are the volumetric specific heat capacities
and speeds of sound, respectively. To obtain the transmittances, we first specify the transmittance T12 (T12 = 0.1). Then T21 can be straightforwardly determined through Eq.
(5). When solving the diffusion heat transfer model, an interfacial thermal conductance
Gdiff is needed as the input and is determined from the phonon transmittances by:1,34
12 v1 1 12 21 diff 4(1 0.5( )) T C V G T T (6)
No size dependence of the interfacial thermal conductance is assumed, consistent with recent experiments.7 Simulation results to be presented later will also validate this assumption.
The periodicity of the computed structure allows us to simulate one period of the structure, as shown in Fig. 1(b). The thicknesses of the heater array and the substrate are 80 nm and 3 μm respectively. In reality, the substrate is a semi-infinite system with its backside being adiabatic. In practice, by checking the substrate backside temperature rise, we find that 3 μm is sufficiently thick to approximate the substrate as a semi-infinite body. We also find that doubling the substrate thickness to 6 μm causes almost no difference in the peak temperature rise and peak-valley temperature difference. The left and right boundaries of the substrate in Fig. 1(b) are periodic boundaries.35 We implement the
periodic boundary condition as a specular reflection. All other free boundaries (including the free surfaces of the heater and the gaps between neighboring heaters) are modeled as being adiabatic. The effects of these free boundaries‟ specularity (fraction of phonons being specularly reflected) are checked by comparing the BTE results under totally specular and totally diffuse boundary conditions. Our simulation results show almost no specularity dependence from such comparison, thus we also model these free surfaces as specularly adiabatic walls.
The equivalent equilibrium phonon intensity,4,34 corresponding to a locally thermalized state, is computed by weighting all the directional intensities through:
1 ( ) = ( ) 2π k k 0 * φ n = 1 m = 1 n m N N x, y, t x, y, , , t I I
ω ω
(7) where k(
) x, y, , , tI is the directional phonon intensity at (x, y) along the direction
(
, ) at time . Instead of calculating the local thermodynamic equilibrium temperaturewhich does not exist in highly non-equilibrium transport, we compute the equivalent equilibrium temperature4,34 which is a measure of the local energy density and defined as:
4π
( ) = k( )
0 CV
T x, y, t I x, y, t (8)
The local heat flux along a specific direction consists of contributions from all the directional phonon intensities at the point being studied. For example, if we define the cross-plane direction as x, the local heat flux along this direction is given by:
1 ( ) = ( ) 2π * φ k n = 1 m = 1 n n m x N N μ x, y, t x, y, , , t ω ω q I (9)
where
n is the directional cosine. Similarly, the heat flux along the in-plane direction can be written down as:2 ( ) 1 ( ) = ( ) 1 cos 2π * φ k n = 1 m = 1 n m n m y N N φ x, y, t x, y, , , t ω ω q I (10)
The effects of heater dimension and spacing between neighboring heaters on the transport regime in the substrate of the proposed structure are studied under the framework of the developed thermal model. Heat transport occurs from the heaters to the underlying substrate after imposing an initial temperature difference between them. The presence of periodically arranged hot and cold spots in the computed structure generates thermal grating effects.8 To gain insight into the heat conduction, we examine both the peak temperature rise (i.e. the temperature difference between points A and C,
AC
T , as indicated in Fig. 1(b)) and the temperature difference between the grating peak
and valley (i.e. the temperature difference between points A and B, TAB, as indicated in
Fig. 1(b)). The temporal decays of the peak temperature rise and the peak-valley grating temperature difference from the diffusion heat equation are matched with the corresponding results from the phonon BTE by minimizing the norm between these two model curves to find the effective thermal conductivities that are then used to analyze the heat transfer regime.
III. RESULTS AND DISCUSSION
Two important length scales affecting the heat transfer are the heater width w and the period L (heater spacing = L – w) of the heater array. The simulations are carried out by varying the heater width w under different filling fractions (FF) defined as the ratio of the heater width to the heater array period w/L. This means that we systematically tune the heater width w while maintaining the filling fraction w/L at constant values to examine the effects of these two parameters on the thermal transport. Hereafter, without explicit explanation, we refer the phonon MFP or to the substrate phonon mean free path.
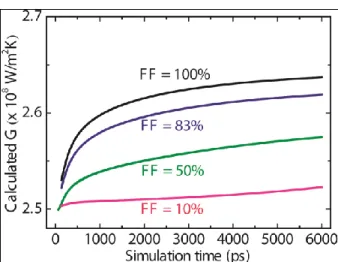
As discussed before, we assumed that the interfacial thermal conductance has negligible size dependence. This assumption is validated from our simulation results, as shown in Fig. 3 which plots the calculated temporal interfacial thermal conductance G (based on the temporal interfacial heat flux and temperature difference across the interface) from the phonon BTE at different filling fractions when the heater width is 100 nm. Clearly, G increases with increasing filling fraction at a fixed heater width. However, the overall variation of G is within 6% and thus can be neglected. The computed interfacial thermal conductances for other geometries, including small and large heater widths relative to the phonon MFP, fall in the same range (2.50 ~ 2.64 x 10⁸ W/m2K). In addition, we note that the magnitude of the calculated G is very close to the value Gdiff
predicted by Eq. (6): 2.465 x 10⁸ W/m2K. Consequently, we implement a constant interfacial thermal conductance computed from Eq. (6) when solving the diffusion heat
Figure 3. Calculated interfacial thermal conductance as a function of time at different filling fractions when w = 100 nm.
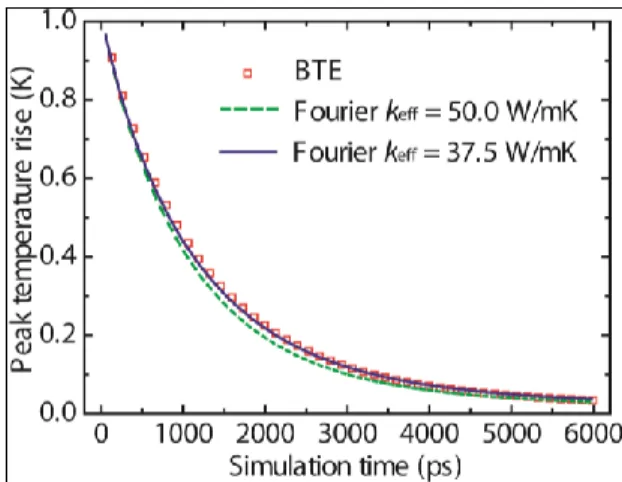
Figure 4 shows the decay of the peak temperature rise when the heater width is 100 nm (same as the substrate phonon MFP ) at a 10% filling fraction. The decay rate from the phonon BTE represented by the red squares is slower than that of Fourier‟s law represented by the green dashed curve obtained by using the bulk thermal conductivity of the substrate. The discrepancy between the diffusion result and the BTE data indicates the presence of ballistic transport in the substrate.23 Our best fitting result returns an effective thermal conductivity keff ≈ 37.5 W/mK represented by the blue solid curve. This reduced
substrate thermal conductivity implies that there is an additional ballistic resistance associated with transport in the substrate.6,10
Figure 4. Demonstration of classical size effects by fitting the peak temperature rise. The results correspond to a heater width of 100 nm at a 10% filling fraction.
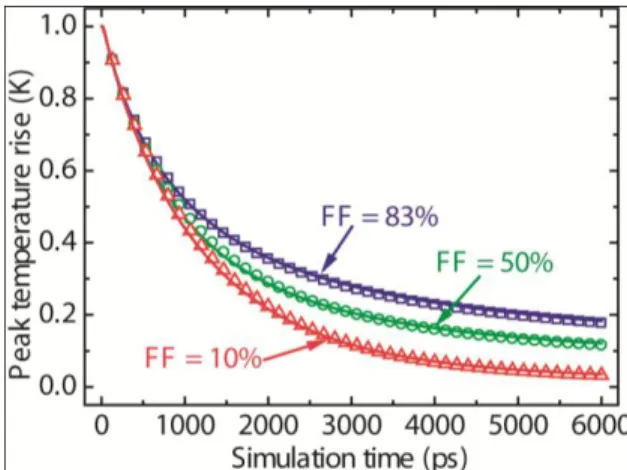
The effect of varying filling fractions is shown in Fig. 5 where the heater width is kept constant at 100 nm under three different filling fractions. The dots represent the data from the phonon BTE and the solid curves represent the best fittings from the diffusion heat equation. As the filling fraction increases from 10% to 83%, keff increases by
approximately 20% from 37.5 W/mK to 47.0 W/mK, which indicates that the filling fraction, apart from the heater size, also significantly affects the thermal transport in the substrate. In the limit of zero spacing between heaters (100% filling fraction), the structure is effectively a continuous film covering the substrate and our fitting returns the bulk thermal conductivity, consistent with prior measurements.7 Intuitively, for two structures with the same heater size, the structure with a larger filling fraction (smaller spacing) more closely approaches to the „film case‟ and therefore has a higher keff. One
ballistic heat sources with identical heat generation actually leads to the familiar diffusive transport picture. This observation has many implications for thermal management of micro-/nanoelectronics and thermal interface materials. In microelectronics, heat may also be generated in a region of the MOSFET much smaller than the MFP of the substrate that spreads out the heat. Our calculation results suggest that the collective behavior caused by closely packed MOSFETs will counteract the ballistic effects present in an isolated nanoscale hot spot3,4 and thus the thermal management in micro- and nanoelectronics may not be as serious as inferred from isolated device simulations. Similarly, the predicted ballistic contact effect of an isolated point contact such as between a carbon nanotube and the underlying substrate may diminish in closely arranged carbon nanotube arrays used in thermal interface materials.20
Figure 5. Effects of varying filling fractions w/L on keff by fitting the peak temperature
rise. Open dots (squares, circles, and triangles) represent BTE results and solid lines represent the best fittings from Fourier‟s diffusion theory when the heater width is 100 nm. The corresponding effective thermal conductivities are 47.0 W/mK, 43.5 W/mK, and
37.5 W/mK for 83%, 50%, and 10% filling fractions, respectively, clearly showing the impact of filling fraction on the heat transport in the underlying substrate.
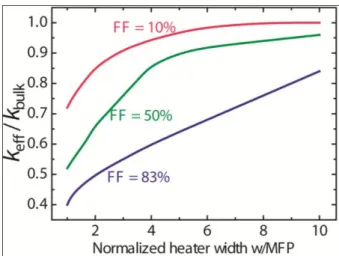
Figure 6 further shows the normalized effective substrate thermal conductivities as a function of the normalized heater width w at three different filling fractions. When
the heater width w is appreciably larger than the phonon MFP (w ≈ 10), phonons
experience sufficient scattering and thus diffusive transport occurs in the substrate.1,10 In this scenario, the fitting returns the bulk thermal conductivity regardless of the filling fraction, as verified by Fig. 6. As the heater width is gradually reduced to a level comparable to the phonon MFP, some phonons travel ballistically and do not relax.10,36 Those ballistic phonons result in an additional ballistic thermal resistance which suppresses the rate of heat rejection through the conduction in the substrate, leading to a lower effective thermal conductivity. However, the degree of ballistic transport in the substrate under those three different filling fractions differs significantly as the heater width becomes comparable or small than the phonon MFP, as indicated by the substantially distinct effective thermal conductivities. For the very large filling fraction, represented by the blue curve, the transport is more diffusive compared with the transport at those two smaller filling fractions, which again implies that the collective behavior due to the interaction between closely spaced nanoscale heat sources significantly counteracts the nonlocal effects that occurs in the case of an isolated nanoscale heat source. We also note that heat generation in current MOSFETs is typically confined to be around a tiny
small region (much smaller than the gate length) near the drain side, thus the predicted impact of collective behavior may not reduce the non-local effects substantially due to the small filling fraction. However, as the gate length continues to shrink, we expect such collective behavior to have significant influence in reducing the degree of non-local transport.
As mentioned before, periodically arranged nanoscale heat sources are required in the TDTR technique to probe short phonon MFP materials.10 Typically, a set of effective thermal conductivities is measured with respect to some characteristic thermal lengthscales, i.e. heater sizes. Phonon MFPs are subsequently estimated by assuming the heat transfer suppression of phonons with MFPs longer than the heater dimension.7,10 Our simulation results indicate that accurate interpretation of the measured effective thermal conductivities and phonon MFP reconstruction must take into account the impact of both the heater size and the spacing between neighboring heaters.
Figure 6. Normalized effective thermal conductivities vs. normalized heater width at three different filling fractions by fitting the peak temperature rise.
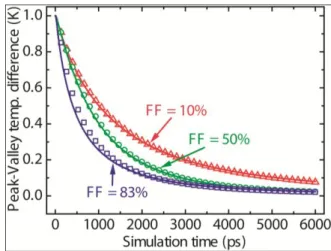
Interestingly, the effective thermal conductivities obtained via fitting the peak-valley temperature difference are found to be inversely correlated to the filling fraction as opposed to fitting the peak temperature rise. Figure 7 shows the peak-valley temperature difference solutions from the phonon BTE together with the best fittings from the Fourier‟s diffusion theory for 400nm-sized heaters at three different filling fractions. Quasiballistic transport occurs for all three of these structures as can be seen from the obtained effective thermal conductivities. However, the structure with the largest filling fraction has the lowest thermal conductivity compared with other two cases. Physically this originates from the fact that the peak-valley temperature difference always measures the thermal transport between the two heaters as the valley is the lowest temperature point on the substrate surface.8 The spacing between adjacent heaters becomes the
characteristic thermal length while fitting the peak-valley temperature difference. At a fixed heater width, the structure with a larger filling fraction has a smaller spacing between adjacent heaters, consequently giving a lower effective thermal conductivity. The contradicting trends in the effective thermal conductivities obtained using the peak temperature rise of the heater and the temperature difference between the peak and the valley in a grating structure imply that a single effective thermal conductivity cannot perfectly match the results from the phonon BTE and the diffusion theory in the whole
simulation domain.37 Equivalently, the peak temperature rise and peak-valley temperature
difference are associated with two different thermal lengths for the same structure and care must be taken when comparing the thermal conductivities measured by these two signals.
Figure 7. Effects of varying filling fractions on keff by fitting the peak-valley grating
temperature difference. The data correspond to a heater width of 400 nm at three different filling fractions. Open dots (triangles, circles, and squares) are the BTE results and solid lines are the best fitting based on Fourier‟s law. The corresponding effective thermal conductivities for 10%, 50%, and 83% filling fractions are 47.2 W/mK, 43.0 W/mK, 30.0 W/mK, respectively, showing an opposite trend in the effective thermal conductivity while varying the filling fraction at the same heater width.
The thermal conductivities measured by the peak-valley temperature difference as a function of the normalized heater width is shown in Fig. 8. It is worth noting that for a large filling fraction, the keff is significantly lower than the bulk value even at a very large
heater size ( w = 10). This occurs because the spacing between heaters is still
comparable to the phonon MFP despite of the large heater size.
Figure 8. Normalized effective thermal conductivities vs. normalized heater width at three different filling fractions by fitting the peak-valley grating temperature difference.
Note that a single spectrum-averaged phonon MFP is used in this study to make the calculations tractable. In reality, phonon MFP in many materials varies by several orders of magnitude.9,24 Consequently, when the heater width or spacing between neighboring
heaters falls within the range of the phonon MFP spectrum, long-MFP phonons travel ballistically and short-MFP phonons propagate diffusely, resulting in a much more complicated transport picture. Incorporating real phonon dispersion and frequency dependent MFPs makes a deterministic approach (for example, discrete ordinate method) to solving the phonon BTE expensive. More sophisticated technique, such as Monte Carlo method,38,39 needs using to assess the effect of nonlinear phonon spectrum. Future work will focus on the implementation of newly developed variance-reduced Monte
Carlo method to evaluate the impact of phonon dispersion on the thermal transport characteristics in the presence of periodical nanoscale heat sources.
IV. CONCLUSION
We have studied the impact of heater sizes and spacings on the thermal transport regime in a substrate covered by periodic heat sources when either the heater width or the spacing becomes comparable to the phonon MFP. When the peak temperature rise and the peak-valley temperature difference are used as separate measures of the transport regime in the substrate, they give opposite trends in the substrate effective thermal conductivity as a function of the spacing between heaters. When only the heater temperature is of concern, we identified that the close spacing between neighboring heaters can counteract the ballistic transport effects which occur in the presence of an isolated nanoscale hot spot, consistent with the fact that in the limit that the heaters become a continuous film, both experimental and simulation results approach that of diffusive transport. On the other hand, if the peak-valley temperature difference on the surface is measured, ballistic effect becomes stronger as the spacing between heaters becomes smaller. These results are important for understanding experimental results in phonon MFP spectroscopy using TDTR method and transient thermal grating method, and for understanding the impact of scaling on the thermal management of micro- and nanoelectronics, and thermal interface materials.
The authors would like to thank Professor Nicolas Hadjiconstantinou, Professor Austin Minnich, Dr. Amy Marconnet, Dr. John Cuffe, Maria Luckyanova, and Kimberlee Collins for helpful discussions. This material is based upon work supported as part of the “Solid State Solar-Thermal Energy Conversion Center (S3TEC)”, an Energy Frontier Research Center funded by the U.S. Department of Energy, Office of Science, Office of Basic Energy Sciences under Award Number: DE-SC0001299/DE-FG02-09ER46577.
REFERENCES
1 G. Chen, Nanoscale Energy Transport and Conversion (Oxford University Press, New
York, 2005).
2 G. Chen, J. Heat Transfer 118, 539 (1996).
3 S. Sinha and K.E. Goodson, Microelectronics J. 37, 1148 (2006).
4 R. Yang, G. Chen, M. Laroche, and Y. Taur, J. Heat Transfer 127, 298 (2005). 5 Y. Koh and D. Cahill, Phys. Rev. B 76, 075207 (2007).
6 M.E. Siemens, Q. Li, R. Yang, K.A. Nelson, E.H. Anderson, M.M. Murnane, and H.C.
Kapteyn, Nat. Mater. 9, 26 (2010).
7 A.J. Minnich, J.A. Johnson, A.J. Schmidt, K. Esfarjani, M.S. Dresselhaus, K.A. Nelson,
and G. Chen, Phys. Rev. Lett. 107, 095901 (2011).
8 J.A. Johnson, A.A. Maznev, J. Cuffe, J.K. Eliason, A.J. Minnich, T. Kehoe, C.M.S.
Torres, G. Chen, and K.A. Nelson, Phys. Rev. Lett. 110, 025901 (2013).
9 K.T. Regner, D.P. Sellan, Z. Su, C.H. Amon, A.J.H. McGaughey, and J.A. Malen, Nat.
Commun. 4, 1640 (2013).
11 P. Kim, L. Shi, A. Majumdar, and P.L. McEuen, Phys. B Condens. Matter 323, 67
(2002).
12 L. Shi, D. Li, C. Yu, W. Jang, D. Kim, Z. Yao, P. Kim, and A. Majumdar, J. Heat
Transfer 125, 881 (2003).
13 J. Xu and T.S. Fisher, Int. J. Heat Mass Transf. 49, 1658 (2006).
14 J. Xu and T.S. Fisher, IEEE Trans. Components Packag. Technol. 29, 261 (2006). 15 X.J. Hu, A.A. Padilla, J. Xu, T.S. Fisher, and K.E. Goodson, J. Heat Transfer 128,
1109 (2006).
16 X.J. Hu, M.A. Panzer, and K.E. Goodson, J. Heat Transfer 129, 91 (2007).
17 M. Bozlar, D. He, J. Bai, Y. Chalopin, N. Mingo, and S. Volz, Adv. Mater. 22, 1654
(2010).
18 P. Kim, L. Shi, A. Majumdar, and P. McEuen, Phys. Rev. Lett. 87, 215502 (2001). 19 C. Yu, L. Shi, Z. Yao, D. Li, and A. Majumdar, Nano Lett. 5, 1842 (2005).
20 Y. Chalopin, J.-N. Gillet, and S. Volz, Phys. Rev. B 77, 233309 (2008). 21 A.J. Schmidt, X. Chen, and G. Chen, Rev. Sci. Instrum. 79, 114902 (2008).
22 J.A. Rogers, A.A. Maznev, M.J. Banet, and K.A. Nelson, Annu. Rev. Mater. Sci. 30,
117 (2000).
23 A.J. Minnich, G. Chen, S. Mansoor, and B.S. Yilbas, Phys. Rev. B 84, 235207 (2011). 24 Z. Tian, S. Lee, and G. Chen, J. Heat Transfer 135, 061605 (2013).
25 T. Luo and G. Chen, Phys. Chem. Chem. Phys. 15, 3389 (2013). 26 A.J. Minnich, Phys. Rev. Lett. 109, 205901 (2012).
27 K.C. Collins, A.A. Maznev, Z. Tian, K. Esfarjani, K.A. Nelson, and G. Chen, J. Appl.
Phys. 114, 104302 (2013).
28 A. Majumdar, J. Heat Transfer 115, 7 (1993).
30 L.J. Challis, J. Phys. C Solid State Phys. 7, 481 (1974).
31 E.T. Swartz and R.O. Pohl, Appl. Phys. Lett. 51, 2200 (1987).
32 P. Reddy, K. Castelino, and A. Majumdar, Appl. Phys. Lett. 87, 211908 (2005). 33 E. Swartz and R. Pohl, Rev. Mod. Phys. 61, 605 (1989).
34 G. Chen and T. Zeng, Microscale Thermophys. Eng. 5, 71 (2001). 35 Q. Hao, G. Chen, and M.-S. Jeng, J. Appl. Phys. 106, 114321 (2009). 36 G. Chen, Phys. Rev. Lett. 86, 2297 (2001).
37 R.B. Wilson, J.P. Feser, G.T. Hohensee, and D.G. Cahill, Phys. Rev. B 88, 144305
(2013).
38 - ra d o arian e ethods for Monte Carlo Simulation of Phonon
Transport, Massachusetts Institute of Technology, 2011.