HAL Id: hal-01575637
https://hal.archives-ouvertes.fr/hal-01575637
Submitted on 23 Aug 2017
HAL is a multi-disciplinary open access
archive for the deposit and dissemination of
sci-entific research documents, whether they are
pub-lished or not. The documents may come from
teaching and research institutions in France or
abroad, or from public or private research centers.
L’archive ouverte pluridisciplinaire HAL, est
destinée au dépôt et à la diffusion de documents
scientifiques de niveau recherche, publiés ou non,
émanant des établissements d’enseignement et de
recherche français ou étrangers, des laboratoires
publics ou privés.
Microreactors to Measure Solubilities in the CO 2 -H 2
O-NaCl System
Marie-Camille Caumon, Jean Dubessy, Pascal Robert, Boubaker Benaissa
To cite this version:
Marie-Camille Caumon, Jean Dubessy, Pascal Robert, Boubaker Benaissa. Microreactors to
Mea-sure Solubilities in the CO 2 -H 2 O-NaCl System.
13th International Conference on
Green-house Gas Control Technologies, GHGT-13, Nov 2017, Lausanne, Switzerland.
pp.4843-4850,
�10.1016/j.egypro.2017.03.1624�. �hal-01575637�
1876-6102 © 2017 The Authors. Published by Elsevier Ltd. This is an open access article under the CC BY-NC-ND license (http://creativecommons.org/licenses/by-nc-nd/4.0/).
Peer-review under responsibility of the organizing committee of GHGT-13. doi: 10.1016/j.egypro.2017.03.1624
Energy Procedia 114 ( 2017 ) 4843 – 4850
ScienceDirect
13th International Conference on Greenhouse Gas Control Technologies, GHGT-13, 14-18
November 2016, Lausanne, Switzerland
Microreactors to measure solubilities in the CO2-H2O-NaCl system
Marie-Camille Caumon
a*,
Jean Dubessy
a, Pascal Robert
a, Boubaker Benaissa
aaUniversité de Lorraine, CNRS, CREGU, GeoRessources laboratory, BP 70239, F-54506 Vandœuvre-lès-Nancy, France
Abstract
The production of experimental data for CO2 solubilities in the H2O-CO2-NaCl is of first importance to constraint thermodynamic
modelling of CO2 geological storage. Here a mcirocapillaries device is coupled to a Raman microspectrometer to measure CO2
solubility as a function of pressure, temperature and NaCl concentration. The results show an excellent correlation with the equation of state of Duan and Sun [1] and with previous works [2].
© 2017 The Authors. Published by Elsevier Ltd.
Peer-review under responsibility of the organizing committee of GHGT-13.
Keywords: CO2 solubility; Raman spectroscopy, fused silica micro-reactor
1. Introduction
The knowledge of the solubility of CO2 in water and saline solutions is crucial to model the behavior of CO2 after
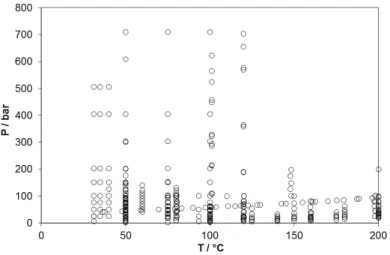
injection in an aquifer for CO2 storage purpose. Over the last decades, numerous experimental data have been acquired,
mostly at low pressure (< 200 bar, Fig. 1) and in pure water but data at higher pressure or in saline media are sparse. In the present study, a micro-reactor was used, coupled with a Raman microspectrometer to measure solubilities in the CO2-H2O-NaCl system. The optical device made possible to measure CO2/H2O concentrations without sampling, i.e.
without perturbation of the system after calibration. Moreover, the micro-reactor reduced equilibration times and heat and mass transfers contrary to classical batch reactor [3].
* Corresponding author. Tel.: +33 3 83 68 47 25; fax: +33 3 83 68 47 01.
E-mail address: marie-camille.caumon@univ-lorraine.fr
© 2017 The Authors. Published by Elsevier Ltd. This is an open access article under the CC BY-NC-ND license (http://creativecommons.org/licenses/by-nc-nd/4.0/).
4844 Marie-Camille Caumon et al. / Energy Procedia 114 ( 2017 ) 4843 – 4850
The objective of this study was to define the relevant parameters to be used to draw calibration curves correlating the dissolved CO2 concentration with the Raman signal of CO2 and H2O at any salinity and temperature. The Raman
signal of CO2 and water were acquired as a function of pressure, temperature and NaCl concentration. The ranges were
5-500 bar, 25-250 °C, and 0-4 M NaCl. The peak areas (A) and peak intensities (I) were measured for the HOH bending vibration (~1640 cm-1, noted b) and the OH stretching vibration (~3350 cm-1, noted s) of H
2O, and for the Fermi
doublet of CO2 (both peaks or only the Q+ peak at ~1380 cm-1). The following peak intensity and area ratios were
plotted as a function of CO2 solubility: ACO2/AH2Os, ACO2/AH2Ob, ACO2-1380/AH2Os, ACO2-1380/AH2Ob, ICO2-1380/IH2Os, and
ICO2-1380/IH2Ob. The CO2 solubility was calculated using the model of Duan and Sun [1] at the pressure and temperature
of each steps.
Fig. 1: literature review of the PT conditions of CO2 solubility data in H2O.
Nomenclature
ACO2 Area of the Q+ and Q- Raman peaks of CO2 (1380 and 1273 cm-1)
ACO2-1380 Area of the Q+ Raman peak of CO2.
AH2Ob Area of the bending vibration band of H2O (1640 cm-1)
AH2Os Area of the stretching vibration band of H2O (2800-3850 cm-1)
ICO2 Intensity of the Q+ Raman peak of CO2.
IH2Ob Intensity of the bending vibration band of H2O (1640 cm-1)
IH2Os Intensity of the stretching vibration band of H2O (2800-3800 cm-1)
QF (ICO2-1380/IH2Os)/sCO2
sCO2 solubility of CO2 (mol.kg-1H2O)
2. Material and methods
2.1. Experimental device and procedure
The experimental device is a High Pressure Optical Cell (HPOC) [4] which consists of a pressurization system connected to a fused silica capillary tube. The capillary tube is placed on a customized heating-cooling stage (CAP500, Linkam) (Fig. 2). Temperature and pressure measurements were calibrated before experiments. Temperature is
controlled to ± 0.1 °C. Pressure is controlled to ± 0.3 bar. Measurements are done at 25 °C in pure water and 1, 2, 3, and 4 M NaCl up to 500 bar, and at 25, 100, 200, and 250 °C in pure water, up to 500 bar. The solubility of CO2 is
calculated at each pressure-temperature-mNaCl step using the equation of state of Duan and Sun [1].
The fused silica tube is first filled with about 0.5 cm of water or of a NaCl solution. It is then glued to a stainless steel tube and connected to the pressurization device. The solution is frozen and all the system is evacuated under vacuum. A few bars of CO2 are loaded in the tube before unfreezing the solution. CO2 is added step by step up to 500
bar. The Raman spectra are acquired near the gas-solution interface once the Raman signal and pressure stabilize.
Fig. 2: the HPOC system after Caumon et al. [5]. HPP: high pressure pump; P: pressure transducer; V: valve; VP: vacuum pump; FSC: fused silica capsule.
2.2. Raman analysis
Raman spectra are recorded suing a LabRAM HR microspectrometer (Horiba Jobin Yvon) equipped with a 600 gr.mm-1 grating and an x20 objective (Olympus). The laser is an Ar+ laser (Stabilite 2017, Spectra-Physics) operating
at 514.53 nm and 200 mW. The acquisition time is generally of 10 to 30 s with 10 accumulations. Each measurement is repeated 10 times. Peak areas and intensities are measured using Labspec software (Horiba Jobin Yvon). A straight baseline is subtracted.
3. Results and discussion
3.1. Raman spectra of dissolved CO2 and liquid water
Some examples of the Raman spectra of CO2 and water are presented in Fig. 3. The Raman signal of dissolved CO2
consists of a doublet at 1273 cm-1 and 1380 cm-1 (Fig. 3a). The Raman signal of water is presented here as the bending
vibration band around 1640 cm-1 (Fig. 3a) and the stretching vibration band in the range 2800-3800 cm-1 (Fig. 3b).
The Raman signal of dissolved CO2 only changes in intensity with concentration. On the contrary, the shape of the
Raman vibration bands of water evolves with salinity (Fig. 3a and Fig. 3b), pressure, and temperature, especially the stretching vibration band around 3500 cm-1. This modification is due to changes in hydrogen bonding between H
2O
4846 Marie-Camille Caumon et al. / Energy Procedia 114 ( 2017 ) 4843 – 4850
a b
Fig. 3: Some Raman spectra of (a) dissolved CO2 and the bending vibration band of water and (b) the stretching vibration band of water, as a
function of NaCl concentration. P = 100 bar, T = 25 °C. Spectra are normalized to the area of the bending (a) or stretching (b) band of water and Y-shifted for clarity.
3.2. Effect of salinity
Raman spectra of dissolved CO2 and water were recorded at 25 °C at various salinity (0-4 M NaCl) and pressure
up to 500 bar. The effect of salinity is presented in Fig. 4. Six different ratios are calculated and plotted as a function of CO2 solubility (mol.kg-1H2O) and salinity (NaCl molality, mol.kg-1H2O): ACO2/AH2Ob (Fig. 4a), ACO2/AH2Os (Fig. 4b),
ACO2-1380/AH2Ob (Fig. 4c), ACO2-1380/AH2Os (Fig. 4d), ICO2/IH2Ob (Fig. 4e), and ICO2/IH2Os (Fig. 4f). A linear regression line
is calculated for each data set (fixed intercept = 0). All data sets yield a satisfactory correlation between Raman peak ratios and CO2 solubility, with a R² better than 0.98. Salinity affects the slope of the correlation line in all cases, with
various intensity (Fig. 5). The ratio calculated to the bending vibration band of water are more sensitive to salinity than the one calculated to the stretching band water. The less sensitive to salinity is ACO2-1380/AH2Os. The most sensitive
a b
c d
e f
Fig. 4: peak area and peak intensity ratios as a function CO2 solubility and NaCl concentration (M, mol.kg-1H2O). (a) ACO2/AH2Ob, (b) ACO2/AH2Os,
4848 Marie-Camille Caumon et al. / Energy Procedia 114 ( 2017 ) 4843 – 4850
Fig. 5: evolution of the slope of the correlation curves in Fig. 4 with salinity, after normalization to the slope in pure water.
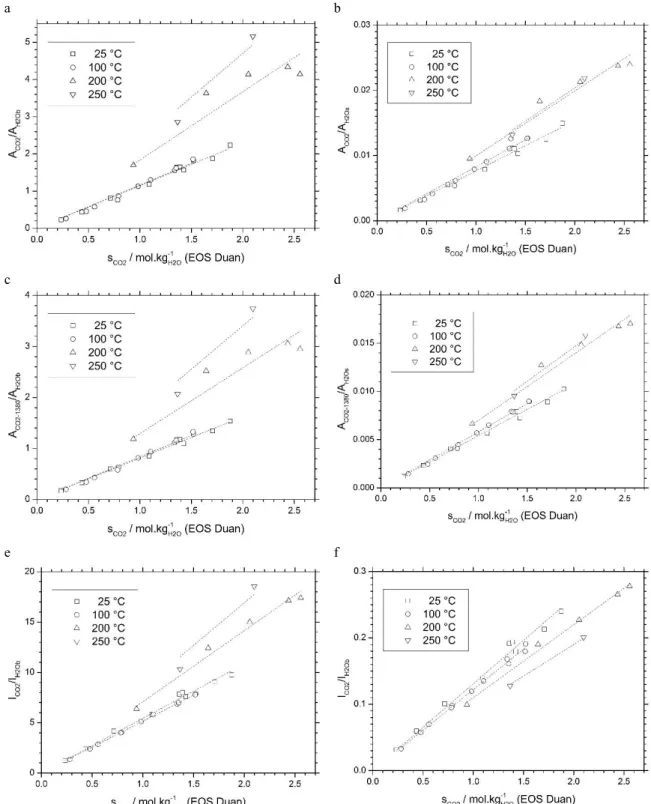
3.3. Effect of temperature
Raman spectra of dissolved CO2 and water were recorded at four different temperatures (25, 100, 200, 250 °C) at
pressure up to 500 bar. The same peak area and intensity ratios are calculated and plotted in Fig. 6: ACO2/AH2Ob (Fig.
6a), ACO2/AH2Os (Fig. 6b), ACO2-1380/AH2Ob (Fig. 6c), ACO2-1380/AH2Os (Fig. 6d), ICO2/IH2Ob (Fig. 6e), and ICO2/IH2Os (Fig.
6f). A linear regression line is calculated for each data set (fixed intercept = 0). As the data set at 250 °C has only two data points, this correlation must be carefully considered.
The effect of temperature on the correlation between Raman peak ratios and temperature is weak between 25°C and 100 °C but becomes intense at 200 and 250 °C. The only ratio that remains coherent over the whole temperature range is ICO2 / IH2Os. This discrepancy between ratios might be due to a slow evaporation of the liquid phase, and so
leads to difficulty to reach equilibrium.
The ICO2 / IH2Os ratio, normalized to CO2 molality (QF), is plotted as a function of temperature, and compared to
the data of Guo et al. [2] (Fig. 7). Despite a small shift of our data toward higher values, the trend is very similar. The difference between the two data sets may be due to a difference of baseline subtraction, of the spectrometer response, or in equilibrium procedures.
a b
c d
e f
Fig. 6: peak area and peak intensity ratios as a function CO2 solubility and temperature in pure water. (a) ACO2/AH2Ob, (b) ACO2/AH2Os, (c)
4850 Marie-Camille Caumon et al. / Energy Procedia 114 ( 2017 ) 4843 – 4850
Fig. 7: QF (= to (ICO2/IH2Os)/sCO2) as a function of temperature in pure water. Comparison of this study (Fig. 6f) with the study of Guo et al. [2].
4. Conclusion
Microcapillaires, connected to a pressurization device, have been used to determine CO2 solubility in saline water
at 25 °C in the range 0-4 M NaCl, and in pure water as a function of temperature in the range 25 °C-250 °C. This device makes possible fast and reproducible measurements, in a large range of pressure, temperature and salinity that covers the range of interest of CO2 geological storage.
The linearity of the response as a function of salinity, whatever which ratio is calculated (intensity or area, to the bending or stretching vibration band of water), confirms the validity of the equation of state of Duan and Sun [1] in this range of experiment (25 °C, 0-4 M NaCl).
Acknowledgements
This work was supported by the ANR grant CGSµLab (CGSμLab-ANR-12-SEED-0001).
References
[1] Duan, Z., Sun, R., 2003. An improved model calculating CO2 solubility in pure water and aqueous NaCl solutions from 273 to 533 K and
from 0 to 2000 bar. Chem. Geol., 2003, 193, 257–271.
[2] Guo, H., Chen, Y., Hu, Q., Lu, W., et al., 2014. Quantitative Raman spectroscopic investigation of geo-fluids high-pressure phase equilibria: Part I. Accurate calibration and determination of CO2 solubility in water from 273.15 to 573.15 K and from 10 to 120 MPa.
Fluid Phase Equilibria, 2014, 382, 70–79.
[3] Caumon, M.-C., Sterpenich, J., Randi, A., Pironon, J., 2016. Measuring mutual solubility in the H2O–CO2 system up to 200 bar and 100 °C
by in situ Raman spectroscopy. Int. J. Greenh. Gas Control, 2016, 47, 63–70.
[4] Chou, I.M., Burruss, R.C., Lu, W., 2005. In: Chen, J, Wang, Y, Duffy, TS, Shen, G, Dobrzhinetskaya, LF (Eds.), Adv. High-Press.
Technol. Geophys. Appl., Elsevier, Amsterdam, pp. 475–485.
[5] Caumon, M.-C., Robert, P., Laverret, E., Tarantola, A., et al., 2014. Determination of methane content in NaCl–H2O fluid inclusions by
Raman spectroscopy. Calibration and application to the external part of the Central Alps (Switzerland). Chem. Geol., 2014, 378–379, 52– 61.
[6] Baonza, V.G., Rull, F., Dubessy, J., 2012. In: Dubessy, J, Caumon, M-C, Rull, F (Eds.), Raman Spectrosc. Appl. Earth Sci. Cult. Herit., vol. 12, The European Mineralogical Union and the Mineralogical Society of Great Britain, London, pp. 279–320.
![Fig. 2: the HPOC system after Caumon et al. [5]. HPP: high pressure pump; P: pressure transducer; V: valve; VP: vacuum pump; FSC: fused silica capsule](https://thumb-eu.123doks.com/thumbv2/123doknet/14768527.589772/4.816.200.600.234.519/hpoc-caumon-pressure-pressure-transducer-vacuum-silica-capsule.webp)